
FEDS Notes
 Print
PrintAugust 5, 2016
Funding Agreement-Backed Securities in the Enhanced Financial Accounts
Nathan Foley-Fisher, Ralf R. Meisenzahl, Borghan Narajabad, Maria G. Perozek, and Stephane H. Verani
This note describes new data on funding agreement-backed securities (FABS) that is being provided as part of the Enhanced Financial Accounts (EFA) initiative. As described in Holmquist and Perozek (2016), the Financial Accounts of the United States report the aggregate amount of outstanding FABS at a quarterly frequency. This EFA project expands upon the Financial Accounts data by providing daily data for different types of FABS that vary by maturity at issue and embedded optionality. The more granular data presented in this EFA project provides a clearer picture of developments in this important funding market, including the run on a segment of the FABS market starting in the summer of 2007 (Foley-Fisher, Narajabad, and Verani 2015). The project thus furthers the goals of the EFA initiative--described in Gallin and Smith (2014)--to provide a more detailed and higher frequency picture of financial intermediation in the United States.
What are funding agreement-backed securities?
A funding agreement is a deposit-type contract, sold by life insurance companies, that typically pays a guaranteed rate of return over a specified period of time. As their name suggests, these insurance contracts are akin to deposits in that they contain no mortality or morbidity contingencies. Insurers make money by issuing these contracts and investing the proceeds in relatively higher yielding assets. Funding agreements have long been issued directly to municipalities and institutional investors, but in more recent years insurance companies began to set up special purpose entities (SPEs) to hold funding agreements and issue funding agreement-backed securities (FABS). Backed by a super-senior claim on the insurer's balance sheet, FABS attract a range of potential investors and allow insurers to borrow at a lower cost than other forms of debt.1
In a typical FABS structure, a life insurer sells a single funding agreement to an SPE, which funds the funding agreement by issuing smaller denomination FABS to institutional investors. The most common type of FABS are medium-term funding agreement-backed notes (FABN).2 In addition, at least two types of FABS are designed to appeal to short-term investors, such as prime money-market mutual funds: Extendible funding agreement-backed notes (XFABN), and funding agreement-backed commercial paper (FABCP). These securities have much shorter maturities than the underlying funding agreement, which typically has a maturity of about ten years. XFABN often have an initial maturity of 397 days, but give investors the option each month to incrementally extend the maturity of their notes by one month. FABCP are fixed term contracts with maturities generally ranging from one week to six months.3
FABS in the Financial Accounts of the United States
Aggregate quarterly values for the outstanding levels of domestic and foreign issues of FABS associated with U.S. life insurers are available from 1997:Q3 forward in the Financial Accounts of the United States. For more information on how FABS are recorded in the Financial Accounts, see Holmquist and Perozek (2016). To track the FABS market, we compile data from a variety of sources.4
 |
|
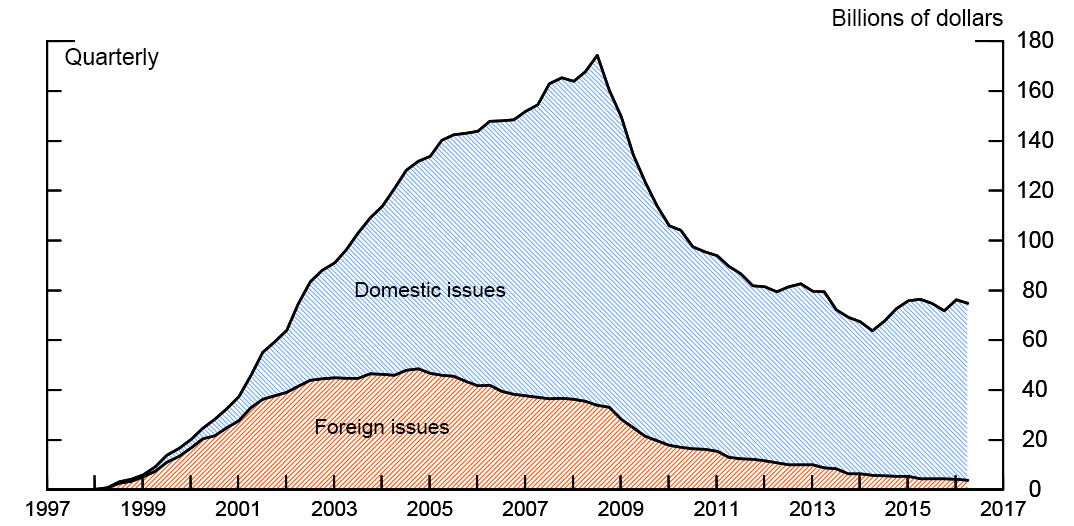
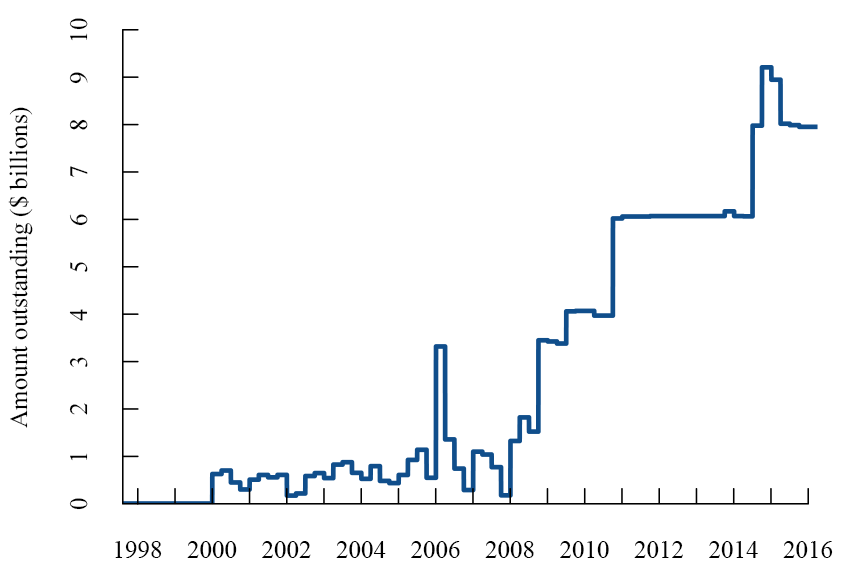
Source: Federal Reserve Board. Financial Accounts of the United States (Z.1). https://www.federalreserve.gov/apps/fof/.
Figure 1 shows that FABS issuance grew rapidly in the early 2000s, when persistently low interest rates and the introduction of greater regulatory capital requirements led U.S. life insurers to search for new ways to increase their return on equity.5 By 2008, the total outstanding value of the FABS market reached over $170 billion, comparable to the size of the auto ABS market at that time.
The FABS market collapsed during the financial crisis as institutional investors withdrew from structured product markets.6 Following its initial sharp descent in the early years of the financial crisis, FABS outstanding continued to decline, albeit at a slower rate, through the end of 2013, when the level of FABS fell to about $60 billion--just over one-third of the amount outstanding at its peak in 2008. FABS issuance has since rebounded somewhat, with our most recent estimates suggesting that FABS outstanding reached about $75 billion in 2016:Q1.
FABS in the Enhanced Financial Accounts
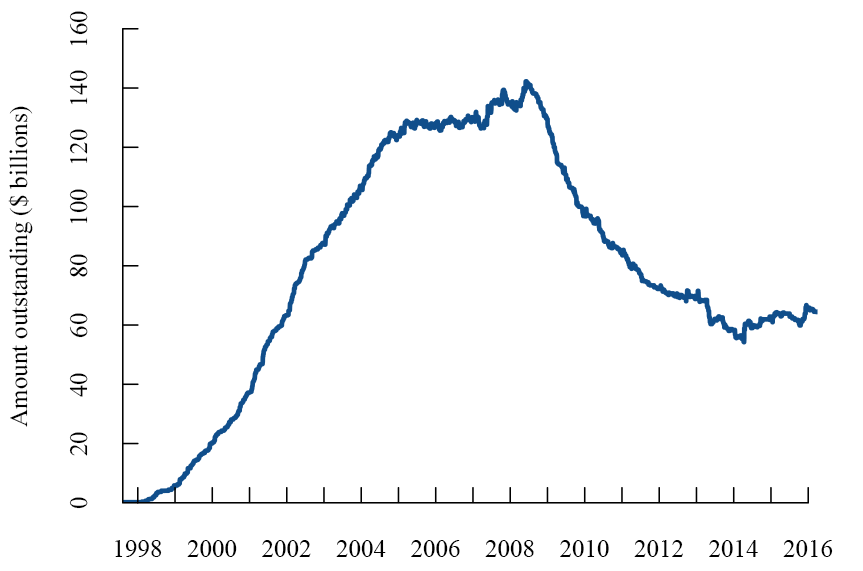
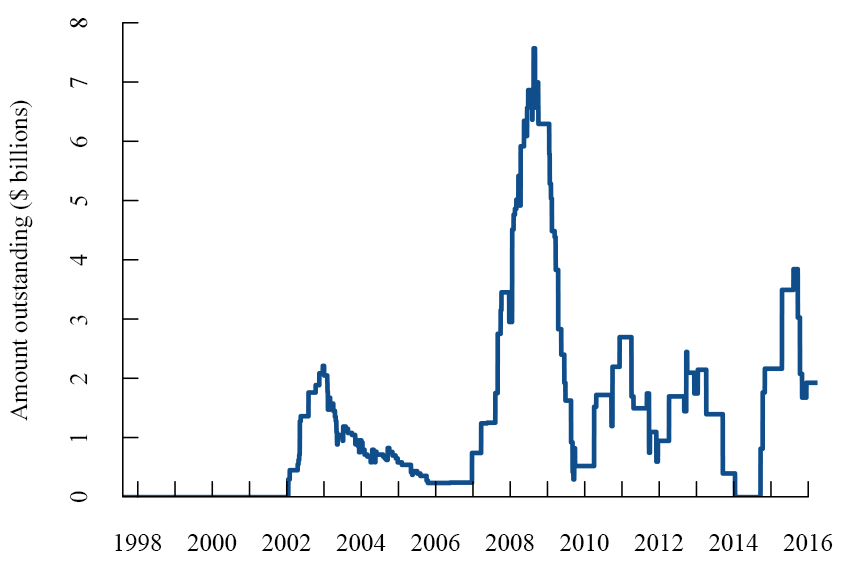
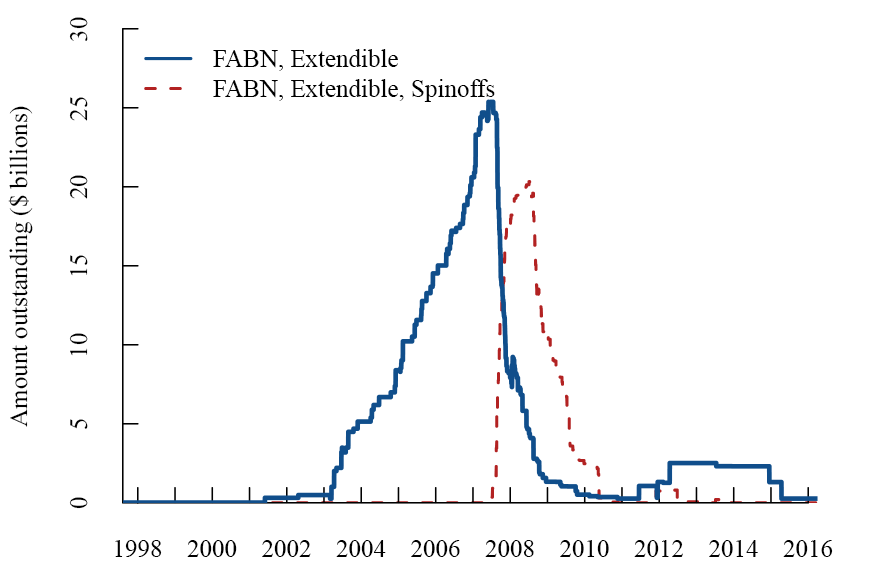
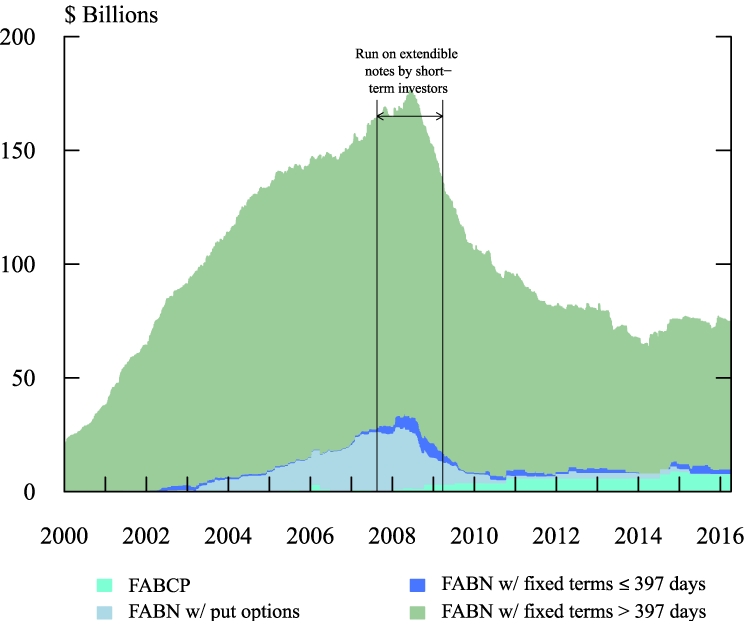
To better understand the dynamics of the collapse of the FABS market during the financial crisis, and, more broadly, to monitor this funding market going forward, the EFA project provides FABS data with both higher frequency and greater granularity than the data reported in the Financial Accounts. In particular, the EFA project provides daily data on the three main types of FABS issues: FABN with fixed terms of more than 397 days (Figure 2), FABN with fixed terms less than or equal to 397 days (Figure 3), and FABN with embedded put options such as XFABN (Figure 4). In addition, the EFA project provides quarterly data on FABCP (Figure 5). As shown in Figure 6, FABN with longer maturities comprise the vast majority of FABS outstanding. However, a closer look at the underlying data reveals that it was a run on XFABN starting in the summer of 2007 that sparked the severe and sudden contraction of FABS funding during the financial crisis.
 |
|
Data as of March 31, 2016.
Source: Bloomberg Finance LP and Moody's ABCP Program Index.
 |
|
 |
|
 |
|
Source: Bloomberg Financial LP, Moody's Analytics, Fitch Research.
During the second half of the 2000s, U.S. life insurers accelerated their issuance of XFABN shown as the blue line in Figure 4. And, as with other short-term funding markets, such as the asset-backed commercial paper and repo markets, the market for XFABNbegan to collapse during the summer of 2007 when institutional investors suddenly stopped extending their XFABN. In accordance with the contractual terms, upon giving their withdrawal notice, the investors received new securities--so-called spinoffs, shown by the dashed red line in Figure 4--set to mature at a fixed date, typically about one year after the withdrawal notice.
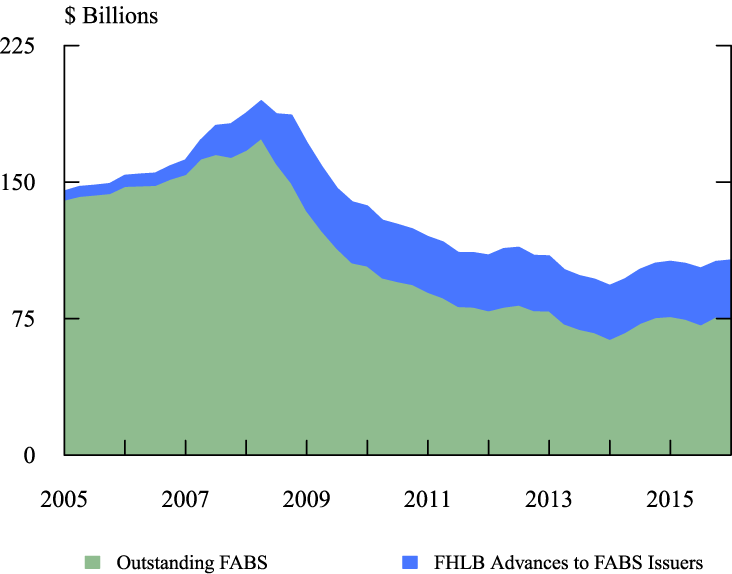
Life insurers responded to the collapsing FABS market by issuing shorter maturity FABN, as shown in Figure 3, and FABCP, shown in Figure 5, and also by issuing funding agreements directly to the Federal Home Loan Banks (FHLB).7 As with FABS, insurers earn a spread by investing the proceeds of funding agreements placed with the FHLBs in a portfolio of real estate and non-real estate assets with higher yield than the cost of funding. As shown in Figure 7, the increase in FHLB advances during the financial crisis corresponds broadly to the reduction in FABS outstanding. While the FHLBs played a particular role by providing an effective liquidity backstop to these insurers during the financial crisis, FHLB advances have since become a more widely used source of wholesale funding for many life insurers.8
 |
|
Company names reflect top-level ownership as of March 31, 2016. Data as of March 31, 2016.
Source: authors' calculations based on the Federal Home Loan Bank database, provided by the FHLB Office of Finance.
Conclusion
This EFA project provides FABS data at a daily frequency and on a more granular level than is reported in the Financial Accounts. This additional detail on FABS can be used to gain a deeper understanding of several key financial relationships in the U.S. economy. First, the data by type of security show that there was a run on XFABN in third quarter of 2007 that is difficult to detect in more aggregate data. Second, the daily frequency of the FABS data help pinpoint the timing of short-term market disruptions such as occurred in 2007, enhancing our understanding of funding pressures during the recent financial crisis and in the future. Finally, the FABS data provide insight into substitution within asset classes: For example, as FABS funding dried up during the financial crisis, life insurers turned to shorter duration FABS as well as the FHLB system to ease liquidity strains. Going forward, the availability of daily data on the various types of FABS will enable ongoing monitoring of this important funding market, which appears to be on the rebound.
References
Acharya, Viral, Gara Afonso, and Anna Kovner (2013) "How do Global Banks Scramble for Liquidity? Evidence from the Asset-Backed Commercial Paper Freeze of 2007," Federal Reserve Bank of New York Staff Report No. 623.
Coval, Joshua, Jakub Jurek, and Erik Stafford (2009) "The Economics of Structured Finance," Journal of Economic Perspectives, 23(1): 3-25.
Foley-Fisher, Nathan, Borghan Narajabad, and Stéphane Verani (2015) "Self-fulfilling Runs: Evidence from the U.S. Life Insurance Industry," Finance and Economics Discussion Paper Series No. 2015-032.
Gallin, Joshua, and Paul A. Smith (2014). "Enhanced Financial Accounts," FEDS Notes. Washington: Board of Governors of the Federal Reserve System.
Holmquist, Elizabeth B., and Maria G. Perozek (2016). "Funding Agreement-Backed Securities in the Financial Accounts of the United States," FEDS Notes. Washington: Board of Governors of the Federal Reserve System.
1. A further benefit is that funding agreements do not increase standard measures of insurers' leverage as they are legally insurance contracts. Return to text
2. Between 1997 and 2013, FABNs' median maturity at issuance was 8 years. Return to text
3. XFABN and FABCP programs are similar to bank-sponsored asset-backed commercial paper (ABCP) programs with full liquidity guarantees from the sponsoring bank. In these programs the securities can be put back to the sponsoring insurer at rollover dates (in the case of FABCP) or with some months' notice, usually less than 397 days (in the case of XFABN). Return to text
4. In particular, we use rating agency announcements to identify SPEs that receive funding agreements. We then collect data from Bloomberg on all securities issued by each special purpose entity and backed by the funding agreement. Bloomberg typically covers all medium term and extendible term securities. We also collect data on FABCP issuance from rating agency reports, which are available quarterly. We aggregate these data up to the level of the insurer parent company to obtain a quarterly dataset of FABS issuance and amounts outstanding. Return to text
5. For more background information and discussion, see Foley-Fisher, Narajabad, and Verani (2015). Return to text
6. See Coval, Jurek, and Stafford (2009). Return to text
7. The total amount of advances from FHLBs to U.S. life insurers is reported in line 23 of Table L.116 in the Financial Accounts. Return to text
8. The movement by life insurers towards FHLBs is consistent with a broader shift in shadow bank funding towards the FHLB system. See Acharya, Afonso, and Kovner (2013). Return to text
Please cite as:
Foley-Fisher, Nathan, Ralf R. Meisenzahl, Borghan Narajabad, Maria G. Perozek, and Stephane H. Verani (2016). "Funding Agreement-Backed Securities in the Enhanced Financial Accounts," FEDS Notes. Washington: Board of Governors of the Federal Reserve System, August 5, 2016, http://dx.doi.org/10.17016/2380-7172.1823.
Disclaimer: FEDS Notes are articles in which Board economists offer their own views and present analysis on a range of topics in economics and finance. These articles are shorter and less technically oriented than FEDS Working Papers.
