
FEDS Notes
 Print
PrintJuly 29, 2016
Has Tax-Preferred Retirement Saving Offset Rising Wealth Concentration?
Sebastian Devlin-Foltz, Alice M. Henriques, and John E. Sabelhaus
The share of wealth owned by top wealth-holders in the U.S. has been rising over the past few decades, though there is some debate about exactly how concentrated wealth is, and how fast those top wealth shares are rising (Saez and Zucman 2014; Bricker, et al. 2016). One reason for varying estimates is that different types of wealth dominate at various points in the wealth distribution. For example, changes in house values and mortgage borrowing play a key role in determining wealth changes in the middle of the wealth distribution, and corporate equities and directly-held businesses disproportionately affect the very top.1 Retirement wealth lies somewhere in between those other types of assets, being less concentrated than directly-held businesses and corporate equities, but more concentrated than widely-held balance sheet components such as housing and durable goods.2
Understanding the role that retirement wealth plays in rising wealth inequality requires comprehensively measuring and then distributing retirement assets. The triennial Survey of Consumer Finances (SCF) is well-suited for this task as it covers a long time period, includes households headed by all age groups, and combines careful measurement of work-related pensions, personal retirement accounts, and earnings histories with other relevant demographic, income, and balance sheet information. Defined contribution (DC) and Individual Retirement Account (IRA) assets are measured directly in the survey. Defined benefit (DB) payments received by current beneficiaries are also collected; the asset value of those claims can be estimated by discounting survival-weighted income streams. The expected value of DB payments (for families holding claims to but not yet receiving DB payments) can be estimated using employment history and other relevant SCF data elements.3
Figure 1 documents the recent trend in retirement plan participation away from traditional DB plans into primarily DC plans. The share of working-age households with only DC plans rose from 27 percent in 1989 to 43 percent in 2013, while the share with any DB coverage fell from 50 percent to 30 percent over the same period. We now analyze how this shift in retirement plan types interacts with the growing prominence of retirement wealth within household wealth to affect trends in overall wealth distribution.
(Percent Share) |
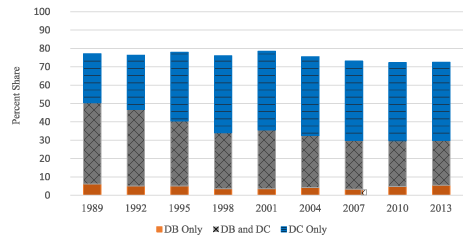 |
Source: Author's tabulations of the Survey of Consumer Finances. See Devlin-Foltz, Henriques, and Sabelhaus (2016) for details.
Effect on Overall Wealth Concentration
Analyzing the net effect of retirement wealth on overall trends in wealth inequality requires some perspective on the concentration of retirement and non-retirement wealth.4 The share of total wealth (including the distributed DB wealth) held by the top 1 percent of families (sorted by total wealth) rose 6 percentage points between 1989 and 2013, from 26 percent to 32 percent (figure 2, solid line). The share of total wealth held by the top 25 percent of wealth holders rose 5 percentage points, from 83 percent in 1989 to 88 percent in 2013 (figure 3, solid line). There are various ways in which retirement wealth can affect overall wealth concentration, but the data generally suggest the effect has been generally in the direction of mitigating wealth concentration at the very top, with a partial offset because of the broad shift from DB to DC plans in the workplace.5
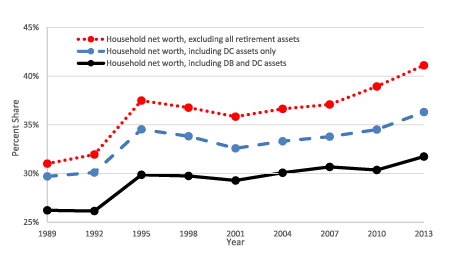 |
Source: Author's tabulations of the Survey of Consumer Finances. See Devlin-Foltz, Henriques, and Sabelhaus (2016) for details.
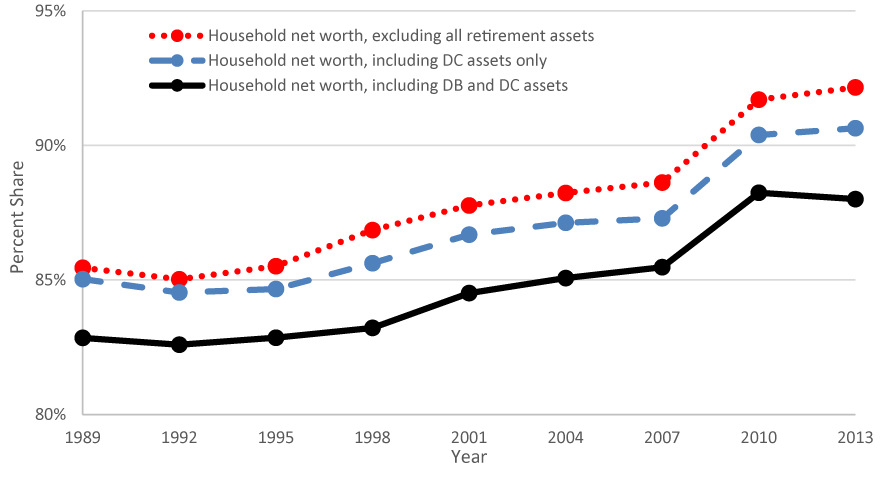 |
Source: Author's tabulations of the Survey of Consumer Finances. See Devlin-Foltz, Henriques, and Sabelhaus (2016) for details.
The first thing to note is that retirement wealth is much less concentrated than other forms of wealth.6 The share of total non-retirement wealth held by the top 1 percent of families (sorted by total non-retirement wealth) rose 10 percentage points between 1989 and 2013, from 31 percent to 41 percent (figure 2, dotted line) and the share of total non-retirement wealth owned by the top 25 percent rose 7 percentage points, from 85 percent in 1989 to 92 percent in 2013 (figure 3, dotted line). Thus, retirement wealth is less concentrated than non-retirement wealth at the very top, but the concentrations are much more similar for the top 25 percent.
The second observation is that retirement wealth is offsetting rising wealth concentration over time, because retirement assets are growing faster than non-retirement assets. In 1989, retirement wealth accounted for about 20 percent of household net worth, and that has risen to about 30 percent as of 2013.7 Given that retirement wealth is increasing relative to non-retirement wealth, and retirement wealth is less concentrated than non-retirement wealth, the direct effect is that the tax-preferred retirement system helped to offset rising wealth concentration at the very top. The top 1 percent of wealth holders own approximately 7 to 8 percent of retirement wealth in all years, but they own about 31 percent of non-retirement wealth in 1989 and 41 percent of non-retirement wealth by 2013. Whether one weights by the starting or ending shares of wealth owned by the top 1 percent, the effect of changing wealth composition is certainly noticeable, offsetting 2 to 3 percentage points of the 10 percentage point increase in non-retirement wealth concentration.
Retirement wealth also mitigated rising wealth concentration for the top 25 percent of wealth holders, though the effect is much more modest, because retirement and non-retirement wealth shares are similar. The top 25 percent of wealth holders (sorted by total wealth) own roughly 82 percent of all DC wealth, and about 80 percent of DB wealth. These values are below the non-retirement wealth shares (92%) for the top 25 percent, but much less dramatically so than for the top 1 percent. Thus, the increase in retirement wealth on the household balance sheet did less to offset the increasing wealth share of the top 25 percent.
Working in the other direction, DC wealth is more concentrated than DB wealth, and thus the shift from DB to DC increased wealth concentration (the shares of DB and DC assets held by the top 1 percent and top 25 percent of wealth holders have remained relatively stable over time). Measures of concentration using only DC assets and non-retirement wealth (basically the published SCF wealth estimates, the dashed lines in figures 1 and 2) are between the total wealth and non-retirement wealth concentration lines, as DC assets are more concentrated than DB assets.
The differentials in concentration of DB and DC wealth leads to the following counterfactual calculations meant to address the question of whether the shift from DB to DC contributes to rising overall wealth concentration. The top 1 percent owns about 5 percent of DB wealth and about 15 percent of DC wealth, and the trends over time in those shares may be slightly positive, but they are second order. Holding the share of wealth accounted for by retirement wealth constant at the 1989 value (20 percent), differences in DC and DB concentration suggest that the increase in the DC share of retirement assets (from 30 percent in 1989 to 50 percent in 2013, figure 2) increased wealth concentration at the top by about 0.4 percentage points (the 10 percentage point differential in DB versus DC concentration * 20 percentage point shift in composition from DB to DC * 20 percent retirement asset share in 1989). Weighting instead by the 2013 retirement wealth share (30 percent) would increase that to 0.6 percentage points, but either way the effect is modest relative to the overall 6 percentage point increase in the overall top 1 percent wealth share, or the 10 percentage point increase in the non-retirement wealth share. The results are qualitatively similar for the top 25 percent wealth group, with the shift from DB to DC accounting for as much as 1 percentage point of the 5 percentage point increase in the top 25 percent total wealth share.
Conclusions
Retirement wealth is less concentrated than non-retirement wealth in the U.S., and the observation that total wealth concentration is rising more slowly than non-retirement wealth concentration is consistent with the growth of retirement wealth relative to overall household sector net worth in recent decades. Said differently, on net, employer-sponsored pensions and other tax-preferred savings have offset some of the rapidly rising wealth inequality in other parts of the household balance sheet. The shift from DB to DC coverage, and the associated shift in the distribution of wealth because of differences in DB versus DC wealth concentration among top wealth holders, has partially offset the equalizing effect of rising retirement wealth.
References
Bricker, Jesse, Alice Henriques, Jacob Krimmel and John Sabelhaus. 2016. "Measuring Income and Wealth At the Top Using Administrative and Survey Data," Brookings Papers on Economic Activity, 2016:1. (Forthcoming)
Devlin-Foltz, Sebastian, Alice Henriques, and John Sabelhaus. 2016. "Is the U.S. Retirement System Contributing to Rising Wealth Inequality?" Russell Sage Journal of the Social Sciences (Forthcoming).
Killewald, Alexandra, and Brielle Bryan. 2016. "Does Your Home Make You Wealthy?" Russell Sage Journal of the Social Sciences (Forthcoming).
Looney, Adam, and Kevin B. Moore. 2016. "Changes in the After-Tax Distribution of Wealth in the US: Has Income Tax Policy Increased Wealth Inequality?" Fiscal Studies, 37(1): 77-104. (March)
Saez, Emmanuel, and Gabriel Zucman. 2016. "Wealth Inequality in the United States since 1913: Evidence from Capitalized Income Tax Data," Quarterly Journal of Economics 131 (2): 519-578.
Wolff, Edward N. 2016. "Household Wealth Trends in the United States, 1962-2013: What Happened over the Great Recession?" Russell Sage Journal of the Social Sciences (Forthcoming).
1. Killewald and Bryan (2016) show that homeownership is a positive contributor to wealth accumulation in the middle of the wealth distribution, even after controlling for selection effects, though there is some heterogeneity in the effects of homeownership by race, with the returns to home-owning for white families more than double that for African American families. Return to text
2. In this note, we focus only on private wealth held by households, either directly or indirectly through future private pension claims. We do not include future benefits from Social Security. For discussion of the interaction between Social Security and private retirement wealth, see Devlin-Foltz, Henriques, and Sabelhaus (2016). Return to text
3. For more information on methodology see Devlin-Foltz, Henriques and Sabelhaus (2016). Return to text
4. In addition to thinking about the concentration of retirement and non-retirement wealth, it is also important to note that structural changes in retirement plans themselves may impact the levels of wealth inside and outside accounts. For example, the shift from DB to DC may have led some to shift liquid assets from after-tax holdings to retirement accounts. Or, as Wolff (2016) notes, there was an increase in household leverage in recent decades, and for some we may observe the increase debt (like mortgages) in the non-retirement accounts while the financial assets (implicitly) funded by that debt are in retirement accounts. Return to text
5. Looney and Moore (2016) discuss how the before-tax nature of retirement wealth affects overall estimated wealth concentration. Retirement account withdrawals are generally taxed at higher rates for higher-wealth families, so estimated wealth concentration is lower on an after-tax basis, though the effect is relatively modest. Return to text
6. This is at least in part mechanical, because of binding caps on tax-preferred savings (both DB and DC) in the top wealth groups. Return to text
7. See Devlin-Foltz, Henriques and Sabelhaus (2016). Return to text
Please cite this note as:
Devlin-Foltz, Sebastian, Alice M. Henriques, and John E. Sabelhaus (2016). "Has Tax-Preferred Retirement Saving Offset Rising Wealth Concentration?," FEDS Notes. Washington: Board of Governors of the Federal Reserve System, July 29, 2016, http://dx.doi.org/10.17016/2380-7172.1811.
Disclaimer: FEDS Notes are articles in which Board economists offer their own views and present analysis on a range of topics in economics and finance. These articles are shorter and less technically oriented than FEDS Working Papers.
