
FEDS Notes
 Print
PrintOctober 19, 2016
"Limited Attention" and Inflation Expectations of Households
Claudia Sahm and Jason Sockin
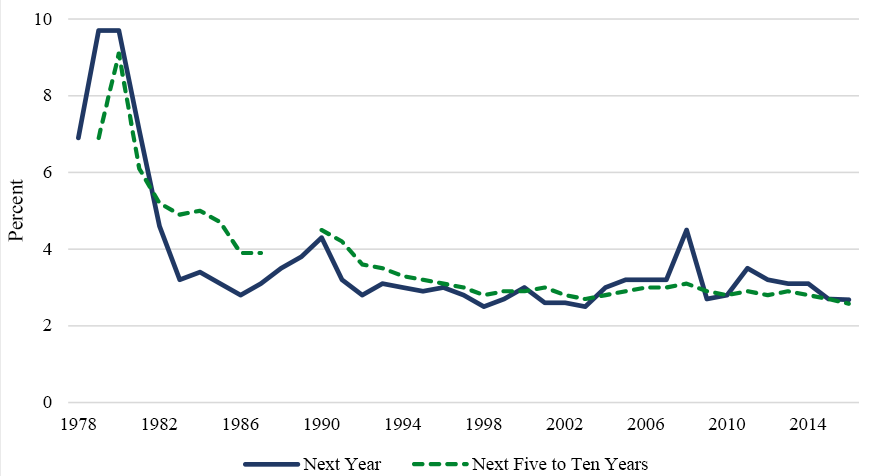
In 1980 the typical household expected prices to increase at a rate of nearly 10 percent per year; today median expected inflation is less than 3 percent, as shown in Figure 1.1 Moreover, since the mid-1990s, median expected inflation for both the next year and the next five to ten years has been low and relatively stable. The median, however, masks considerable variation across households and tells us little about how households form their expectations.
 |
|
Source: University of Michigan Surveys of Consumers. Annual averages. 2016 is the average through August. Longer-run questions were not asked in 1978, 1988, and 1989.
One possibility is that with actual inflation lower and more stable in recent decades, households may have been paying less attention to inflation and updating their expectations less frequently. Indeed, Coibion and Gorodnichenko (2015) find that expectations (of both professional forecasters and households) are updated slowly as models with "imperfect information" would predict. Moreover, they find that "information rigidities" have generally risen since the mid-1980s.2 In addition, in a time-series analysis, Nalewaik (2016) find that the median expectation of households has responded less to recent inflation data since the mid-1990s and has become less predictive of future inflation. In this note, we use the household-level data in the University of Michigan's Surveys of Consumers, including respondents' own changes in expectations, to document new signs that households pay limited attention to inflation developments. Of course, such limited attention may be sensible for households, given the costs and benefits of learning about inflation.
Non-Response as a Sign of Imperfect Information
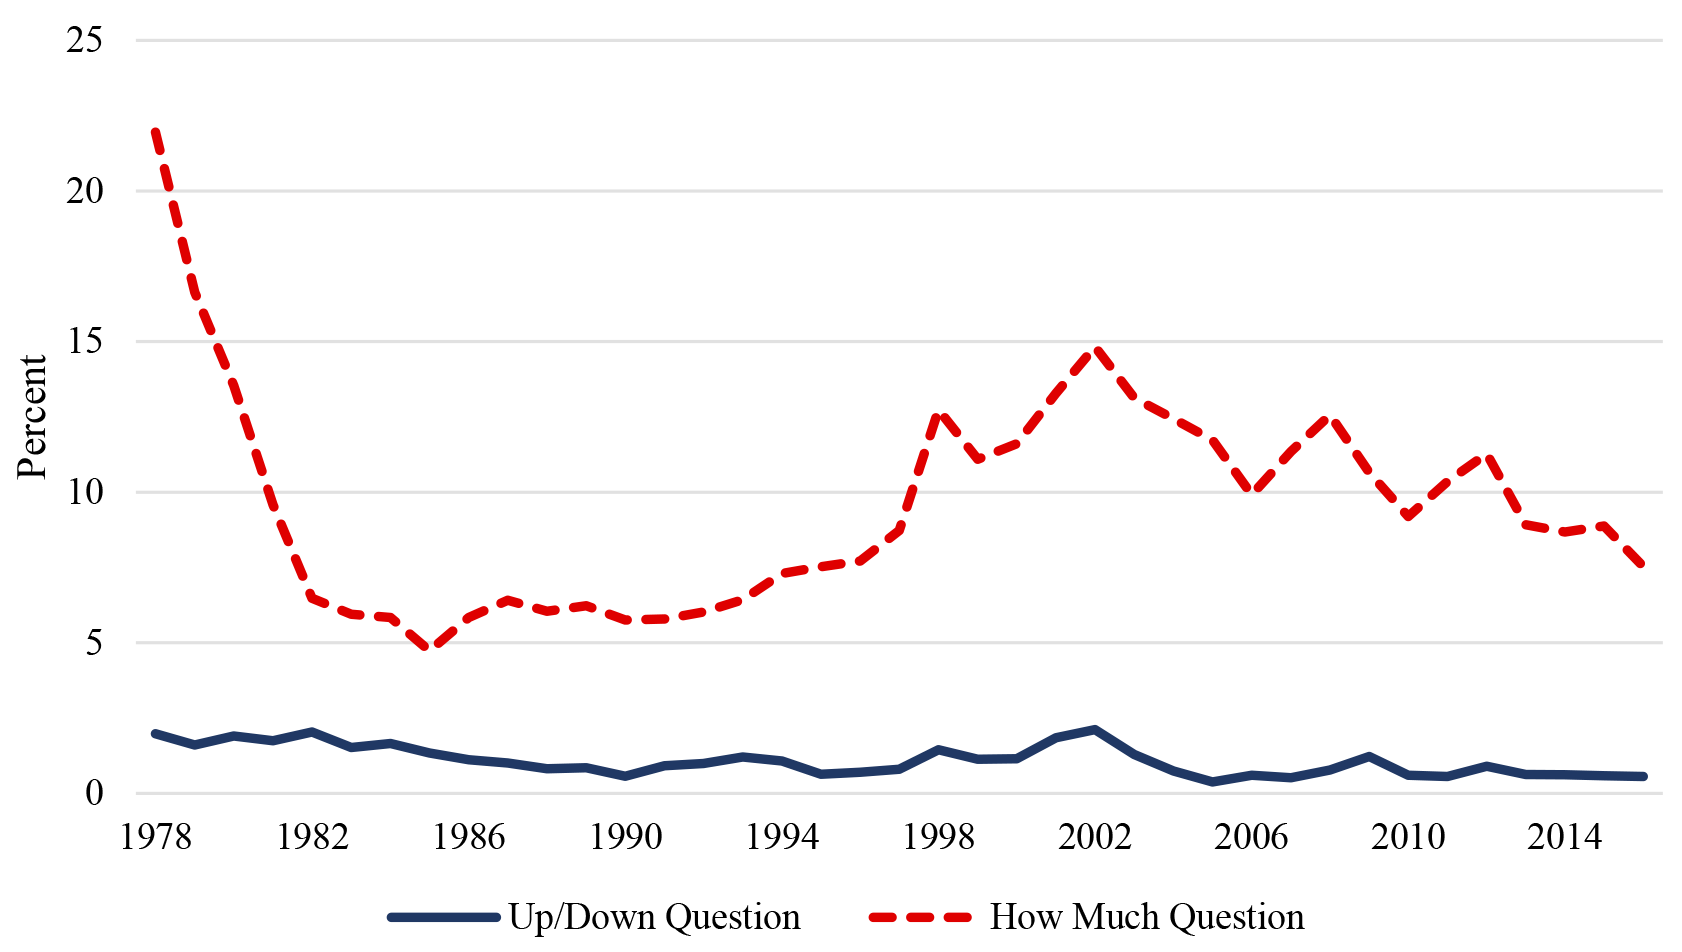
The rate of survey non-response to the questions on expected price changes is suggestive of information acquisition costs and choices made about the resources devoted to forming expectations. Only 1 percent of individuals surveyed from 1978 to 2016 did not offer an answer to the qualitative question on year-ahead expected prices (will prices move up, down, or stay the same), but 10 percent did not answer the quantitative follow up (by how much). And, as Figure 2 shows, the rate of non-response to the "how much" question has varied substantially over time.
 |
|
Source: University of Michigan Surveys of Consumers. Authors' calculations. Weighted.
The non-response rate fell sharply from over 20 percent in 1978 to a historic low of 5 percent in 1985, coinciding with a noticeable step down in actual and median expected inflation. Then non-response rate gradually trended up, reaching 15 percent in 2002, before drifting down some.3 Taken together, the non-response rates provide some indirect evidence on imperfect information.
News Heard about Prices and Updating Inflation Expectations
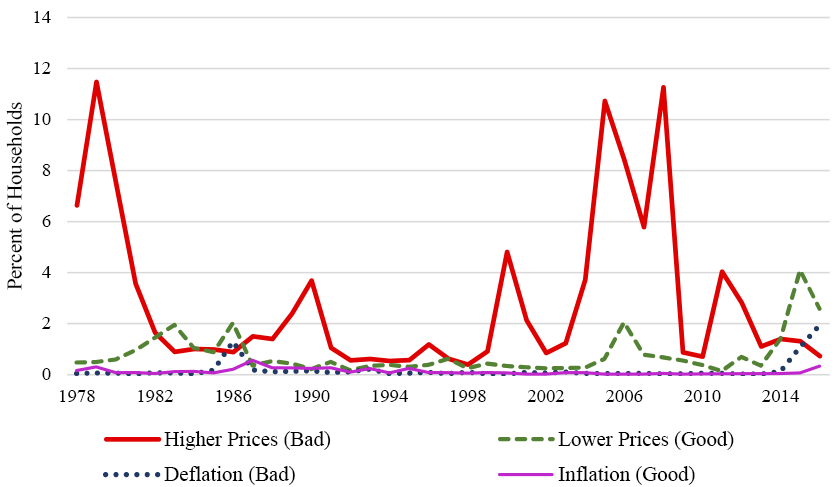
News heard about prices in the survey also shows that the awareness of inflation is fairly low, in general, but awareness appears to change with economic conditions. Moreover, higher prices appear to be more salient and result in more news reported by households than lower prices. Specifically, the survey asks:
"During the last few months, have you heard of any favorable or unfavorable changes in business conditions? What did you hear?"
The open-ended responses from individuals are coded as news (good and bad) in about fifty different categories by the Michigan Survey staff. Roughly 60 percent of respondents, in any given month, say they have heard some kind of news recently, with the most common news heard related to jobs. Bad news about higher prices--as defined by the survey respondents--is nearly four times more common than good news about lower prices, as Figure 3 shows. Still, only 4 percent of households, on average, since 1978, have reported any news related to price changes.4 Keep in mind that every month there is "news" about inflation as official statistics are regularly released, so the survey reports of news heard are a proxy for attention. The frequency of survey reports varies substantially over time and news about prices often rises when there are large changes in gas prices. Over 10 percent of households in 1979, 2005, and 2008 had heard bad news about higher prices, years in which gas prices jumped around 20 percent over more. Yet, comparably large declines in gas prices, such as in 1986 and 2015, led to fewer reports of price-related news. Even so, the past two years have seen the highest fraction of news on record from lower prices and deflation.
 |
|
Source: University of Michigan Surveys of Consumers. Authors' weighted calculations. Annual averages. 2016 is the average through August.
Next we look at whether awareness of prices changes, as measured by reports of price-related news, can help us understand changes in inflation expectations.5 Here we utilize the short panel of the survey. Starting in 1981, about 40 percent of the survey respondents were re-interviewed six months later. On average, year-ahead inflation expectations revise down 0.4 percentage point over the six months, though the median is no change.6 The average downward revision in longer-run expectations of 0.3 percentage point is somewhat smaller, but again the median is no change. The central tendency is for little change in individuals' expectations across the two interviews, which we might associate with being well-anchored; however, there is considerable dispersion. For example, the standard deviation of the six-month revision in year-ahead inflation is 6.5 percentage points. Some of the revisions are likely noise, reflecting the difficult nature of the question.7 Nonetheless, there are systematic changes in expectations too which may reflect updating on news about price changes.
The first column of Table 1 shows that individuals who heard news of higher prices or inflation in their second interview, revised up their year-ahead inflation expectations by 0.8 percentage point, more than a percentage point higher than the average six-month change. Those who heard news of lower prices or deflation revised down their expectations by a comparable amount. While these are sizeable effects, keep in mind that only a small fraction of individuals have heard news about prices, and that news is more likely to be about price increases than price decreases.
| Year-Ahead | 5 to 10 Years Ahead | |||
|---|---|---|---|---|
| (1) | (2) | (3) | (4) | |
| News of Higher Prices or Inflation | 0.8 | 0.7 | 0.3 | 0.4 |
| (0.2) | (0.2) | (0.15) | (0.1) | |
| News of Lower Prices or Deflation | -0.8 | -1.0 | 0.0 | -0.1 |
| (0.2) | (0.3) | (0.2) | (0.2) | |
| Years | 1981-2016 | 1996-2016 | 1981-2016* | 1996-2016 |
| Observations | 77,659 | 40,445 | 58,026 | 39,360 |
Note: Weighted linear regression using the short panel of University of Michigan Surveys of Consumers, includes year fixed effects. Standard errors in parentheses.
* No changes in longer-run expectations are available in 1988 and 1989. Return to text.
Focusing only on changes since the mid-1990s (column 2), we see a similar pattern of updating among those who heard price-related news. Turning to longer-run inflation expectations (column 3), we see less change related to price-related news than with short-run expectations. On average, longer-run expected inflation was revised up 0.3 percentage point by those who cited news about rising prices, and unchanged by those who heard news of lower prices. Since the mid-1990s, news of lower prices was associated with a modest downward revision to longer-run expectations, but the effect is not statistically different from no change.
Conclusion
It is an open question why households appear to pay more attention to recent price increases than to price decreases, at least in terms of the news they report.8 Even with the lower inflation in recent decades, it is higher prices that have driven the news reported about price changes. Beyond a handful of spikes in gas prices, the saliency of recent price changes is quite low. While news reports are associated with updating expectations, the vast majority of the within-person revisions to inflation expectations are left unexplained. Of course, individuals can learn about inflation from their own life experiences and news about other economic developments may also shape their expectations about prices.9 Even so, the asymmetry in the attention to price-related news is consistent with how individuals perceive the relative effect of inflation on their families. Less than 1 percent of individuals who say that their families are better off than last year cite lower prices as the reason. In contrast, 30 percent who report being worse off point to higher prices as the reason.10
Since information is costly to obtain and to interpret, it could make good sense for individuals to focus their attention on the outcomes which have affected them most. Still more research is needed to understand how people form inflation expectations and what leads them to change those expectations.
References
Andolfatto, David, Scott Hendry, and Kevin Moran. (2007). "Are Inflation Expectations Rational?" Journal of Monetary Economics 55(2), 406-422.
Armantier, Olivier, Wändi Bruine de Bruin, Simon Potter, Giorgio Topa,Wilbert van der Klaauw, and Basit Zafar (2013) "Measuring Inflation Expectations" Annual Review of Economics 5, p 273-301.
Armantier, Olivier, Scott Nelson, Giorgio Topa, Wilbert van der Klaauw, and Basit Zafar (2016). "The Price is Right: Updating Inflation Expectations in a Randomized Price Information Experiment." The Review of Economics and Statistics. 98(3), 503-523.
Binder, Carola. (2015). "Measuring Uncertainty Based on Rounding: New Method and Application to Inflation Expectations." Working Paper, Haverford College.
Carroll, C. D. (2003). Macroeconomic expectations of households and professional forecasters. Quarterly Journal of Economics 118 (1), 269-298.
Coibion, Olivier and Yuriy Gorodnichenko (2015). "Information Rigidity and the Expectations Formation Process: A Simple Framework and New Facts." American Economic Review 105(8), 2644-2678.
Detmeister, Alan, Daeus Jorento, Emily Massaro, and Ekaterina Peneva (2015) "Did the Fed's Announcement of an Inflation Objective Influence Expectations?" FEDS Notes 2015-06- 08. Board of Governors of the Federal Reserve System.
Dräger, Lena, Michael J. Lamla, Damjan Pfajfar. (2016) "Are Survey Expectations Theory- Consistent? The Role of Central Bank Communication and News." European Economic Review. Volume 85, June 2016, 84111.
Malmendier, Ulrike and Stefan Nagel (2016). "Learning from Inflation Experiences." The Quarterly Journal of Economics. 131(1), 53-87.
Mankiw, N. Gregory, Ricardo Reis, and Justin Wolfers (2004). "Disagreement about Inflation Expectations," NBER Macroeconomics Annual 2003, 209-248.
Nalewaik, Jeremy. (2016). "Inflation Expectations and the Stabilization of Inflation: Alternative Hypotheses." Finance and Economics Discussion Series, 2016-035. Board of Governors of the Federal Reserve System.
1. The expected prices changes are asked in the Michigan Survey http://www.sca.isr.umich.edu/  with two questions: "During the next (12 months/five to ten years), do you think that prices in general will go up, or go down, or stay where they are now? By about what (percent/cents on the dollar) do you expect prices to go (up/down) on the average, during the next (12 months/five to ten years)?" Return to text
2. Coibion and Gorodnichenko (2015) analyze expectations for several economic outcomes, including inflation, and they also find higher frequency variation in their measure of information rigidities after major events and during the business cycle. Their results suggest that the process of acquiring and interpreting information likely depends on economic conditions. For earlier empirical studies on two different classes of imperfect information models and inflation expectations, see also Mankiw, Reis, and Wolfers (2004) with sticky information and Andolfatto, Hendry, and Moran (2007) with noisy information. Return to text
3. In addition, non-response differs systematically by demographics. For example, women, older individuals, and the less educated are all less likely to answer the "how much" question. In a randomized experiment, Armentier, Nelson, Topa, van der Klaauw, and Zafar (2016) also find gender differences in the updating of expectations when individuals are given information about inflation. Return to text
4. Tabulations in this note only include the first news item reported. Results are qualitatively similar if the second news item (when reported) is also considered. The groupings of price-related news in Figure 3 follow the coding in the Michigan Survey. The mapping of the survey responses to economic concepts is imprecise and it is the survey respondents, who (subjectively) determine what is good or bad news. Return to text
5. The survey question refers to news heard "during the last few months," so it is more likely related to high frequency changes in prices, as opposed to more persistent trends, such as the downshift in inflation. Return to text
6. The median revision between the two interviews is zero in every year in the sample, but the average revision, as well as the inter-quartile range of revisions, does vary some over time. Return to text
7. For example, see Armantier, Bruine de Bruin, Potter, Topa, van der Klaauw, and Zafar (2013) for a discussion of how the specific wording of the Michigan survey question, which focuses on "price changes" not inflation, may be creating noise and Carola Binder (2015) on how "round-number" bias may affect inflation expectations in the Michigan survey. Return to text
8. Carroll (2003) and Dräger, Lamla, and Pfajfar (2016) are further studies on how news may affect the formation of household expectations. Return to text
9. In terms of life experience, Malmendier and Nagel (2016) find that age and the inflation personally lived through shapes an individuals' inflation expectations. As an example of how monetary policy may affect inflation expectations, Detmeister, Jorento, Massaro, and Peneva (2015) document that households' long-run inflation expectations did not change after the FOMC announced its 2-percent objective in January 2012. Return to text
10. Averages are calculated from 1978 to 2016. Individuals are asked: "We are interested in how people are getting along financially these days. Would you say that you (and your family living there) are better off or worse off financially than you were a year ago?" and the follow up asks: "Why do you say so?" Return to text
Please cite as:
Sahm, Claudia, and Jason Sockin (2016). "'Limited Attention' and Inflation Expectations of Households," FEDS Notes. Washington: Board of Governors of the Federal Reserve System, October 19, 2016, https://doi.org/10.17016/2380-7172.1830.
Disclaimer: FEDS Notes are articles in which Board economists offer their own views and present analysis on a range of topics in economics and finance. These articles are shorter and less technically oriented than FEDS Working Papers.