
FEDS Notes
 Print
PrintJune 2, 2016
Macroeconomic Sources of Recent Interest Rate Fluctuations
Stefania D'Amico, Thomas B. King, and Min Wei 1
The authors use a new statistical method to attribute daily changes in U.S. Treasury yields and inflation compensation to changes in investor beliefs about domestic and foreign growth, inflation, and monetary policy. They find that, while foreign developments have been important drivers of U.S. yields and expected inflation over the last decade, the recent divergence between U.S. and European monetary policy has had little effect. Instead, the behavior of asset prices seems consistent with positive "aggregate supply shocks." One candidate for such shocks is the large decline in energy prices experienced since June 2014.
Between mid-2014 and late 2015, U.S. labor-market conditions continued to improve, and FOMC communications increasingly pointed to a first interest rate hike in almost a decade, which occurred in December. We would have expected these developments to be associated with a rise in longer-term Treasury yields, as often observed prior to past episodes of monetary policy tightening. Expectations for inflation also usually increase prior to policy tightening, as the strengthening economy leads market participants to anticipate rising prices.
In stark contrast to this typical pattern, however, nominal U.S. Treasury yields declined slightly over this period, and a proxy for expected inflation given by the spread between nominal yields and those on Treasury inflation-protected securities (TIPS), also known as inflation compensation, decreased significantly. In this FEDS Note, we use new empirical methods based on comparisons of daily relative movements in asset prices to explain this seemingly anomalous behavior.
One possible explanation for the puzzling movement in Treasury yields and inflation compensation that has received some attention is that slowing global economic growth and disinflationary pressures abroad may have spilled over into U.S. markets over this period. For example, over the last several years European developments have frequently figured prominently in the financial news, and, unlike the Fed, the European Central Bank has aggressively eased policy in recent months. Our analysis is broadly consistent with these observations: We find that global shocks were important drivers of U.S. yields and expected inflation over the last decade. However, those shocks appeared to be less important during the run-up to the FOMC's recent rate increase.
Instead, we find that, between June 2014 and December 2015, market participants' expected U.S. growth trended higher, while expected U.S. inflation trended lower. These two phenomena had offsetting effects on longer-term U.S. interest rates. This combination of stronger growth and weaker inflation sounds very much like a classic "aggregate supply shock," i.e., an event that causes output and prices to move in opposite directions. A natural candidate for such a shock is the large decrease in oil prices that began in the second quarter of 2014.
Recent trends in U.S. and European yields
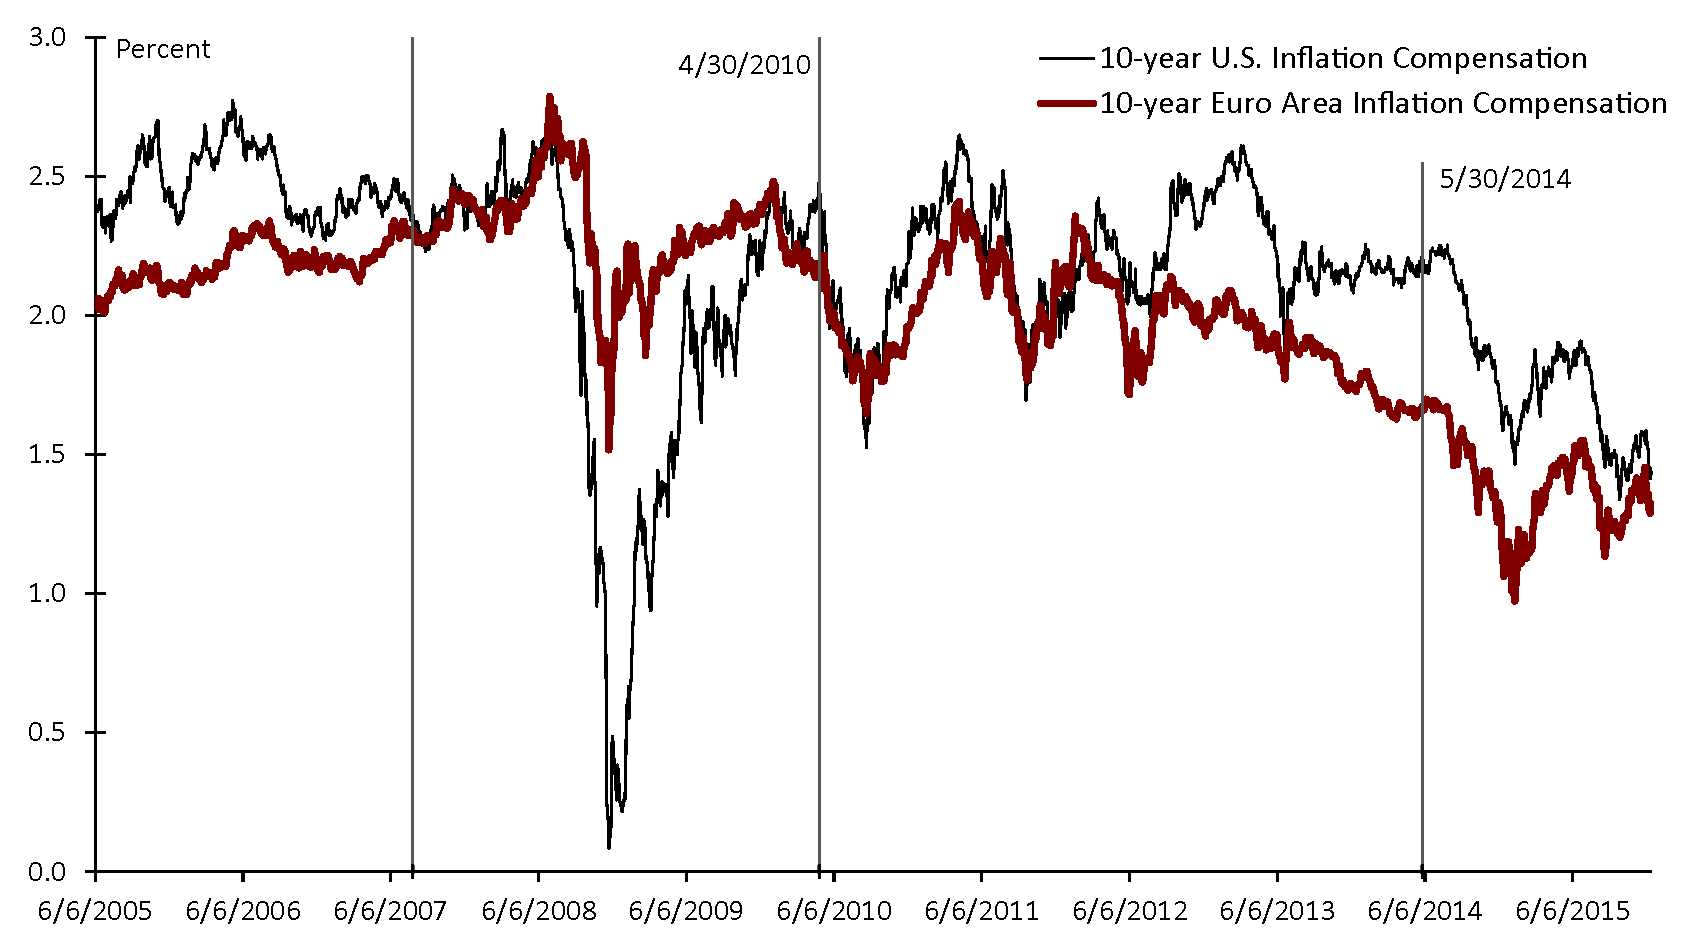
The black lines in Figures 1 and 2 show daily movements in the 10-year nominal U.S. Treasury yield and 10-year TIPS inflation compensation from June 2005 to December 2015.2 The large net declines in both yields and inflation compensation during the recent financial crisis are consistent with the weaker growth, aggressive policy easing, and declining energy prices that buffeted the U.S. economy in 2008 and 2009. Between early 2010 and mid-2014, yields drifted down further, amid continued easing by the Federal Reserve, while inflation compensation fluctuated within a 100-basis-point range. Between mid-2014 and December 2015, yields and inflation compensation have come down further, despite fairly steady data on economic growth and core inflation and the approaching first rate hike in almost ten years. This seems particularly odd since, even before the actual rate increase, survey evidence shows that market participants believed that the FOMC would act to increase short-term interest rates in the relatively near future.3 Typically, these beliefs would be associated with increases in longer-term yields.
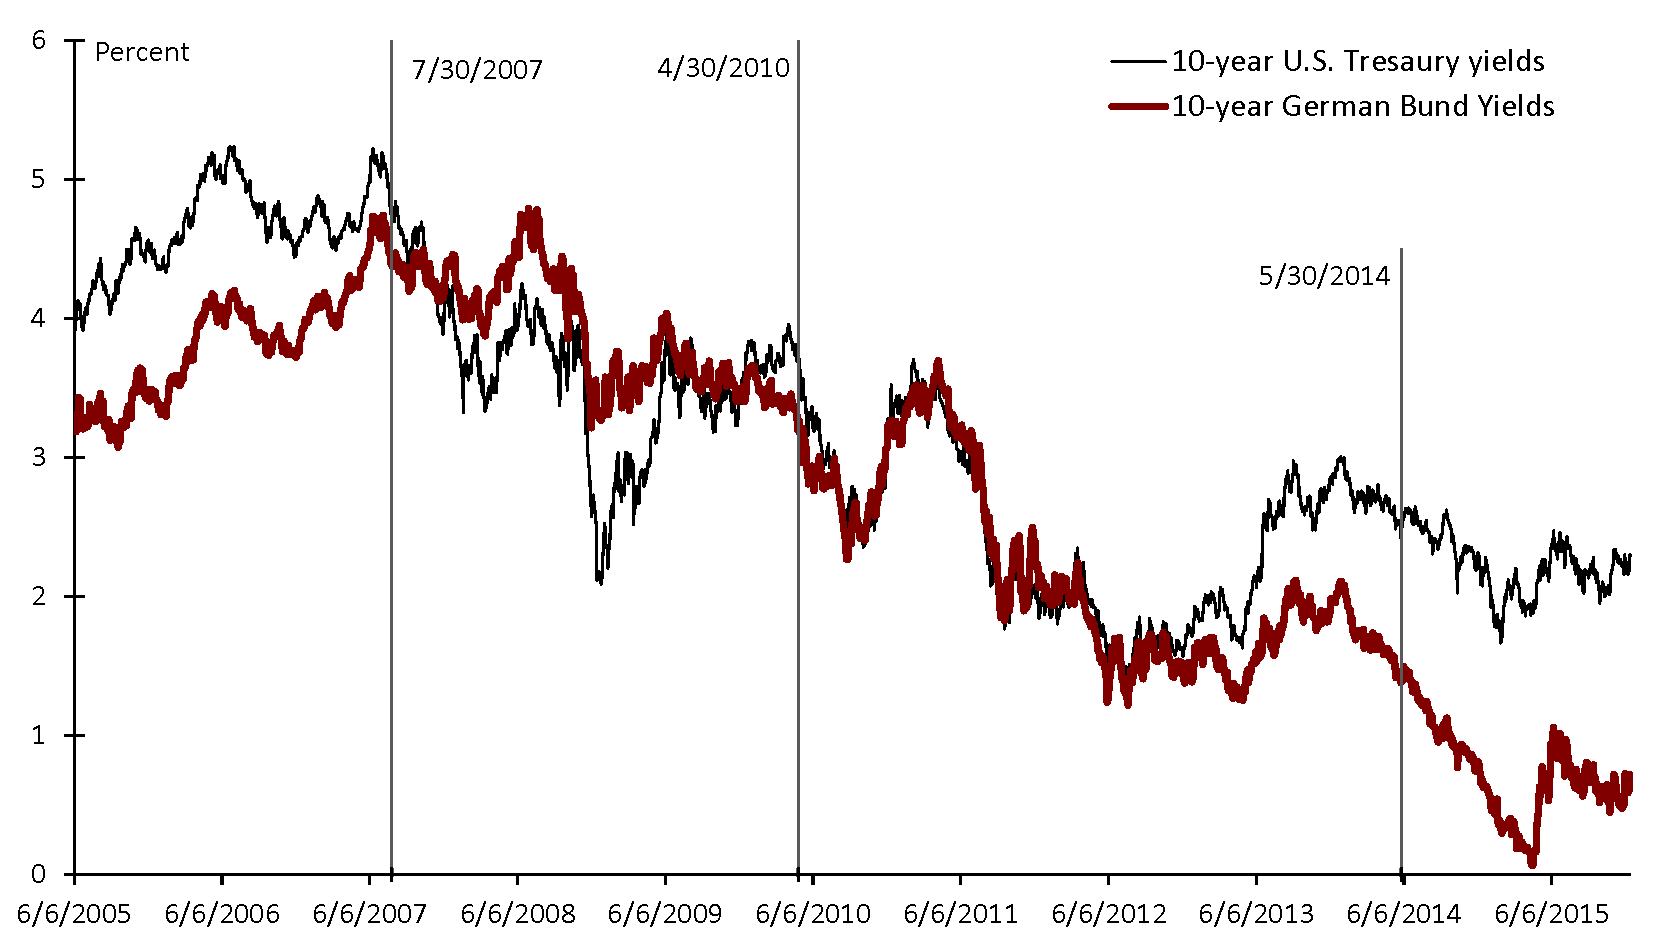
A partial resolution of these puzzles can be obtained by observing the behavior of the corresponding European data over the same period. The red lines in the figures show the yield on 10-year German nominal government bond (the Bund) and 10-year Euro area inflation compensation based on rates on inflation swaps contracts. Starting in the middle of 2007, U.S. and German bond yields, which had previously displayed only a modest correlation, began moving together quite closely. This comovement increased further over the period 2010 to 2012, when market participants--including those in U.S. Treasury markets--were focused on the Greek sovereign debt crisis and the possible implications for global growth, as well as on the fiscal and financial stability of other EU member states. U.S. and European inflation compensation were also broadly aligned during this time.
More recently, however, the behavior of U.S. and European longer-term yields has diverged somewhat. German yields declined by over 70 basis points between June 2014 and December 2015 while U.S. yields only fell about 16 basis points. Moreover, although the drop in nominal yields was far bigger in Europe, the decline in European inflation compensation over this period was less than half of the drop in the U.S. Consequently, it seems unlikely that European developments can fully explain why U.S. yields and inflation compensation continued to be so low even in the face of improved economic activity and anticipated policy tightening.
Empirical approach
To address these issues more systematically, we employ statistical time-series techniques to decompose daily changes in yields, inflation compensation, and other financial variables into different types of "shocks." The shocks are distinguished by the directions in which they move asset prices relative to one another. We assume that an unexpected increase in U.S. inflation expectations moves U.S. inflation compensation and U.S. Treasury yields higher while also causing a depreciation of the dollar. Similarly, we assume that a surprise increase in U.S. growth expectations will cause the U.S. stock market, U.S. Treasury yields, and the value of the dollar to shift up. Tighter-than-expected U.S. monetary policy is assumed to increase Treasury yields and the value of the dollar but reduce the U.S. stock market index and U.S. inflation compensation, and European policy shocks are identified in a similar fashion.4 These assumptions are intuitive and can be justified with simple theoretical models. Global growth and inflation shocks are viewed as common factors driving key U.S. and European variables in the same direction, but having a larger magnitude of impact on European variables than on U.S. variables. In other words, we are favoring global shocks originating from Europe or from countries to which Europe has a larger exposure than the U.S. does. Finally, we identify a "flight-to-safety" shock to control for the stylized fact that investors might seek safer assets in times of financial stress. This shock is defined as one that moves U.S. nominal Treasury yields and the U.S. stock market down but U.S. stock market volatility (as measured by the VIX index) up.
In summary, as shown in Table 1, each of the seven shocks under consideration is identified through a combination of restrictions that have to be satisfied simultaneously. It is important to realize that, although we only observe the aggregate moves in asset prices each day, we allow all seven of our shocks to occur on each day. Our statistical decomposition determines the magnitude and variation of each of those shocks over our sample period.5 Importantly, it allows us to compute how much of the daily movement in each of the financial variables can be attributed to each type of shock.
| US growth | US inflation | US policy | Global growth* | Global inflation* | EU policy | Flight-to-safety | |
|---|---|---|---|---|---|---|---|
| U.S. 10Y yield | + | + | + | + | + | - | |
| S&P 500 index | + | - | + | - | |||
| U.S. 10Y breakeven | + | - | + | ||||
| VIX | + | ||||||
| U.S. dollar vs. euro | + | - | + | - | |||
| German 10Y yield | + | + | + | ||||
| EuroStock600 index | + | - | |||||
| EU 10Y infl. swap | + | - |
* "Global" shocks also restrict the magnitude of the impact on a European variable to be larger than that on the corresponding U.S. variable. Return to text.
Results
We analyze changes in U.S. nominal Treasury yields and inflation compensation in three sub periods that are chosen to loosely correspond to the time-series patterns noted above. The first period starts at the end of July 2007 with the onset of the financial crisis and ends on April 30, 2010, before the emerging of the European debt crisis. Intuitively, we would expect this time period to be dominated by U.S. shocks associated with the financial crisis, although we also recognize that the financial crisis had international implications even at this stage. The second sub period starts on April 30, 2010 and ends on May 30, 2014, and is meant to capture the intensification of the European debt crisis. The last period, which runs from May 30, 2014 to December 16, 2015, is a period during which the U.S. and European business and monetary-policy cycles were diverging. For example, during this period the Fed concluded its third round of QE and signaled the approach of its policy rate increase, even as the ECB cut its deposit rate into negative territory and announced the beginning of a large QE program. This period is also marked by significant declines in oil prices, which, though not explicitly included in our model, will turn out to be an important part of our story.6
The columns in Table 2 report, for each sub period, the net changes in the 10-year U.S. Treasury yield and inflation compensation and the portion of those changes that are attributed to each shock.7 Starting with the first period, out of a total decline of 109 basis points in the 10-year yield, 37 basis points are explained by U.S. shocks, with domestic growth accounting for the largest portion. This result is consistent with the large negative shocks to the economy associated with the financial crisis. U.S. monetary policy accounts only for 11 basis points as, on balance, Fed communication and actions were slightly more accommodative than would have been expected given the shocks to growth and inflation. Interestingly, foreign shocks also account for a similar share of the yield changes during this period (36 basis points). Finally, the flight-to-safety shock also plays a significant role, accounting for about 20 basis points of the total decline. As for inflation compensation, in the first period, U.S. shocks account for a larger share, although the overall change is quite small.
For the second sub period, we find that the decline in the 10-year Treasury yield explained by U.S. shocks (-55 basis points) is a bit larger than that explained by foreign shocks (-49 basis points), which now account for a bigger fraction of the total change relative to the previous period. In the case of the U.S. shocks, a more-accommodative-than-expected monetary policy appears to have the largest effect. This is not surprising, considering the significant balance sheet policies and forward guidance changes announced in this period. Negative global inflation and growth shocks also contribute significantly to the downward movement in both U.S. yields and inflation compensation over this period. This is consistent with the notion that, during this period, U.S. markets were driven in large part by disappointing news from Europe.
Over the third sub period, we find that better-than-expected domestic growth and slightly tighter-than-expected domestic policy would have pushed the U.S. yield about 30 basis points higher. However, most of this positive effect is offset by negative domestic inflation shocks. Similarly, the largest contribution to the decline in inflation compensation also comes from negative U.S. inflation shocks. Relative to the two earlier periods, global shocks have a smaller effect on U.S. yields but still account for nearly a third of the total downward movement in inflation compensation. Furthermore, despite some notable monetary-policy developments in Europe during this period, European policy shocks contribute little to the movement in U.S. yields and inflation compensation, suggesting that European policy actions were largely in line with expectations. Finally, the flight-to-safety shock plays some role in explaining the movements of U.S. yields and inflation compensation over this period.
| 7/30/07-4/30/10 | 4/30/10-5/30/14 | 5/30/14-12/16/15 | ||||
|---|---|---|---|---|---|---|
| 10y TY | 10y IC | 10y TY | 10y IC | 10y TY | 10y IC | |
| Total change | -109 | 7 | -122 | -24 | -16 | -77 |
| U.S. growth | -24 | 4 | -2 | -2 | 22 | -4 |
| U.S. inflation | -11 | -4 | -14 | -5 | -29 | -30 |
| U.S. policy | -2 | 6 | -39 | -1 | 11 | -7 |
| Total | -37 | 6 | -55 | -8 | 4 | -40 |
| Global growth | -19 | -4 | -12 | -6 | -3 | -10 |
| Global inflation | -9 | -4 | -26 | -10 | -9 | -6 |
| EU policy | -7 | 6 | -11 | 0 | -2 | -5 |
| Total | -36 | -1 | -49 | -16 | -14 | -21 |
| Flight to safety | -20 | 0 | -4 | -0 | -5 | -9 |
The configuration of shocks in the last sub period could be consistent with oil price declines being an important driver of U.S. yields and inflation compensation during this period. Large downward movements in oil prices, like those that occurred since the second half of 2014, are potentially consistent with a variety of underlying forces, including a glut in oil production or weaker demand for this source of energy. All else being equal, however, oil-price declines tend to reduce U.S. firms' costs, allowing them to increase their output without increasing their prices. While our analysis does not directly examine the extent to which this has occurred, the pattern of positive movements in expected growth and negative movements in expected inflation that we find suggests such a dynamic. The net effect of an oil-price change on longer-term nominal yields is theoretically ambiguous and plausibly close to zero.8
Conclusions
In summary, we find that foreign developments explain a meaningful portion of the changes in U.S. nominal Treasury yields and inflation compensation between mid-2007 and late 2015. However, after mid-2014, shocks that pushed expected U.S. growth and inflation in opposite directions have been the most important driver of U.S. yields and inflation compensation movements, consistent with the large decline in energy prices that occurred around this time. These developments left little net imprint on nominal yields and weighed down inflation compensation, despite continued moderate U.S. growth and the anticipated beginning of the U.S. monetary-policy tightening cycle.
1. DAmico and King: Economic Research Department, Federal Reserve Bank of Chicago. Wei: Division of Monetary Affairs, Federal Reserve Board. We thank Uri Carl, Eric Horton, and Vicki Eastman for excellent research assistance and Jim Clouse, Mike Joyce, and Anna Paulson for helpful comments. This article is a reprint of D'Amico, King, and Wei, forthcoming, "Macroeconomic sources of recent interest rate fluctuations," Chicago Fed Letter. Return to text
2. All U.S. asset prices, including the dollar exchange rate, are recorded at noon New York time to be more in sync with European asset prices. Inflation compensation is computed as the difference between nominal Treasury yields and TIPS yields of the same maturity. Technically, in addition to expectations of inflation, it includes premiums for inflation risk and liquidity risk. We ignore those premiums for the purposes of this discussion, but it is important to keep in mind that some of the movements in our measure may be driven by changes in the perceived risks of inflation, rather than with expectations per se. Return to text
3. For example, in January 2015, the Blue Chip Financial Forecasts survey indicated that 95% of respondents believed that the first rate hike would occur by the September 2015 FOMC meeting. The Survey of Primary Dealers compiled by the Federal Reserve Bank of New York around the same time showed that the median dealer attached 85% probability to the first rate increase occurring by the end of 2015. Return to text
4. Note that, unlike other approaches, this identification does not assume that the short-term interest rate is the sole indicator of the stance of monetary policy. This is an important feature of our methodology since, following the financial crisis in 2008, the short rate remained essentially unchanged at zero and the Fed instead began relying on unconventional monetary policies such as forward guidance and large-scale asset purchases. The effect of those policies should, in principle, be captured by our approach. Return to text
5. Specifically, we use a structural vector autoregression (VAR) including the daily changes of the eight asset prices indicated above with structural shocks partially identified using sign restrictions. The methodology builds on Zeno Enders, Gernot J. Muller, and Almuth Scholl, 2011, "How do fiscal and technology shocks affect real exchange rates? New evidence for the United States," Journal of International Economics, Vol. 83, pp. 53-69; and Troy Matheson and Emil Stavrev, 2014, "News and monetary shocks at a high frequency: A simple approach," IMF Working Paper No. 14/167. We restrict all intercepts in the VAR to be zero, other than those in the stock-market equations, reflecting the notion that interest and exchange rates should not have deterministic drifts. Reported results are based on the means of the posterior distributions from 10,000 draws. Return to text
6. The price of West Texas intermediate crude started to decline on June 7, 2014, and one year later was over 40% lower. Return to text
7. Note that there is some residual variation that is not explained by any of our shocks, so the shock contributions do not sum to the total change in each period, and that the point estimates are subject to a considerable amount of sampling uncertainty. Return to text
8. For example, if the reduction in oil price reflects a price adjustment to overcapacity in oil production built up over the previous decade, as some market commentaries have argued, it would provide additional stimulus to the economy, potentially offsetting the downward pressure on inflation and pushing up nominal yields. Conversely, if the lower oil price resulted from investor pessimism about future global growth prospects and the associated demand for oil, nominal yields would fall, reflecting both lower expected inflation and lower real yields. Our finding of a near-zero effect on nominal yields would be consistent with supply forces being a more important factor behind the decline in oil price in the second half of 2014. Return to text
Please cite this note as:
D'Amico, Stefania, Thomas B. King, and Min Wei (2016). "Macroeconomic Sources of Recent Interest Rate Fluctuations," FEDS Notes. Washington: Board of Governors of the Federal Reserve System, June 2, 2016, http://dx.doi.org/10.17016/2380-7172.1777.
Disclaimer: FEDS Notes are articles in which Board economists offer their own views and present analysis on a range of topics in economics and finance. These articles are shorter and less technically oriented than FEDS Working Papers.
