
FEDS Notes
 Print
PrintAugust 17, 2016
Maternity Leave and the Gender Wage Gap: An Analysis of New Jersey Family Leave Insurance
Maria D. Tito 1
Women, on average, are paid less than men. According to the 2015 report prepared by the Institute for Women's Policy Research (IWPR), female full-time workers in the United States received only 81 cents for every dollar earned by men; this difference amounts to a gender wage gap of 19 percent.2 Women's progress in education, their advancement in the labor market, and the adoption of anti-discrimination laws contributed to narrowing the gap; progress towards gender equality, however, has been slowing in recent years.
The persistence of gender differences in wage profiles reflects, in part, the effect of motherhood on the careers of women. In the absence of adequate leave policies, new mothers tend to drop from the labor force to take care of their children. When children reach weaning age, some mothers return to the labor market; however, they are faced with substantial setbacks in their wage profiles, if compared with men of similar experience and education, in part, as their skills may have depreciated after a long period of unemployment.
This work belongs to the literature on gender inequality in the labor market, recently surveyed by Bertrand [2011]. In particular, it is related to the work emphasizing the effect of parenthood on gender differences.3 We adopt a quasi-experimental approach by looking into the recent reform to the Family and Medical Leave Act (FMLA). Since 1993, The FMLA guarantees eligible employees up to 12 weeks of unpaid leave in connection with the birth or adoption of a child.4 To be eligible, a person must work for an employer with 50 or more employees, have worked for the employer for at least 12 months, and have worked at least 1,250 hours during that 12-month period. California was the first state to enact a paid family leave program in 2004, expanding its Temporary Disability Insurance (TDI) program to include family leave benefits. In 2008 New Jersey adopted the Family Leave Insurance (FLI), also built on top of an existing TDI program, and started its implementation in 2009. In 2013 Rhode Island introduced the Temporary Caregiver Insurance, which became effective in 2014.5
Paid leave programs provide eligible workers with a portion of their wages for a set number of weeks.6 In California and New Jersey, workers receive up to six weeks of paid family leave and workers in Rhode Island receive up to four weeks. The state insurance programs also extend the coverage provided under the FMLA; workers, however, do not always receive job protection during periods of leave.7
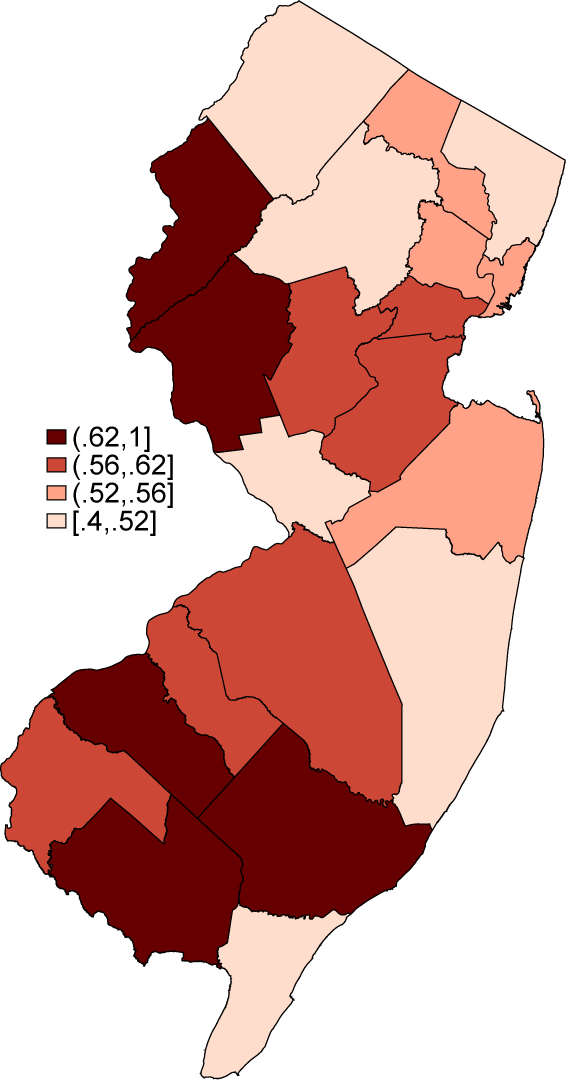
Paid family leave policies mitigate the gender wage gap by increasing the likelihood that women return to work after childbirth. Several studies document that the California Family Leave program increased women's attachment to the labor force.8 Our study focuses on New Jersey because we exploit a novel data source.9 In particular, the New Jersey Department of Labor (DoL) maintains a dataset of employers covered under the state's Unemployment Insurance (UI) legislation.10 The conditions for coverage under the UI legislation coincide with those related to the TDI and the FLI. In particular, the FLI applies to any business entity that employs one or more person(s) and pays that worker at least $1,000 in a calendar year. The DoL collects data on the name, the sector (6-digit NAICS code), the ownership status, and the address of each employer at the establishment level. We aggregate the data at the county-sector (4-digit NAICS) level and construct the share of firms covered by the FLI program relative to the establishment count reported in the County Business Patterns.11 Figure 1 shows that the distribution of FLI coverage is not uniform across counties. Workers in Cumberland County have the highest probability of receiving paid leave in the event of a birth or an adoption, while workers in Cape May County have the lowest chance of obtaining paid family benefits. We exploit the heterogeneity in coverage rates across counties and sectors to identify differential effects on the gender wage gap.
 |
|
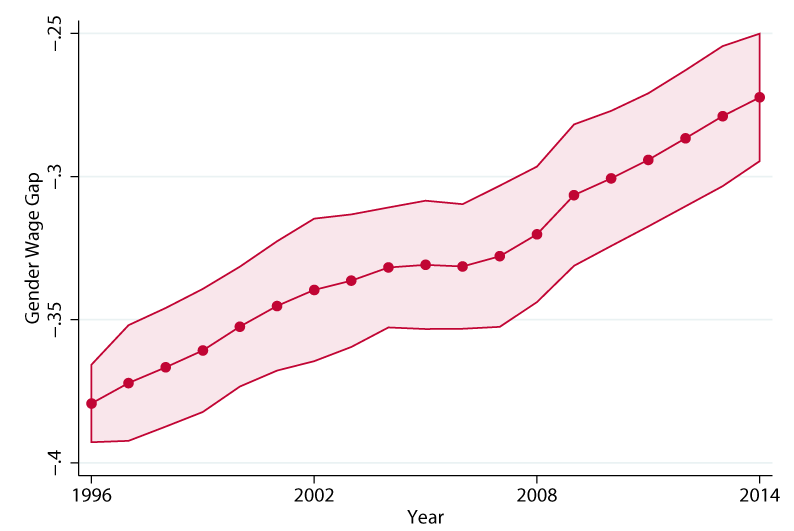
Note: Shaded areas represent 95% confidence intervals around the point estimates.
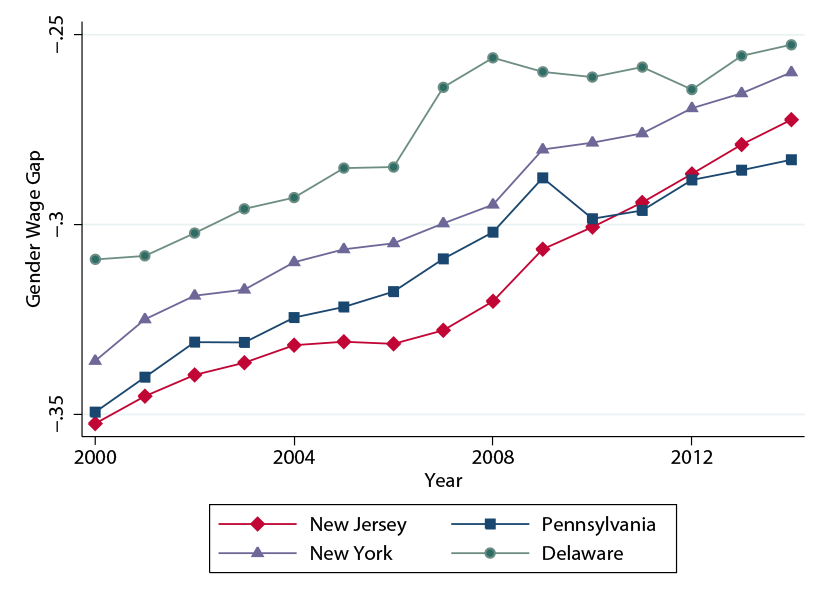
Before moving to further analysis, let's review the empirical evidence on the wage differences across genders for New Jersey. Figure 2 shows the evolution of the gender wage gap in New Jersey between 1996 and 2014.12 Each dot indicates the percentage difference in pay between men and women per dollar of compensation for example, a gender wage gap of -0.38 in 1996 implies that women were paid 38 cents less than men per dollar of pay in 1996. The gender differences in earnings in New Jersey have decreased over time: The trend toward equality accelerated after 2008, reaching a wage gap of 27 percent by the end of the period. The tightening of the wage gap is not unique to New Jersey. Neighboring states have also experienced a declining gap since the 2000s (figure 3). The change, however, occurred at a faster pace in New Jersey, which was lagging behind Delaware, New York, and Pennsylvania at the beginning of the period; by 2014, New Jersey caught up with Pennsylvania and reduced the gap with Delaware and New York.
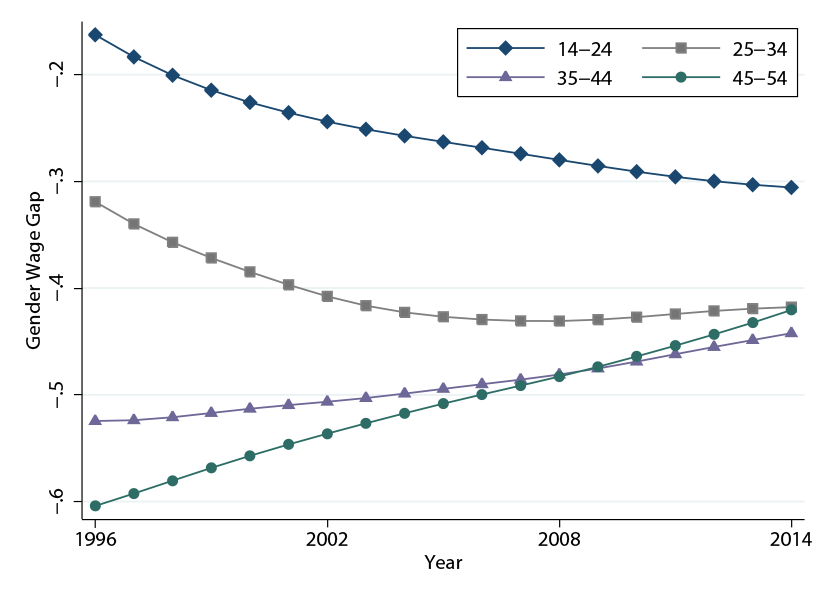
Figure 4 explores the wage gap dynamics by age group. Younger cohorts experience a deterioration in their wage gap over time while gender inequality in pay decreases across older cohorts. In the late 2000s, however, around the time of the adoption of the FLI, the decline in wages relative to men moderates for younger age groups, with a slowdown for women of 14 to 24 years of age in 1996 and even a reversing of the trend for women of 25 to 34 years of age in 1996. Older cohorts, instead, do not experience changes in their wage path around the same time.
The patterns observed in figures 2 and 4 point to the FLI as a possible explanation for the closing of the gender wage gap. Channels through which an effect may materialize include the availability of financial resources to access child-care services and the improvement in women's work-life balance, fostering deeper attachment to the labor force. We investigate the relationship between policy changes and gender differences in earnings using a model relating labor market outcomes to FLI shares:
where i denotes the gender group, s the sector (4-digit NAICS), c the county, and t the year. Our dependent variable, ln yisct, denotes the labor market outcome. Our main focus is on log-monthly wages; however, we also look at the impact on employment, as wage effects might materialize through a higher probability of returning to work after childbirth. Among the controls, Sexi is a dummy variable equal to 1 for women, Post2009 is a dummy equal to 1 after 2009, capturing the introduction of the Family Leave Program, and FLI Sharesct represents the share of firms covered by the family leave insurance at time t.13
β3 is our coefficient of interest; it identifies the difference in wages/employment between men and women due to the Family Insurance Program introduced after 2009. We control for the effect of sector- and county-specific shocks by introducing sector-time and county-time dummies in equation 1; cohort and county-industry dummies capture time-invariant characteristics specific to a particular demographic group or a particular sector within a county. We also augment our model with the entire set of interactions of our baseline variables, Sexi, Post2009, and FLI Sharesct.
| (1) | (2) | (3) | (4) | (5) | (6) | |
|---|---|---|---|---|---|---|
| Variables | ln Wage | ln Empl | ||||
| Sex | -0.446*** | -0.445*** | -0.443*** | -0.337*** | -0.319*** | -0.324*** |
| (0.012) | (0.011) | (0.012) | (0.035) | (0.032) | (0.035) | |
| Sex*FLI Share | 0.051*** | 0.050*** | 0.046** | 0.173*** | 0.131** | 0.142** |
| (0.018) | (0.016) | (0.017) | (0.08) | (0.048) | (0.05) | |
| Sex*Post2009 | -0.002 | -0.011 | -0.063** | -0.052** | ||
| (0.009) | (0.007) | (0.024) | (0.019) | |||
| Sex*Post2009*FLI Share | 0.001 | 0.017* | 0.144*** | 0.113*** | ||
| (0.013) | (0.009) | (0.037) | (0.029) | |||
| Const. | 8.272*** | 8.255*** | 8.167*** | 3.341*** | 3.430*** | 3.455*** |
| (0.008) | (0.006) | (0.034) | (0.014) | (0.014) | (0.08) | |
| County-Industry FE | y | y | y | y | y | y |
| Cohort FE | y | y | y | y | y | y |
| Industry-Year | n | n | y | n | n | y |
| County-Year | n | n | y | n | n | y |
| Obs. | 2,696,904 | 2,696,904 | 2,696,904 | 2,696,904 | 2,696,904 | 2,696,904 |
| R2 | 0.713 | 0.713 | 0.717 | 0.751 | 0.751 | 0.756 |
ln Wage: log monthly wages.
ln Empl: log employment counts.
Sex: dummy variable equal to 1 for females.
FLI Share: share of firms covered by the family leave insurance.
Post2009: dummy equal to 1 after 2009.
Legend: *** significant at 1%, ** at 5%, * at 10%.
Notes: County-industry level regressions, 1996-2014. Standard errors are clustered at the county level.
Table 1 shows the results for wages (columns (1)-(3)) and employment (columns (4)-(6)). As expected, women suffer a large wage discount compared with men in the same cohort, county, and sector. The wage gap, however, is lower in counties with larger shares of firms covered under the family leave legislation. In particular, increasing the FLI share by one standard deviation reduces the wage gap by 2 percent of a standard deviation (sd) -that is, an increase in the share of firms covered under the FLI by 1/3, an amount that corresponds to one standard deviation in the FLI share, contributes to explain 2 percent of the variability in the wage gap, after taking into account its standard deviation;14 after 2009, a one-standard deviation larger FLI share implies an additional reduction of the wage gap by 1 percent of a sd. The small gains in wages are supplemented by larger changes in employment. Within sectors and counties with greater FLI coverage, the gap in employment between men and women is reduced by 3.3 percent of a sd per standard-deviation change in the FLI share; after 2009, employment for women increases by 6 percent of a sd more than for men in sectors or counties with a one-standard deviation larger FLI coverage. We obtain similar results if we restrict our sample to the cohorts aged 14 to 44 (table 2).
| (1) | (2) | (3) | (4) | (5) | (6) | |
|---|---|---|---|---|---|---|
| Variables | ln Wage | ln Empl | ||||
| Sex | -0.423*** | -0.417*** | -0.415*** | -0.346*** | -0.327*** | -0.333*** |
| (0.012) | (0.011) | (0.012) | (0.034) | (0.032) | (0.034) | |
| Sex*FLI Share | 0.036* | 0.036** | 0.031* | 0.178*** | 0.133** | 0.145** |
| (0.018) | (0.017) | (0.017) | (0.049) | (0.05) | (0.051) | |
| Sex*Post2009 | -0.020* | -0.030*** | -0.072*** | -0.058*** | ||
| (0.01) | (0.007) | (0.024) | (0.019) | |||
| Sex*Post2009*FLI Share | 0.003 | 0.019* | 0.159*** | 0.126*** | ||
| (0.014) | (0.01) | (0.036) | (0.029) | |||
| Const. | 8.280*** | 8.266*** | 8.155*** | 3.290*** | 3.447*** | 3.290*** |
| (0.008) | (0.005) | (0.029) | (0.013) | (0.012) | (0.088) | |
| County-Industry FE | y | y | y | y | y | y |
| Cohort FE | y | y | y | y | y | y |
| Industry-Year | n | n | y | n | n | y |
| County-Year | n | n | y | n | n | y |
| Obs. | 2,286,359 | 2,286,359 | 2,286,359 | 2,286,359 | 2,286,359 | 2,286,359 |
| R2 | 0.747 | 0.747 | 0.751 | 0.76 | 0.76 | 0.765 |
ln Wage: log monthly wages.
ln Empl: log employment counts.
Sex: dummy variable equal to 1 for females.
FLI Share: share of firms covered by the family leave insurance.
Post2009: dummy equal to 1 after 2009.
Legend: *** significant at 1%, ** at 5%, * at 10%.
Notes: County-industry level regressions, 1996-2014. Standard errors are clustered at the county level.
Our results indicate that family leave legislation has a positive impact on wages and employment for women, closing the gap with men. Our data do not allow us to identify directly whether women who had access to the family leave program received the largest gains in terms of wages and employment; our identification relies on observed differences in FLI shares across sectors and counties. 15 The presence of the positive and significant effect of the FLI coverage before 2009 stems from the creation of the Family Insurance Program as an extension of the existing TDI program. However, significant effects are also present after 2009, when the family leave program was introduced.
Factors influencing the FLI coverage and labor market outcomes and varying by sectors, county, and time would bias our results. Firm reallocation would bias our results downward if the 2009 legislation induced a differential variation in the distribution of women-unfriendly firms across sectors and countries for example, with firms in counties close to the border more likely to move to neighboring states. This concern would imply that our estimates are a lower bound of the true effects. Looking at the number of firms in counties on the state border before and after 2009 relative to those on the coast, however, we do not detect any significant difference. Therefore, firm reallocation is unlikely to challenge our identification strategy. Our strategy, however, does not control for demographic characteristics.16 In future research we will work to directly identify the effect of motherhood and to isolate the contribution of other demographic factors for a better understanding of how family leave programs can reduce the gender pay gap.
References
Baum , C. L., & Ruhm, C. J. (2016). The Effects of Paid Leave in California on Labor Market Outcomes. Journal of Policy Analysis and Management.
Bertrand , M., Goldin, C., & Katz, L. F. (2010). Dynamics of the Gender Gap for Young Professionals in the Financial and Corporate Sectors. American economic Journal: Applied Economics, 2(3), 228-255.
Bertrand, M. (2011). New Perspectives on Gender. Handbook of Labor Economics, 4, 1543-1590.
Byker, T. (2014). The Role of Paid Parental Leave in Reducing Women's Career Interruptions: Evidence from Paid Leave Laws in California and New Jersey. Department of Economics, University of Michigan.
Curtis, E. M., Hirsch, B. T., & Schroeder, M. (2014). Evaluation Workplace Mandates with Flows versus Stocks: An Application to California Paid Family Leave. Andrew Young School of Policy Studies Research Paper Series.
Das, T., & Polachek, S. W. (2015). Unanticipated Effects of California's Paid Family Leave Program. Contemporary Economic Policy, 33(4), 619-635.
Espinola-Arredondo, A., & Mondal, S. (2010). The Effect of Parental Leave on Female Employment: Evidence from State Policies.
Gault, B., Hartmann, H., Hegewisch, A., Milli, J., & Reichlin, L. (2014). Paid Parental Leave in the United State: What the Data tell us about Access, Usage, and Economic and Health Benefits. Institute for Women's Policy Research.
Goldin, C. (2014). A Grand Gender Convergence: Its Last Chapter. The American Economic Review, 104(4), 1091-1119.
Hegewisch, A., & DuMonthier, A. (2016). The Gender Wage Gap: 2015; Earnings Differences by Race and Ethnicity. Institute for Women's Policy Research .
Kleven, H. J., Landais, C., & Sogaard, J. E. (2015). Children and Gender Inequality: Evidence from Denmark.
Paull, G. (2008). Children and Women's Hours of Work. The Economic Journal, 118(526), F8-F27.
Rossin-Slater, M., Ruhm, C. J., & Waldfogel, J. (2013). The Effect of California's Paid Family Leave Program on Mothers Leave-Taking and Subsequent Labor Market Outcomes. Journal of Policy Analysis and Management, 32(2), 224-245.
Waldfogel, J. (1998). Understanding the "Family Gap" in pay for Women with Children. The Journal of Economic Perspectives, 12(1), 137-156.
Wilde, E. T., Batchelder, L., & Ellwood, D. T. (2010). The Mommy Track Divides: The Impact of Childbearing on Wages of Women of Differing Skill Levels. National Bureau of Economic Research.
1. Federal Reserve Board. Contact: [email protected]. I would like to thank Kim Bayard, Norm Morin, and John Stevens for their excellent guidance. The views expressed in this paper are those of the author and do not necessarily coincide with those of the Board of Governors or the Federal Reserve System. Return to text
2. Hegewisch and DuMonthier [2016]. Return to text
3. Among others, see Waldfogel [1998], Paull [2008], Bertrand et al. [2010], Wilde et al. [2010], Goldin [2014], and Kleven et al. [2015]. Return to text
4. The FMLA allows covered employees also to take time off for a personal illness or to attend to the illness of a family member. Return to text
5. For a comprehensive overview of Paid Family Leave programs, see Gault et al. [2014]. Return to text
6. In California, workers receive 55 percent of their weekly earnings; in New Jersey, 66 percent; in Rhode Island, 60 percent. Return to text
7. California and New Jersey do not offer job protection, while Rhode Island does. Return to text
8. See, for example, Espinola-Arredondo and Mondal [2010]; Byker [2014]; and Das and Polachek [2015]. Curtis et al. [2014] evaluates the effect of the California paid family leave program on wage and worker mobility. Other studies focus on the use of leave (Rossin-Slater et al. [2013] and Baum and Ruhm [2016]). Return to text
9. Byker [2014]'s analysis also includes results for New Jersey. Return to text
10. The data are available at http://lwd.dol.state.nj.us/labor/lpa/fndemplr/emplist_index.html. Return to text
11. The DoL data are only available as a cross section for 2014 Return to text
12. Figures 2-4 are constructed using the Quarterly Workforce Indicators (QWI) data for New Jersey, available at http://ledextract.ces.census.gov/.Return to text
13. Variations in the firm count from the County Business Patterns allow us to exploit the time dimension in the TDI Sharesct. Return to text
14. The standard deviation for wages is 0.66. Return to text
15. We obtain similar effects on women's labor market outcomes if exploiting the variation in the share of firms with 50 or more employees across sectors and counties. These results stem from the positive correlation between the FLI share and the share of large firms. In future research, we will work on disentangling the labor market effects by gender of the FLI legislation from those of the FMLA and of firm characteristics. Return to text
16. QWI data only include information on the age group when looking within industry-county cells. Return to text
Please cite as:
Tito, Maria D. (2016). "Maternity Leave and the Gender Wage Gap: An Analysis of New Jersey Family Leave Insurance," FEDS Notes. Washington: Board of Governors of the Federal Reserve System, August 17, 2016, http://dx.doi.org/10.17016/2380-7172.1817.
Disclaimer: FEDS Notes are articles in which Board economists offer their own views and present analysis on a range of topics in economics and finance. These articles are shorter and less technically oriented than FEDS Working Papers.
