
FEDS Notes
 Print
PrintApril 8, 2016
Recession Risk and the Excess Bond Premium1
Giovanni Favara, Simon Gilchrist, Kurt F. Lewis, and Egon Zakrajek
Corporate bond spreads and the slope of the Treasury yield curve (that is, the term spread) are two financial indicators that are especially informative about the likelihood of an economic downturn over a medium-term horizon.2 One reason for this purely statistical result is that those yield spreads--like all financial asset prices--are forward-looking variables, and thus they contain important information about the real economy. For example, under the expectations hypothesis and neglecting term premiums, the term spread is a useful summary of the current stance of monetary policy (relative to long-run expectations), which, of course, has an important effect on macroeconomic outcomes. Credit spreads, on the other hand, may anticipate future economic activity because they incorporate investors' expectations of future corporate defaults, which affect the business sector's profits, employment, and investment.
A number of recent papers have emphasized that credit spreads, in particular, may help predict economic activity for reasons unrelated to default risk.3 In this FEDS Note, we evaluate the information content for recession risk of a component of credit spreads that is not directly attributable to expected default risk and thus to news about future cash flows. Specifically, we use a measure of investor sentiment or risk appetite in the corporate bond market--the so-called excess bond premium (EBP) introduced by Gilchrist and Zakrajek (2012)--to predict the likelihood of an NBER-dated recession occurring over the next 12 months.
In the first parts of the note, we document that over the past four decades, the predictive power of credit spreads for economic downturns is due entirely to the EBP. According to this measure, credit market sentiment has deteriorated noticeably since the summer of 2015. In fact, by the end of February of this year, the EBP-implied probability that the U.S. economy will enter a recession over the subsequent 12 months climbed to about 55 percent. Since then, however, recession risks have receded notably, consistent with an improvement in broad financial conditions. In the second part of the note, we discuss two economic mechanisms related to investor beliefs and the supply of credit that may explain the relationship between the EBP and the real economy.
The excess bond premium
In a recent paper, Gilchrist and Zakrajek (2012) (GZ hereafter) introduce a corporate bond credit spread with a high information content for economic activity that is built from the bottom up, using secondary market prices of senior unsecured bonds issued by a large representative sample of U.S. non-financial firms. To avoid duration mismatch issues, which can contaminate the information content of credit-risk indicators, yield spreads for each underlying corporate security are derived from a synthetic risk-free security that exactly mimics the cash flows of that bond. The GZ spread in month t is a simple un-weighted cross-sectional average of credit spreads in that month:
where $$N_t$$ denotes the number of bonds in month t and $$S_{i,t}[k]$$ is the spread of bond k (a security that is a liability of firm i) in month t.
The EBP is extracted from the GZ spread by first using a linear regression to remove expected default risk of individual firms from the underlying credit spreads. Specifically, the log of the credit spread on bond k is assumed to be linearly related to a firm-specific indicator of default $${DFT}_{i,t}$$ and a vector of bond-specific characteristics $$Z_{i,t}\left[k\right]$$, according to:
where $$\varepsilon_{i,t}[k]$$ is a (log) credit spread pricing error.4 Assuming normally distributed pricing errors, the predicted level of the spread for bond k of firm i at time t--the part attributable to expected default risk--is then given by:
where $$(\widehat{\beta,}{\hat{\gamma}}')$$ denotes the vector of estimated parameters and $${\hat{\sigma}}^2$$ is the estimate of the conditional variance of pricing errors. The part of the GZ spread that is directly attributable to expected default risk is given by the average of predicted spreads in month t:
while the EBP is the component of the GZ spread net of expected defaults:
The above procedure thus decomposes the GZ credit spread into two parts: (1) $${\hat{S}}^{GZ}_t$$, a component that captures default risk of individual firms; and (2) $${EBP}_t$$, a residual component that can be thought of as capturing investor attitudes toward corporate credit risk--that is, credit market sentiment. In effect, the EBP tries to capture the variation in the average price of bearing U.S. corporate credit risk--above and beyond the compensation that investors in the corporate bond market require for expected defaults. As documented by GZ, the EBP is significantly more informative--in both economic and statistical terms--about future economic activity than a component of the GZ credit spread that can be directly attributed to expected defaults.
Panels (a) and (b) Figure 1 show these two credit risk indicators since January 1973, the first available data point. Note that both the GZ credit spread and the EBP have increased significantly prior to or during most of the cyclical downturns since the early 1970s. Note also that between the summer of 2015 and February of this year, the EBP climbed to levels seen in the early summer of 2008, just a few months before the nadir of the financial crisis. However, this pronounced deterioration in credit market sentiment abated appreciably in March, a move consistent with the improvement in broad financial conditions.
| Figure 1: Credit Risk Indicators |
|---|
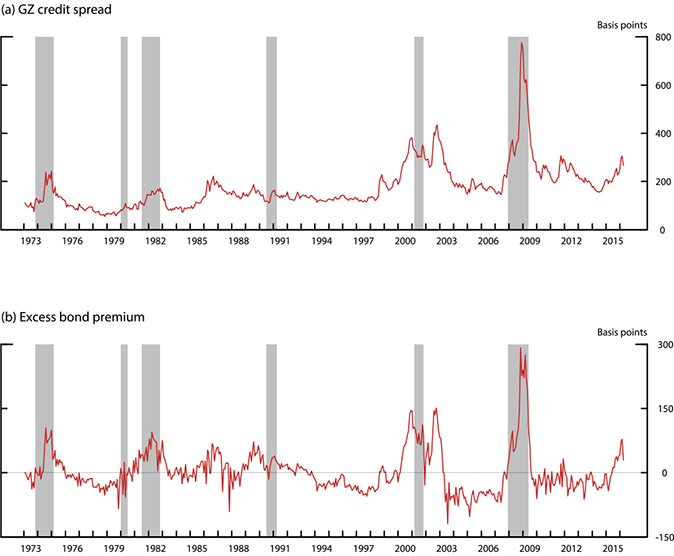 |
Note: Sample period: monthly data from January 1973 to March 2016. The shaded vertical bars represent the NBER-dated recession.
Sources: Authors' calculations based on: Center for Research in Security Prices (CRSP); CRSP/Compustat Merged Database, Wharton Research Data Services (WRDS), wrds-web.wharton.upenn.edu/wrds/about/databaselist.cfm  ; and Bank of America Merrill Lynch Bond Indices, used with permission.
Predicting NBER-dated recessions
Following a large literature on estimating recession risks, we use simple probit regressions to estimate the probability that the U.S. economy will enter a recession sometime during the next 12 months. As in Gilchrist and Zakrajek (2012), we focus on the GZ spread, the slope of the Treasury yield curve, and the real federal funds rate--two commonly used indicators of the stance of monetary policy--as our explanatory variables.5 Our baseline probit regression is given by
where $$NBER_{t,t+12}$$ is a 0/1-indicator variable that equals 1 if and only if there is an NBER-dated recession at some point during months t and t+12 (inclusive), $$S_t^{GZ}$$ is the GZ credit spread, $$TS_t$$ is the term spread, $$RFF_t$$ is the real funds rate, and Φ(⋅) denotes the standard normal cumulative distribution function.6 Intuitively, the above specification looks at the behavior of these financial indicators at times of past NBER-dated recessions and estimates the probability that they are signaling the occurrence of an economic downturn over the next year.
The first column in Table 1 reports the marginal effects of these three financial indicators on the probability of a recession over the 12-month horizon. Note that all three marginal effects have their expected signs: a widening of credit spreads increases the likelihood of an economic downturn over the coming year, as does the flattening of the yield curve--a decline in the term spread--and an increase in the real federal funds rate. In economic terms, an increase in the GZ spread of 50 basis points in month t is estimated to increase the probability of a recession over subsequent 12 month by about 7 percentage points. A decline in the term spread of the same magnitude increases this likelihood by almost 4 percentage point, while a 50 basis point increase in the real funds rate is associated with an increase in the probability of a recession over subsequent 12 month of almost 2.5 percentage points.
| Table 1: Financial Indicators as Predictors of Recession Risk |
|---|
| Explanatory Variables | (1) | (2) | (3) |
|---|---|---|---|
| GZ credit spread $$(S_t^{GZ})$$ | 0.140*** | . | . |
| (0.037) | |||
| Term spread $$(TS_t)$$ | -0.079** | -0.092*** | . |
| (0.034) | (0.029) | ||
| Real federal funds rate $$(RFF_t)$$ | 0.047** | 0.017 | |
| (0.021) | (0.016) | ||
| Predicted GZ credit spread $$(\hat{S}_t^{GZ})$$ | . | -0.018 | . |
| (0.057) | |||
| Excess bond premium $$(EBP_t)$$ | . | 0.300*** | 0.327*** |
| (0.055) | (0.075) | ||
| Pseudo R2 | 0.426 | 0.527 | 0.288 |
Note: Sample period: monthly data from January 1973 to March 2016 (T = 519). The dependent variable in each specification is a 0/1-indicator variable that equals 1 if and only if there is an NBER-dated recession at some point between month t and month t+12. The entries in the table denote the marginal effect of the specified explanatory variable on the probability of recession over the 12-month horizon based on the coefficients from the probit regression. All specifications include a constant (not reported). The Newey-West standard errors are reported in parentheses; * $$p<.10$$; ** $$p< .05$$; and *** $$p< .01$$. The pseudo R2 is computed according to McKelvey and Zavoina (1975).
In column 2, we zoom in on the information content of the GZ credit spread by allowing its two components to enter into the regression separately. That is, we estimate
These estimates indicate that the predictive content of the GZ spread is due entirely to the EBP--the marginal effect of the default-risk component of the GZ spread is statistically and economically indistinguishable from zero. By contrast, a 50 basis point increase in the EBP in month t is estimated to boost the likelihood of an economic downturn over the subsequent 12 months by 15 percentage points.
Column 3 reports the estimation results from a probit regression with the EBP as a sole explanatory variable. The marginal effect of the EBP stays essentially the same--in both economic and statistical terms--and according to the pseudo R2, the specification involving only the EBP has an in-sample goodness-of-fit that is more than one-half of that implied by the model that conditions on all financial indicators (column 2).
To isolate the role of credit market sentiment in U.S. business cycle fluctuations, Figure 2 plots the in-sample fitted probability of a recession over the subsequent 12 months, based on the specification reported in column 3. As shown by the solid line, this probability has moved up significantly since the summer of last year, when concerns about global growth prospects, centered on China, sparked a widespread re-pricing of risky assets, an increase in financial market volatility, and a deterioration in investor sentiment in the United States and abroad; in fact, at the end of February, our simple model implied about a 55 percent chance that the U.S. economy will be in recession at some point between March 2016 and February 2017.7 The same concerns that triggered the worsening of investor sentiment apparently abated in March, and the corresponding EBP-implied odds of the economy falling into a recession over the subsequent 12 months moved down significantly.
| Figure 2: Recession Risk and the Excess Bond Premium |
|---|
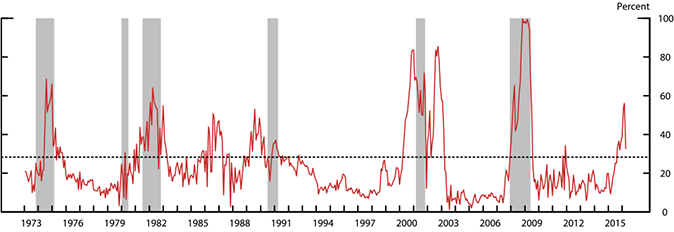 |
Note: Sample period: monthly data from January 1973 to March 2016. The solid line depicts the in-sample probability of an NBER-dated recession occurring at any point over the subsequent 12 months, implied by the probit specification in column 4 of Table 1; the dotted black line denotes the unconditional probability of entering into a recession at any point over the subsequent 12 months. Shaded vertical bars represent the actual NBER-dated recessions.
Sources: Authors' calculations (see the text and notes to Figure 1 for details).
Although this simple model fits the data quite well, it nevertheless produces some--albeit only a few--false negative inferences (failing to predict recessions that did occur) and false positive predictions (predicting recessions that did not happen) over the past four decades. The most notable false positive prediction in our sample occurred in 2002, when credit spreads and the EBP increased sharply in response to a slew of corporate accounting scandals that led to the bankruptcy of several large firms, but the economy did not slip into a recession.
Interpretation
The results reported above indicate that the EBP provides a timely and useful leading indicator of economic downturns. In the remainder of the note, we briefly discuss the economic mechanisms through which fluctuations in credit market sentiment may affect the real economy. There are at least two potential mechanisms, which are not necessarily mutually exclusive.
One possible mechanism linking investor sentiment and the real economy is related to the way investors update their beliefs in light of incoming data. In particular, investors may over-react to the most recent news and thus assign excessive weight to future outcomes that have become more likely in view of recent data. For example, after a few years of economic expansion, investors may become complacent about default risk, an attitude leading to a compression in credit spreads, a loosening of other credit terms and standards, and a surge of issuance of credit to very risky borrowers. In such an environment, the sudden arrival of a string of unfavorable economic news may lead investors to revise disproportionally their assessment of recession risk, thus amplifying the widening in credit spreads. This reasoning implies that investor psychology can itself be a cause of volatility in credit and investment, even in the absence of significant changes in economic fundamentals.8
Another possible mechanism linking fluctuations in credit market sentiment to economic outcomes is related to changes in the supply of credit. Large unlevered institutions such as mutual funds, insurance companies, and pension funds have become in recent years the main investors in the corporate bond market. These institutions effectively act as a marginal investor in a wide range of financial markets.9 To the extent that real and financial disturbances affect their willingness or ability to fund the provision of new credit, the resulting tighter financial conditions may exert a significant drag on future economic growth, dynamics consistent with the standard financial accelerator mechanisms emphasized by Bernanke and Gertler (1989), Kiyotaki and Moore (1997), and Bernanke, Gertler and Gilchrist (1999).10
References
Adrian, Tobias, Erkko Etula, and Tyler Muir. 2014. "Financial Intermediaries and the Cross-Section of Asset Returns." Journal of Finance 69 (6): 2557-2596.
Ang, Andrew, Monika Piazzesi, and Min Wei. 2006. "What Does the Yield Curve Tell Us About GDP Growth?" Journal of Econometrics 131 (1): 359-403.
Barberis, Nicholas, Andrei Shleifer, and Robert Vishny. 1998. "A Model of Investor Sentiment." Journal of Financial Economics 49: 307-343.
Bernanke, Ben, and Mark Gertler. 1989. "Agency Costs, Net Worth, and Business Fluctuations." American Economic Review 79 (1): 14-31.
Bernanke, Ben, Mark Gertler, and Simon Gilchrist. 1999. "The Financial Accelerator in a Quantitative Business Cycle Framework." In Handbook of Macroeconomics, eds. Michael Woodford and John Taylor, 1341-1393.
Bleaney, Michael, Paul Mizen, and Veronica Veleanu. Forthcoming. "Bond Spreads and Economic Activity in Eight European Economies." Economic Journal.
Bordalo, Pedro, Nicola Gennaioli, and Andrei Shleifer. 2015. "Diagnostic Expectations and Credit Cycles (PDF)." Working Paper.
Estrella, Arturo, and Frederic S. Mishkin. 1998. "Predicting U.S. Recessions: Financial Variables As Leading Indicators." Review of Economics and Statistics 80 (1): 45-61.
Estrella, Arturo, and Gikas A. Hardouvelis. 1991. "The Term Structure as a Predictor of Real Economic Activity." Journal of Finance 46 (2): 555576.
Faust, Jon, Simon Gilchrist, Jonathan H. Wright, and and Egon Zakrajek. 2013. "Credit Spreads as Predictors of Real-Time Economic Activity: A Bayesian Model-Averaging Approach." Review of Economics and Statistics 95 (5): 15011519.
Gertler, Mark, and Cara S. Lown. 1999. "The Information in the High-Yield Bond Spread for the Business Cycle: Evidence and Some Implications." Oxford Review of Economic Policy 15 (3): 132-150.
Gilchrist, Simon, and Benoît Mojon. Forthcoming. "Credit Risk in the Euro Area." Economic Journal.
Gilchrist, Simon, and Egon Zakrajek. 2012. "Credit Spreads and Business Cycle Fluctuations." American Economic Review 102 (4): 1692-1720.
Gilchrist, Simon, Vladimir Yankov, and Egon Zakrajek. 2009. "Credit Market Shocks and Economic Fluctuations: Evidence From Corporate Bond and Stock Markets." Journal of Monetary Economics 56 (4): 471493.
Gourieroux, C., A. Monfront, and A Trognon. 1984. "Estimation and Test in Probit Models with Serial Correlation." In Alternative Approaches to Time Series Analysis. Facultes Universitaires Saint-Louis.
Greenwood, Robin, and Samuel G. Hanson. 2013. "Issuer Quality and Corporate Bond Returns." Review of Financial Studies 26 (6): 14831525.
He, Zhiguo, and Arvind Krishnamurthy. 2013. "Intermediary Asset Pricing." American Economic Review 103 (2): 732770.
Kiyotaki, Nobuhiro, and John Moore. 1997. "Credit Cycles." Journal of Political Economy 105 (2): 211-248.
Krishnamurthy, Arvind, and Tyler Muir. 2015. "Credit Spreads and the Severity of Financial Crises (PDF)." Working Paper..
López-Salido, David, Jeremy C. Stein, and Egon Zakrajek. 2016. "Credit-Market Sentiment and the Business Cycle." NBER Working Paper 21879.
Poirier, Dale J., and Paul A. Ruud. 1988. "Probit with Dependent Observations." Review of Economic Studies 55 (4): 593-614.
Rabin, Matthew, and Dimitri Vayanos. 2010. "The Gambler's and Hot-Hand Fallacies: Theory and Applications." Review of Economic Studies 77 (2): 730-778.
Stock, James H., and Mark W. Watson. 2003. "Forecasting Output and Inflation: The Role of Asset Prices." Journal of Economic Literature 41 (3): 788829.
Wright, Jonathan H. 2006. "The Yield Curve and Predicting Recessions (PDF)." Finance and Economics Discussion Series No. 2006-07, Federal Reserve Board, Washingon DC.
1. Favara, Lewis, and Zakrajek: Division of Monetary Affairs, Federal Reserve Board. Gilchrist: Department of Economics Boston University and NBER. Return to text
2. Indeed, considerable empirical evidence suggests that these yield spreads may be the clearest aggregators of information on incipient recessions. See Estrella and Hardouvelis (1991); Estrella and Mishkin (1996, 1998); Stock and Watson (2003); Ang, Piazzesi, and Wei (2006); and Wright (2006) for evidence on the term spread. The predictive content of corporate bond spreads for U.S. real economic activity is documented by Gertler and Lown (1999); Gilchrist, Yankov, and Zakrajek (2009); Gilchrist and Zakrajek (2012); and Faust, Gilchrist, Wright and Zakrajek (2013); and for the euro area by Gilchrist and Mojon (2014) and Bleaney, Mizen, and Veleanu (2016). Return to text
3. Gilchrist and Zakrajek (2012); Greenwood and Hanson (2013); Krishnamurthy and Muir (2015); and Lopez-Salido, Stein, and Zakrajek (2016). Return to text
4. Gilchrist and Zakrajek (2012) use the "distance-to-default," a default-risk indicator based on the firm's equity valuations and leverage to capture the likelihood of default over the near-term horizon; in addition to this market-based assessment of default risk, their credit spread pricing regression also includes bond-specific credit ratings, which capture the "through-the-cycle" information about the firm's creditworthiness. These credit risk factors account for about 70 percent of the variation in bond-level credit spreads over the sample period. In addition, their empirical methodology controls for the call-option effect that is embedded in most corporate bonds. Return to text
5. The term spread is defined as the difference between the yield on the 10-year Treasury note and the 3-month Treasury bill rate. The real federal funds rate in month t is defined as the average effective federal funds rate in month t less realized inflation, where realized inflation is given by the log-difference between the core PCE price index in month t-1 and its lagged value a year earlier. Return to text
6. To take into account the serial correlation of the error term induced by the overlapping nature of these forecasts, our statistical inference is based on the standard Newey-West estimator of the asymptotic covariance matrix of the model parameters. As shown by Gourieroux, Montfort, and Trongnon (1984) and Poirier and Ruud (1988), the resulting pseudo-maximum-likelihood estimates of the model parameters are consistent under quite general (weak) forms of serial correlation, though they are inconsistent if the error term exhibits conditional heteroskedasticity. It is worth noting that we obtain qualitatively and quantitatively very similar results using a linear probability model. Return to text
7. As a benchmark, the unconditional probability of entering into a recession at any point over the subsequent 12 months, the dashed line in Figure 2, is about 30 percent over our sample period. Return to text
8. Barberis, Shleifer, and Vishny (1998), Rabin and Vayanos (2010), and Bordalo, Gennaioli, and Shleifer (2015) discuss psychological models of investor confidence, in which overly-extrapolative expectations may lead to credit and business cycles, even without changes in economic fundamentals. Return to text
9. He and Krishnamurthy (2013) and Adrian, Etula, and Muir (2014) argue that the wealth of financial intermediaries is an important factor for pricing various types of credit risk. Return to text
10. Lopez-Salido, Stein and Zakrajek (2016) document the effects of credit market sentiment on economic growth vis-à-vis changes in the supply of credit. Return to text
Please cite this note as:
Favara, Giovanni, Simon Gilchrist, Kurt F. Lewis, and Egon Zakrajsek (2016). "Recession Risk and the Excess Bond Premium," FEDS Notes. Washington: Board of Governors of the Federal Reserve System, April 8, 2016, http://dx.doi.org/10.17016/2380-7172.1739.
Disclaimer: FEDS Notes are articles in which Board economists offer their own views and present analysis on a range of topics in economics and finance. These articles are shorter and less technically oriented than FEDS Working Papers.