
FEDS Notes
 Print
PrintFebruary 22, 2016
What Happened in Money Markets after the Fed's December Rate Increase?
Alyssa Anderson, Jane Ihrig, Ellen Meade, and Gretchen Weinbach *
At its December 2015 meeting, the Fed's policymaking committee, the Federal Open Market Committee (FOMC), announced an increase in the target range for the federal funds rate of 25 basis points, the first increase in the policy rate since June 2006. In a previous FEDS Note, we described the steps the Fed took to implement the FOMC's decision and why it needed to use a new implementation framework. Here, we continue the discussion by examining the effects of the December rate increase on money markets. In particular, we review how the Fed's policy decision has affected interest rates and trading volumes in unsecured and secured money markets, and the extent to which money market participants have used the Fed's overnight reverse repurchase agreement (ON RRP) facility.
Quick review of the Fed's new approach to implementing monetary policy1
Recall that the new implementation framework the Fed is using relies on two policy tools, each of which helps to support market interest rates.2 The Fed's primary policy tool is the rate of interest on banks' excess reserve balances (the IOER rate); banks have little incentive to lend funds below the IOER rate. The Fed's overnight reverse repurchase agreement (ON RRP) facility is used as a supplementary policy tool; this facility is available to a broader set of money market participants, and these counterparties have little incentive to lend funds below the ON RRP offering rate.3 In conjunction with the FOMC's December 2015 policy statement, the Fed released an implementation note that specified the decisions the Federal Reserve had taken regarding the settings of the Fed's policy tools. In particular, the IOER rate was set to 50 basis points (the top of the target range for the federal funds rate) and the ON RRP offering rate was set to 25 basis points (the bottom of the target range); in addition, the aggregate capacity of the facility was set to a temporarily-elevated level of about $2 trillion, and the maximum bid amount was kept at $30 billion per counterparty.
What happened in overnight money markets after the FOMC decision?
The FOMC's increase in the target range for the federal funds rate was effective on December 17, 2015. That day, a number of overnight interest rates in both unsecured and secured markets moved up smoothly into the new federal funds rate target range of 25 to 50 basis points, with little volatility and no meaningful change in trading volumes. "Unsecured" transactions in money markets are those in which the borrower does not offer collateral to the lender as part of the transaction; such trading occurs in the federal funds and Eurodollar markets. "Secured" transactions in money markets are collateralized, such as in the market for repurchase agreements or "repos."4 While the federal funds market is largely limited to banks and a small set of other financial institutions,5 the Eurodollar and repo markets involve a wide range of financial market participants. Figure 1 shows that, excluding days around the end of the calendar year (discussed below), each of these overnight interest rates moved up in step with the increase in the FOMC's target range for the federal funds rate (the shaded area).6 Figure 2 illustrates that the policy rate increase had little effect on trading volumes in these markets as the amount of daily trading activity remained similar to what it had been before the FOMC's decision.
| Figure 1: Overnight Money Market Rates |
|---|
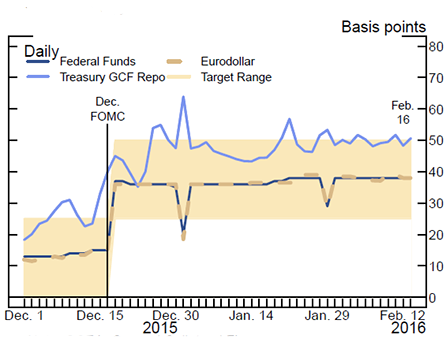 |
Note: GCF is General Collateral Finance.
Source: For Treasury GCF Repo, Depository Trust & Clearing Corporation (DTCC); for Federal Funds, Federal Reserve Bank of New York; for Eurodollar, Bloomberg.
| Figure 2: Overnight Money Market Volumes |
|---|
 |
Note: GCF is General Collateral Finance.
Source: For Treasury GCF Repo, Depository Trust & Clearing Corporation (DTCC); for Federal Funds and Eurodollar, Federal Reserve (FR 2420).
Figure 2 was revised on March 1 to reflect updated Eurodollar data.
Considering the individual transactions that underlie the aggregate data we've just described allows us to take a deeper dive into activity in these money markets. Figure 3 highlights that the Fed's rate increase had little effect on the dispersion of individual rates at which federal funds were traded, suggesting there has been little change in the relative behavior of individual market participants.7 Specifically, the red line shows a stylized cumulative distribution function of federal funds trades that occurred during the two weeks prior to the Fed's rate decision (between December 3 and December 16, 2015), while the blue line shows the same representation of trades that occurred in the two weeks after the rate increase (between December 17, 2015 and January 4, 2016). The vertical portion of the red curve shows that prior to the FOMC action, most federal funds trading was taking place at rates of about 11 to 15 basis points. With the Fed's rate increase, this curve shifted to the right in a parallel way, with the vertical portion of the blue curve indicating that most federal funds trading after the rate increase took place was at rates of about 32 to 37 basis points, roughly in the middle of the FOMC's new target range. One can see similar shifts in the distributions of the rates at which trading occurred in other overnight money markets.
| Figure 3: Distribution of Federal Funds Trades |
|---|
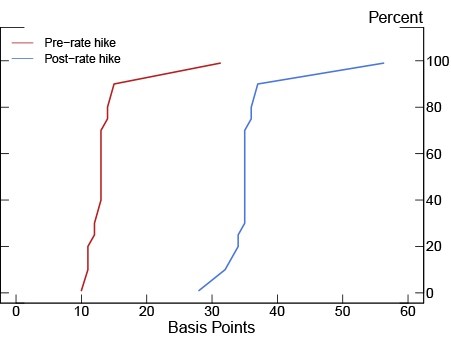 |
Note: Includes 1st, 10th, 20th, 25th, 30th, 40th, 50th, 60th, 70th, 75th, 80th, 90th, and 99th percentiles. Pre-rate hike is from 2015-12-03 to 2015-12-16. Post-rate hike is from 2015-12-17 to 2016-01-04 excluding year-end.
Source: Federal Reserve (FR 2420).
What happened in term money markets after the FOMC decision?
Interest rates in term money markets, including commercial paper and large certificates of deposit offered by banks, also increased around the time of the Fed's rate change in December. As shown in Figure 4, these interest rates generally moved up as December 17 approached because market participants viewed the decision to increase the federal funds rate target range as quite likely to occur. As is typically the case in such situations, term interest rates increase in anticipation of the Fed's rate decision because they embed higher overnight interest rates that are expected to prevail in the future.
| Figure 4: Term Money Market Rates |
|---|
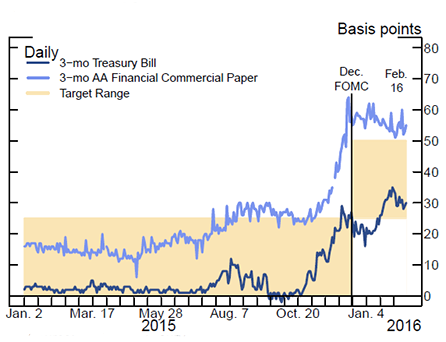 |
Note: Source: For U.S. Treasury Bill, Treasury; For AA Financial Commercial Paper, Federal Reserve Board.
Treasury bill yields also moved higher around December 17, but they remained below other money market interest rates. Yields on Treasury bills have often been below the federal funds rate for extended periods, particularly during periods when the safety and liquidity of Treasury securities is in high demand. At present, relatively low bill yields appear to represent a relatively high demand for safe, liquid assets by a variety of investor types. Overall, the relationship between bill yields and other money market interest rates has been fairly stable since December 17 and appears similar to the pattern that prevailed prior to the FOMC's decision to raise the target range for the federal funds rate.
Take-up at the Fed's ON RRP facility
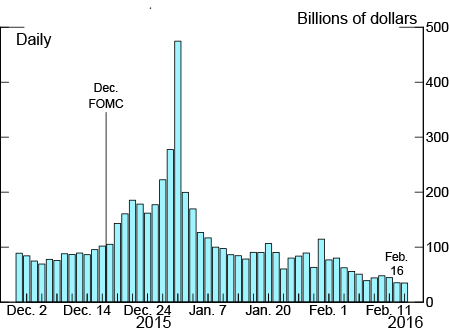
Since December 17, usage or "take-up" of the Fed's daily ON RRP operations has remained in line with the general patterns that had been evident prior to that time, both in the aggregate and at the counterparty level. Figure 5 depicts the total daily take-up for a period both before and after the rate increase. Before the FOMC decisionshown by the bars to the left of the vertical linetotal take-up averaged about $85 billion per day. On December 17, total usage was $105 billion, little changed from the previous day's level.8 With the exception of activity around the end of the calendar year (discussed separately below), total take-up in 2016 has averaged about $75 billion per day, reflecting in part the fact that market repo rates have generally been more attractive to investorsthat is, higher than the Fed's 25-basis-point offering rate on its ON RRP operations over this period (see Figure 1). Thus, demand for ON RRPs appears to have remained sensitive to interest rates. In addition, the share of take-up by type of counterparty has remained consistent with its prior pattern, with MMFs continuing to account for most of the demand for the Fed's ON RRPs.
Why did money markets behave differently at year-end?
The way in which the calendar has affected money market dynamics and the take-up of ON RRPs appears to be similar before and after the FOMC's December decision. In general, money market dynamics on quarter-ends, and, to a lesser extent, month-ends, are quite different than on other trading days, but the differences are predictable and short-lived. The differences in market activity stem from the fact that balance sheet information for these particular calendar days is important for regulatory reporting. Referring back to Figures 1 and 2, in unsecured markets, both interest rates and trading volumes tend to decline around quarter-ends because cash investment opportunities diminish somewhat as foreign banking organizations in particular reduce the size of their balance sheets.9 In secured markets, trading volumes also drop as some large securities dealers similarly pull back in their market-making activities. However, this effect typically leads to minimal softening of interest rates in the repo market. All told, with opportunities to invest cash in private markets temporarily reduced, take-up at the Fed's ON RRP facility temporarily increases. For example, at year-end in December, ON RRP take-up rose to $475 billion, the highest level to date, but was generally in line with total RRP take-up at previous quarter-ends. In the days after the year-end effects passed, ON RRP take-up contracted and reverted back to its mid-December level.10
In light of these typical flows, conditions in money markets at year-end were largely in line with previous quarter-ends and year-ends. The effective federal funds rate printed at 20 basis points, a bit below the target range, and trading volume declined. This softness was interpreted by market participants as reflecting the transitory reduction in the supply of overnight investments in private markets.11 In line with this interpretation, interest rates and trading volumes in overnight unsecured and secured money markets were back to their previous levels within a few trading days, as usual.
Wrap-up
Taken together, the data that we have reviewed here regarding the behavior of money markets around the time of the December rate increase indicate that the Fed's new framework for implementing monetary policy has been successful so far in achieving the new target range set by the FOMC. The FOMC has said that it will continue to assess its approach to policy implementation and will adjust the settings of its policy tools (and possibly use other tools as necessary) for appropriate monetary control, based on policymakers' assessments of the efficacy and costs of their tools.12
* We thank Jim Clouse for comments and Kristen Meier for excellent research assistance. Return to text
1. For a detailed description of the new implementation framework, see Rewriting Monetary Policy 101  and Monetary Policy 101: A Primer (PDF).
2. The FOMC outlined its plans, including its intention to use these two policy tools, in the Policy Normalization Principles and Plans released after the September 2014 FOMC meeting. Return to text
3. See the Federal Reserve Bank of New York's website for the full list of the Fed's eligible RRP counterparties , which include primary dealers, banks, money market mutual funds, and government-sponsored enterprises. Return to text
4. For a description of repo markets in the context of implementing monetary policy, see Rewriting Monetary Policy 101 and Monetary Policy 101: A Primer. Return to text
5. Federal funds counterparties are defined in the Federal Reserve's Regulation D; these counterparties include depository institutions and government-sponsored enterprises. Return to text
6. Specifically, the rates plotted are trade-weighted averages. The federal funds rate on this basis is referred to as the "effective federal funds rate." Return to text
7. Transaction-level data are collected by the Federal Reserve for a few money market instruments in the FR 2420 data collection to aid in the analysis of current money market conditions and allow the Federal Reserve Bank of New York to calculate and publish interest rate statistics for selected money market instruments. See the Federal Reserve Bank of New York's website for a description of the FR 2420's federal funds data . Return to text
8. Increases in ON RRP take-up over subsequent days were largely consistent with expected calendar effects unrelated to increasing the federal funds target range. Return to text
9. Domestic banks do not have the same incentives on quarter-end reporting dates because their regulatory leverage ratios are computed on a daily-average basis. Return to text
10. Unlike previous quarter-ends, however, with temporarily elevated ON RRP facility capacity available to support policy implementation, the Fed offered ON and term operations at the same rate of 25 basis points, and so counterparties elected to essentially participate only in the overnight offerings. Return to text
11. In her September 2014 postmeeting press conference (PDF) (p. 6), Chair Yellen noted that, "The Committee expects that the effective federal funds rate may vary within the target range, and could even move outside of that range on occasion, but such movements should have no material effect on financial conditions or the broader economy." Return to text
12. See the March 2015 FOMC meeting minutes, which included additional details regarding the FOMC's Policy Normalization Principles and Plans. Return to text
Please cite this note as:
Anderson, Alyssa G., Jane E. Ihrig, Ellen E. Meade, and Gretchen C. Weinbach (2016). "What Happened in Money Markets After the Fed's December Rate Increase?," FEDS Notes. Washington: Board of Governors of the Federal Reserve System, February 22, http://dx.doi.org/10.17016/2380-7172.1713.
Disclaimer: FEDS Notes are articles in which Board economists offer their own views and present analysis on a range of topics in economics and finance. These articles are shorter and less technically oriented than FEDS Working Papers.