
FEDS Notes
 Print
PrintJanuary 4, 2017
Demand for Voluntary Balance Requirements: the U.S. Experience with Contractual Clearing Balances from 2000 to 20071
Jeffrey M. Naber, Richard Sambasivam, and Mary-Frances Styczynski
Contractual clearing balances were a type of balance that a depository institution (hereafter "bank") could voluntarily agree to hold in their account at the Federal Reserve in addition to mandatory reserve requirements, or reserve balance requirements (RBR) prior to 2012. In lieu of interest, these account balances were held in exchange for credits that could be used to offset Federal Reserve priced service charges. Banks' interest in the program in the early 2000s was substantial with clearing balance requirements accounting for around half of total reserves in the system, which at the time averaged nearly $20 billion, making this period of time ideal for analysis. In this note, we explore the factors contributing to bank demand for contractual clearing balances from 2000 to 2007. While the period of study is very different from today -- namely the absence of interest on reserves and low levels of excess reserves, it does provide firsthand experience with a version of a monetary policy framework that included voluntarily set balance requirements.
We find evidence of bank behavior during the 2000 to 2007 period that is consistent with the reserve management model specified by Poole (1968) in which banks seek to maximize profit while managing uncertainty with regards to payment flows. Our analysis identified two factors supportive of the Poole model. First, banks adjusted their clearing balance holdings to changes in market interest rates, suggesting some sensitivity to opportunity cost of holding balances. In rising rate environments -- as measured by changes in the effective federal funds rates -- clearing balances tended to decrease, and vice versa when rates were falling. Second, demand for clearing balances was found to be sensitive to the timing of Federal Reserve transactions, as measured by the timing of Fedwire® transfers. Staff found that the later in the day the majority of Fedwire® transfers were completed, in terms of value, the larger the demand for clearing, which is likely related to the fact that late day transactions are more difficult to cover in a cost effective manner, encouraging banks to target a higher total balance than they otherwise would have to avoid costly overdrafts. The higher balance would likely be filled by entering into a clearing balance arrangement, which unlike excess balances at the time, offered a positive return on reserves.
Background
The Federal Reserve offered contractual clearing balances from the early 1980s until the middle of 2012. Clearing balances were introduced as part of the Monetary Control Act at a time when the Federal Reserve was expanding access to Federal Reserve priced services.2 A bank could voluntarily hold a specified level of funds, a contractual clearing balance, in their account at the Federal Reserve in addition to a reserve balance requirement (RBR) in exchange for earnings credits.3 These earnings credits could be used to offset Federal Reserve priced services, such as Fedwire® funds transactions. The amount of earnings credits a bank could receive for a given level of clearing balances was determined based on the earnings credit rate, which was set by the Federal Reserve at a level comparable to the rates offered by private sector banks on their own compensating balances. From the start of the program up until January 2003, the earnings credit rate was set equal to the effective federal funds rate. In January 2004, the earnings credit rate formulation was changed to be a fraction of the three-month Treasury bill.4 These rate changes were implemented to bring the compensation on clearing balances more in line with market-based prices to ensure the Federal Reserve was competing fairly with private institutions offering similar services.
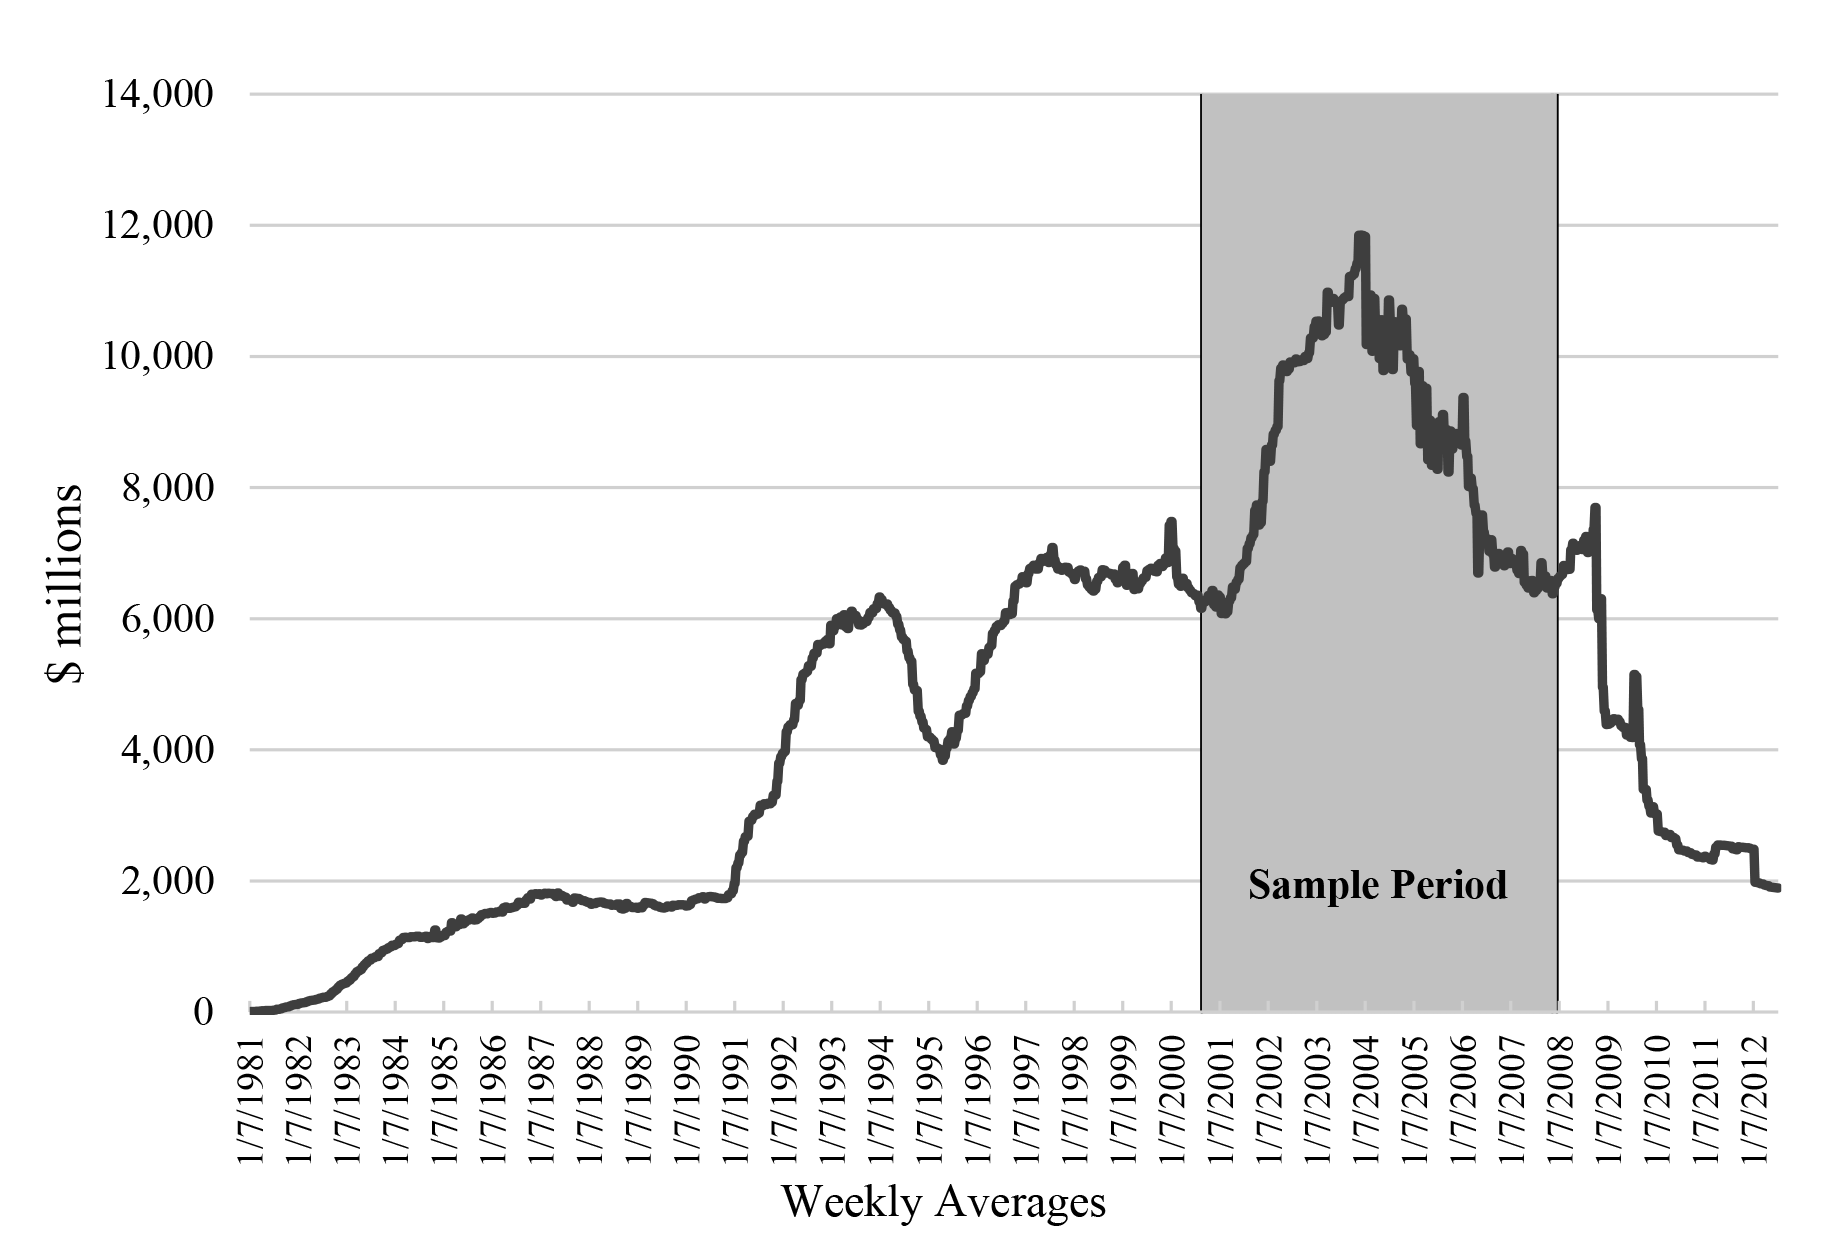
There are four reasons why banks may have wanted to hold clearing balances. First, some banks may have preferred to pay for Federal Reserve service charges with earnings credits versus being billed by the Federal Reserve. Second, clearing balances helped banks manage their maintenance period reserve balances to a desired level. Third, some banks viewed the rates offered on clearing balances as competitive. Finally, there was a certain amount of inertia in the sense that clearing balances were easy to 'set and forget'. With these in mind, figure 1 presents the evolution of bank holdings of clearing balances from 1980 through the middle of 2012. It is clear that holdings went through cycles of rapid expansion (from around December 1990 to June 1993 and January 2001 to December 2003) and contraction (from about January 1994 to April 1995 and January 2004 to November 2007).5 ,6 These cycles were likely influenced by the level and changes in market interest rates, RBR, and banks' use of Federal Reserve priced services. These three factors form the foundation for our investigation of the key drivers of changes in clearing balances, and are discussed in greater detail below.
 |
|
Source: Federal Reserve data. Clearing balances were reported on the H.4.1 statistical release, Factors Affecting Reserve Balances.
Note: Clearing balances were no longer offered as of July 12, 2012.
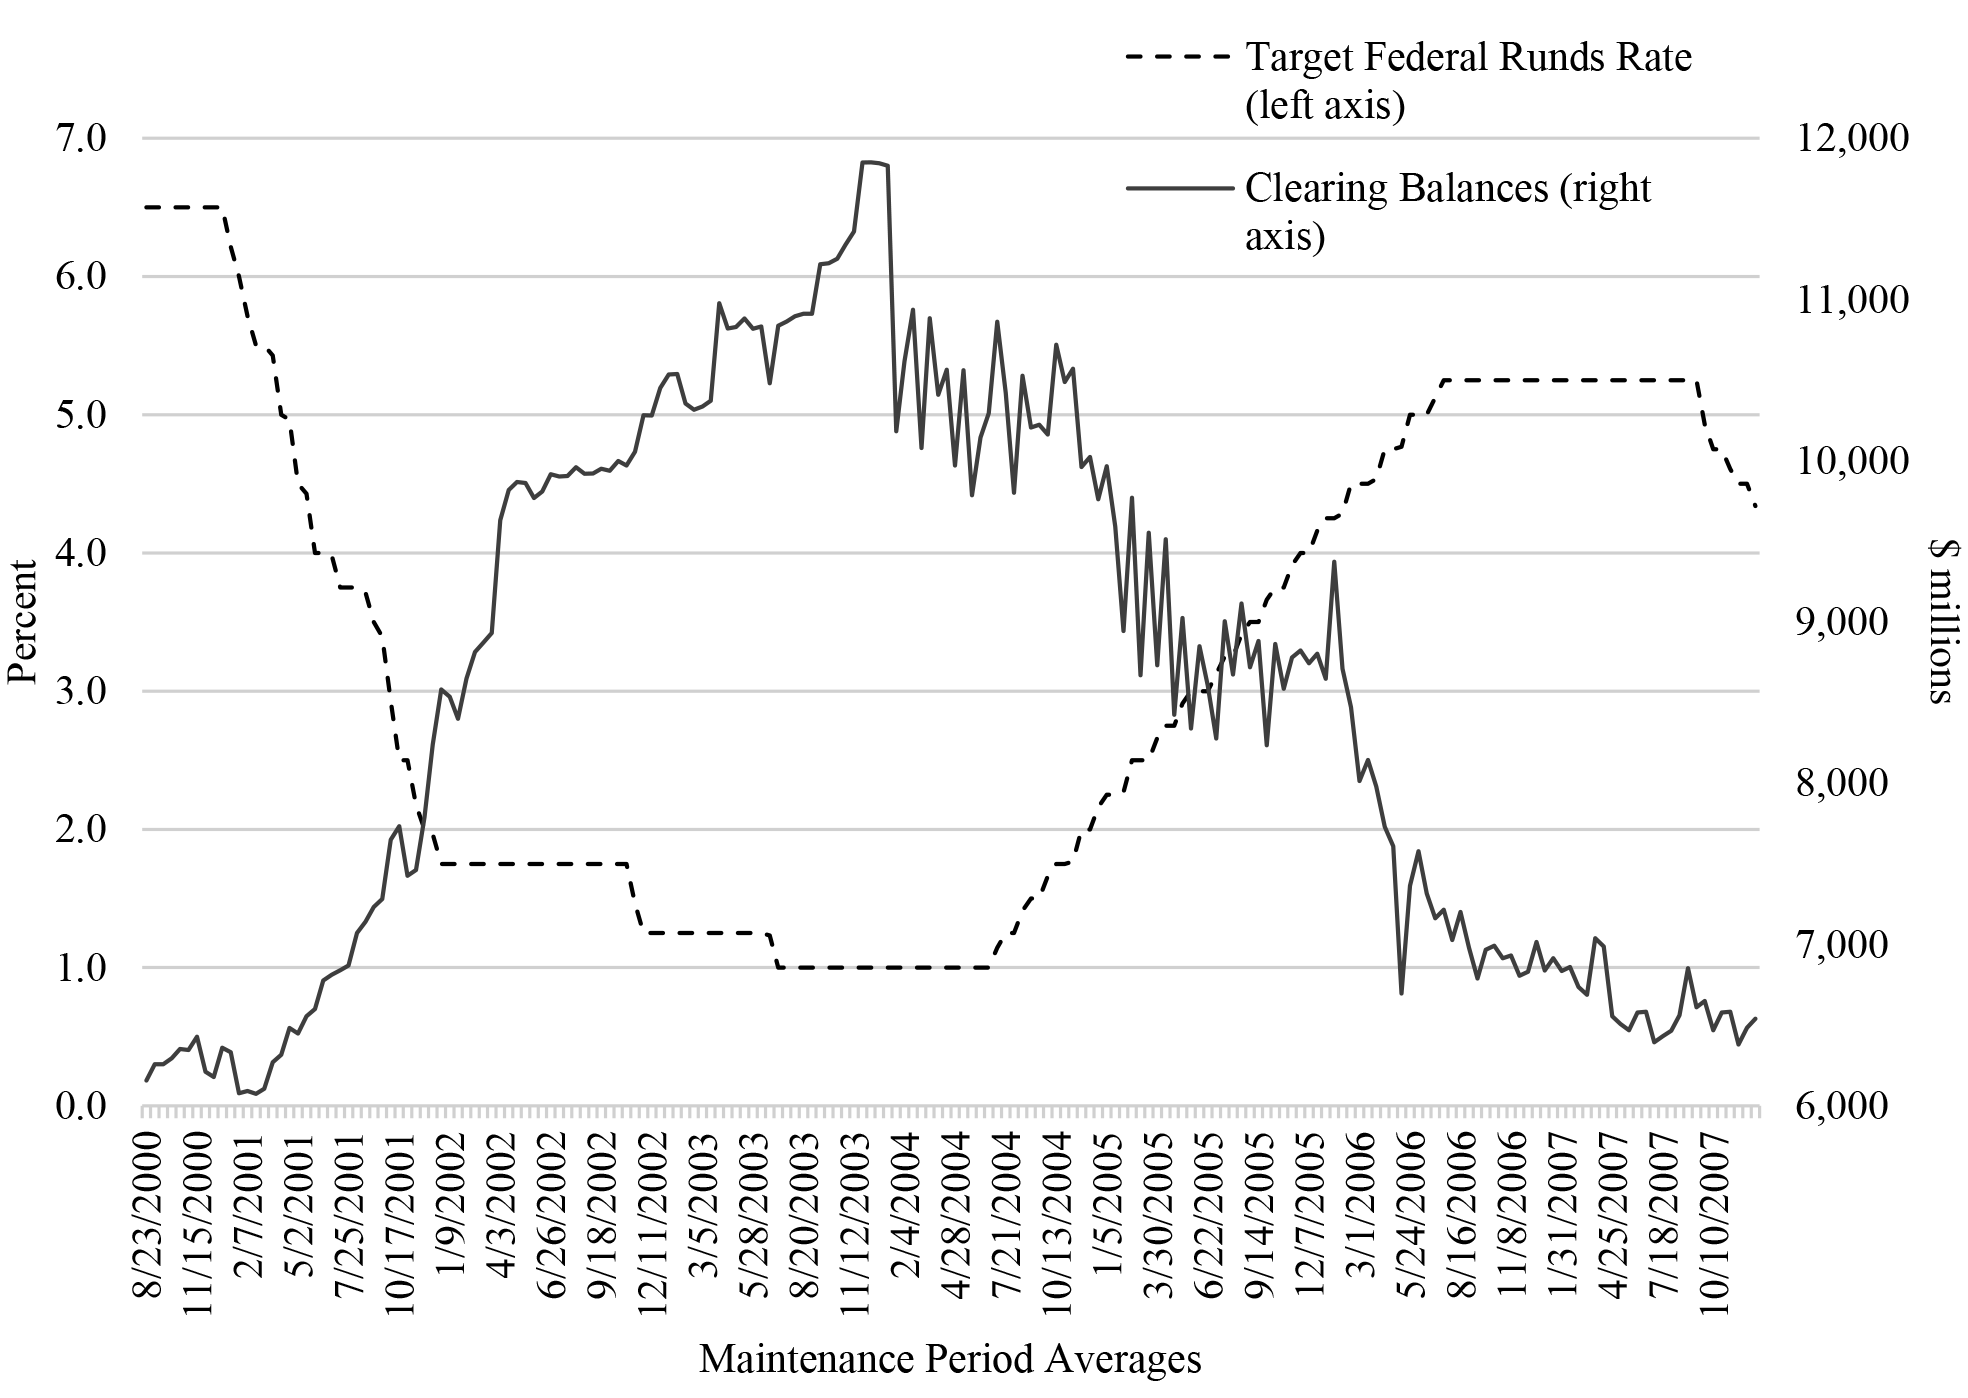
Market Interest Rates: Clearing balances offered banks compensation that was somewhat equivalent to other types of interest-earning assets. In practice, the earnings credit rate was never set higher than other relevant money market interest rates, and thus, there was an opportunity cost to holding clearing balances with the Federal Reserve. All else equal, the higher the opportunity cost of holding funds with the Federal Reserve, the lower the level of clearing balances demanded by banks. Indeed, changes in clearing balances in the 1990s and 2000s appear to be negatively related to movements in market interest rates, such as the target federal funds rate. During rate easing cycles, clearing balances increased with the reverse occurring during rate tightening cycles. These trends can be seen more clearly in figure 2, which plots maintenance period averages of the target federal funds rate against clearing balance levels from mid-2000 to late 2007. From December 2000 to July 2003, the target federal funds rate declined by 5-1/2 percent, and over this same period, clearing balances nearly doubled in size. During the subsequent tightening cycle that began in the middle of 2004, clearing balances fell by as much as it rose in the earlier easing cycle.
 |
|
Source: Federal Reserve data plus authors' calculations to convert data into 14-day maintenance period averages. Clearing balances were reported on the H.4.1 statistical release, Factors Affecting Reserve Balances. Data on the target federal funds rate are reported on the Board of Governors' website.
Changes in RBR: In the 1990s, banks adopted measures to minimize the amount of deposits subject to reserve requirements, which resulted in a decrease in RBR or the amount of funds a bank had to hold in an account at the Federal Reserve. The decrease in RBR did not result in a one for one decline in balances held at the Federal Reserve because banks still needed to hold balances to meet day-to-day payment activity and minimize chances of costly overnight overdrafts. Banks filled the balance gap formed by the decline in RBR by entering into clearing balances, which relative to excess reserves -- the only other balance option for banks -- provided compensation.
Federal Reserve Priced Services: Demand for clearing balances would likely be related to banks use of Federal Reserve-priced services. One way to capture how priced services influence changes in clearing balances is to look at changes in the number, value, and timing of bank Fedwire® funds transactions. Banks may set their clearing balance so that the earnings credits generated partially or fully cover their Federal Reserve charges. For these banks, the number and value of Fedwire® funds transactions would determine the amount of Federal Reserve charges and thus be a factor in determining the level of desired earnings credits. The timing of Fedwire® funds transactions may also matter because transactions occurring later in the day may be more difficult to cover and thus may encourage banks to target a higher balance than they otherwise would have to avoid costly overdrafts. The higher balance would likely be filled by entering into a clearing balance arrangement.
Data
We focus our analysis on data from August 2000 to December 2007 (highlighted section of figure 1).7 Our dataset contains 192 two-week maintenance periods running from August 2000 to December 2007 for which data on contractual clearing balances are readily available. To quantify the effects of Federal Reserve priced services on demand for clearing balances, we rely on daily data on Fedwire® funds transactions, converted to maintenance period averages and millions of dollars when necessary. Fedwire® funds data include information on the timing, number, and value of various transactions conducted via Fedwire® on a given day. Time variables have been converted to total seconds and should be interpreted as the number of seconds since midnight. To determine how banks adjusted their clearing balances relative to changes in the rate earned on clearing balances as well as other market interest rates, we assembled a time series of the earnings credit rate, the target federal funds rate, the effective federal funds rate. Each of the rates included in the analysis were converted from either a weekly frequency (earnings credit rate) or daily frequency (target and effective) to a maintenance period length. Our sample period is ideal in that it includes two different monetary policy interest rate adjustment cycles, one easing and one tightening, for which we can leverage to understand how changes in interest rates affect demand for clearing balances (figure 1, shaded region). Table 1 provides summary statistics of the variables examined over the period. The variables in bold were ultimately used in our preferred model of changes in clearing balances, discussed in the next section.
Maintenance Period Averages
| Variable | Obs. | Mean | Std. Dev. | Min. | Max. |
|---|---|---|---|---|---|
| Clearing balances ($ millions) | 192 | 8,584 | 1,722 | 6,075 | 11,851 |
| Reserve balance requirement ($ millions) | 192 | 8,272 | 2,088 | 4,803 | 15,265 |
| Fedwire® variables (1) | |||||
| Time at which 25% of the number of Fedwire® transfers were completed | 192 | 39,804 | 11,032 | 37,459 | 191,584 |
| Time at which 50% of the number of Fedwire® transfers were completed | 192 | 48,003 | 476 | 45,838 | 49,514 |
| Time at which 75% of the number of Fedwire® transfers were completed | 192 | 55,797 | 354 | 52,871 | 56,593 |
| Time at which 25% of the value of Fedwire® transfers were completed | 192 | 49,534 | 1,035 | 45,845 | 52,357 |
| Time at which 50% of the value of Fedwire® transfers were completed | 192 | 58,333 | 611 | 55,835 | 60,823 |
| Time at which 75% of the value of Fedwire® transfers were completed | 192 | 61,573 | 536 | 60,263 | 67,497 |
| Average value of Fedwire® transfers ($ millions) | 192 | 4 | 1 | 3 | 6 |
| Maximum value of Fedwire® transfers ($ millions) | 192 | 7,455 | 3,851 | 1,000 | 10,000 |
| Number of Fedwire® transfers | 192 | 481,703 | 49,048 | 366,927 | 621,533 |
| Interest rate variables (percent) | |||||
| Target federal funds rate | 192 | 3.21 | 1.80 | 1.00 | 6.50 |
| Effective federal funds rate | 192 | 3.20 | 1.80 | 0.94 | 6.57 |
| Earnings credit rate | 192 | 2.73 | 1.55 | 0.83 | 6.57 |
Sources: Federal Reserve data plus authors' calculations to convert data into 14-day maintenance period averages. Clearing balances were reported on the H.4.1 statistical release, Factors Affecting Reserve Balances. Reserve balance requirements are available on the H.3 statistical release, Aggregate Reserves of Depository Institutions and the Monetary Base. Fedwire® and earnings credit rates data are based on internal Federal Reserve records. Data on the target federal funds rate are available on the Board of Governors' website, while data on the effective federal funds rates are from the Federal Reserve Bank of New York's website.
Note: Variables in bold denote those used in the preferred model of clearing balances presented in table 2.
(1) Time variables are in seconds and should be interpreted as seconds since midnight.
Empirical Specification
We tested out a number of different approaches to modeling the main drivers of bank demand for clearing balances, but ultimately settled on the following:
The first term is the lagged difference in the dependent variable, which is used to control for autocorrelation. The second term is an indicator variable that takes a value of 1 if the date is January 21, 2004 and 0 otherwise. This variable is added to capture the large one-time drop in contractual clearing balance levels around this time as a result of a change in the administration of clearing balances. For the third term, change in Rates, three lags of the effective federal funds rate performed the best out of all the rates examined. The inclusion of three lags is used to account for any delays in banks response to changes in these variables due to limitations on the frequency with which they could adjust their clearing balance level. For example, prior to 2004, banks could only adjust their clearing balances once a month and thus there could be a delay in how quickly banks could respond to a rate change.8 Since RBR is known in advance of the start of a maintenance period, its contemporaneous value is used. Finally, for Fedwire® variables, the time at which 75 percent of the value of Fedwire® transfers were completed was found to be the most useful in explaining changes in demand for clearing balances. Because banks cannot anticipate all future payment activity, we included two lags of this variable.
Empirical Results
As presented in table 2, this specification explains over 50 percent of the variation in clearing balances over the sample period, and the coefficients of interest -- the effective federal funds rate, RBR, and Fedwire® values -- have the proper sign and are for the most part significant. The coefficient on the second and third lag of the change in the effective federal funds rate is negative and statistically significant. This negative relationship indicates that a 1 percentage point increase in the effective federal funds rate two to three maintenance periods in the past results in a decrease in clearing balances of roughly 290 million and 300 million, respectively. The coefficient on RBR is negative and significant. A $1 million increase in RBR is associated with a $0.07 million decrease in clearing balances. This result lends some support to the theory that RBR and clearing are substitutable as banks managed Federal Reserve account balances to a desired total level. However, given the small size of the effect, it is unlikely to be a result that applies to all banks, but possibly is a feature of the behavior of larger banks.
The coefficient on the second lag of the Fedwire® value variable is positive and significant, and suggests that a 60-second delay in the average completion time would result in a $6 million increase in clearing balances. This finding is likely related to the fact that late day transactions are more difficult to cover in a cost effective manner, encouraging banks to target a higher balance than they otherwise would have to avoid costly overdrafts. The higher balance would likely be filled by entering into a clearing balance arrangement, which unlike excess balances at the time, offered a positive return.
| Clearing Balancet | |
|---|---|
| Constant | 1.134 (19.06) |
| Clearing Balancet-1 | -0.383*** (0.0712) |
| Dummy for Maintenance Period 1/21/2004 | -1412.9*** (54.91) |
| Effective Federal Funds Ratet-1 | -99.93 (148.3) |
| Effective Federal Funds Ratet-2 | -292.4* (147.5) |
| Effective Federal Funds Ratet-3 | -299.9* (116.0) |
| Reserve Balance Requirementt | -0.0722*** (0.0122) |
| Time of 75% of Value of Transactionst-1 | 0.0485 (0.0274) |
| Time of 75% of Value of Transactionst-2 | 0.103*** |
| Number of observations | 188 |
| Adjusted R-squared | 0.52 |
Standard errors in parentheses * p<0.05 ** p<0.01 *** p<0.001
Conclusion
In this note, we show evidence that banks' demand for contractual clearing balances from 2000 to 2007 was driven by their desire to maximize profit while addressing uncertainty with regards to payment flows. These findings are consistent with the Poole (1968) model of bank reserve account management. The Poole model defines bank reserve account management as governed by profit maximization under uncertainty.9 The uncertainty regarding reserve balance flows encourages banks to hold precautionary balances, or additional accounting balances than otherwise needed. In support of the uncertainty hypothesis, we found that the change in the level of clearing balances is positively correlated with the change in the time of Fedwire® funds transactions. The ability to profit through lending excess account balances to other banks incentivizes a bank to manage their precautionary balances to as low a level as possible. In our analysis, we found that the change in the level of clearing balances is negatively correlated with the change in the effective federal funds rate; recall, the effective federal funds rate is used to proxy the opportunity cost of holding clearing balances. This result lends further support to the Poole model proposition that banks are also profit maximizers, and work to balance the need for precautionary balances with the ability to lend balances to other banks to earn a profit.
References
Edwards, Cheryl L. 1997. "Open Market Operations in the 1990s." Federal Reserve Bulletin (November): 859-874, https://www.federalreserve.gov/pubs/bulletin/1997/199711lead.pdf.
Poole, William. 1968. "Commercial Bank Reserve Management in a Stochastic Model: Implications for Monetary Policy." The Journal of Finance 23 (5): 769-791.
1. We thank Jeff Huther and Beth Klee for their helpful comments and overall support. Return to text
2. For example, reserve requirements applied to all banks not just banks that were members of the Federal Reserve (member banks) and non-member banks could use Federal Reserve services, such as check clearing or electronic payment services. Return to text
3. RBR is the portion of a bank's reserve requirement not covered by vault cash. Return to text
4. The changes were announced in October of 2003. The change to the earnings credit rate calculation took effect on January 2, 2004. Board of Governors of the Federal Reserve System (2003). Notice (Docket No. 03-27123), Federal Register, vol. 68 (October 28), pp. 61418-61444. Return to text
5. Post November 2007, clearing balances began to rise again. Levels peaked in early October 2008, reversed course, and continued to decline steadily until the Federal Reserve decommissioned them at the end of June 2012. The main driver for the declines in clearing balances post-October 2008 was the introduction of interest on reserves on excess balances (IOER). Clearing balances did not disappear after the introduction of IOER, likely because of bank inertia and/or some banks' preferences to earn credits to pay automatically for Federal Reserve priced services versus hard cash in the form of IOER. Return to text
6. For additional discussion of developments in clearing balance during the 1990s, please review Edwards (1997), pp. 870-871. Return to text
7. We only had access to Federal Reserve transaction data back to August 2000, which dictated our start date. The sample ends in December 2007 to minimize the crisis effects, even though the crisis period technically started in mid-2007. Return to text
8. Beginning in 2004, banks were allowed to change their clearing balance before the start of a maintenance period, which for the majority of banks was 14-days long. Thus, there was still a bit of a delay in which banks could respond to a change in the effective federal funds rate. Return to text
9. Poole (1968), p. 790. Return to text
Please cite as: Naber, Jeffrey M., Richard Sambasivam, and Mary-Frances Styczynski (2017). "Demand for Voluntary Balance Requirements: the U.S. Experience with Contractual Clearing Balances from 2000 to 2007," FEDS Notes. Washington: Board of Governors of the Federal Reserve System, January 4, 2017, https://doi.org/10.17016/2380-7172.1755.
Disclaimer: FEDS Notes are articles in which Board economists offer their own views and present analysis on a range of topics in economics and finance. These articles are shorter and less technically oriented than FEDS Working Papers.
