
IFDP Notes
 Print
PrintDecember 3, 2013
Trade in Value-Added
Logan Lewis
As global production sharing expands, gross trade flows provide an increasingly misleading picture of the economic importance of trade. Traditional statistics measure trade on a gross basis, that is, the total value of shipments into and out of a country. U.S. gross exports, for example, include both the domestic value-added and the value of the imported intermediates used in the production process.
Measuring trade on a value-added basis allows us to better capture three key aspects of international trade. First, exports calculated on a value-added basis are a smaller portion of global activity, as this measure excludes imported intermediates that are included in gross exports. Second, by tracing products through production stages across countries to their final destination, value-added data more accurately reveal which countries account for the final demand for exports. And third, value-added data provide a better picture of the contribution of various sectors to the production of exports. For example, value-added data show that the United States exports more services than goods, reversing the traditional view based on gross statistics.
Newly available data  compiled by the OECD and WTO now allow for a systematic analysis of global trade on a value-added basis.1 The dataset is constructed using national input-output tables and trade data. These data allow us to trace the value produced in 18 sectors across 56 countries to their final destinations. Currently, these data are available for selected years between 1995 and 2009.
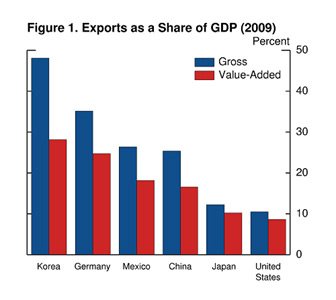
The importance of trade for individual countries can shift notably when measured on a value-added basis, as shown in Figure 1. For the countries heavily involved in production sharing, like Korea, Germany, Mexico, and China, the value-added export share is about a third below the gross measure, suggesting that these economies are less export dependent than the traditional trade numbers would imply.
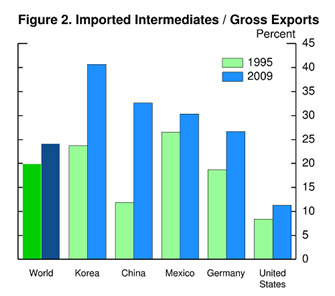
The difference between gross and value-added export shares stems from the amount of imported intermediates embodied in gross exports. As shown in Figure 2, for the world as a whole in 2009 (the blue bar), about one-quarter of gross exports consisted of imported intermediates, up from about one-fifth in 1995 (the green bar). Among individual countries, Korea and China in particular have embraced production sharing, with China's use of imported intermediates in its exports more than doubling to about one-third over this period. By contrast, for the United States, imported intermediates make up only 11 percent of gross exports, reflecting the relatively small role that international production sharing plays in the U.S. economy.
Measuring trade flows on a value-added basis can also affect our understanding of trade networks by revealing more clearly which trading partners are important as sources of final demand. Gross trade statistics measure only the first destination of an exported good or service, not where these products are ultimately consumed. Value-added trade data, on the other hand, trace value from the source of production to the final destination, bypassing countries in between.
| Table 1 |
|---|
| Gross | Value-Added | |||
|---|---|---|---|---|
| to China | to U.S. | to China | to U.S. | |
| (1) | (2) | (3) | (4) | |
| 1. Taiwan | 36 | 12 | 17 | 20 |
| 2. Korea | 28 | 12 | 15 | 19 |
| 3. Hong Kong | 21 | 11 | 13 | 17 |
| 4. Japan | 20 | 17 | 14 | 21 |
| 5. Brazil | 18 | 13 | 13 | 15 |
| 6. Canada | 4 | 66 | 4 | 61 |
| 7. Mexico | 2 | 72 | 2 | 66 |
The importance of this distinction is illustrated in Table 1, which lists the share of various economies' exports to China and to the United States. For Taiwan (line 1), 36 percent of its gross exports are to China (column 1) and only 12 percent are to the United States (column 2). However, measured on a value-added basis, shown in last two columns, China consumes only about 17 percent of Taiwan's exports, while the United States consumes 20 percent. For each of the first five economies listed, gross trade data show China to be the more important trading partner, while in value-added terms, the United States is actually more important. More generally, the global importance of the United States as an export destination increases when measured on a value-added basis and that of China and Germany falls.
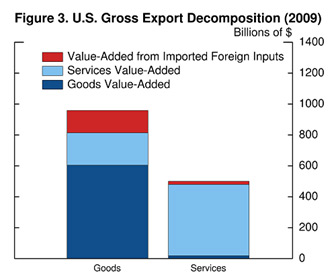
The distinction between gross and value-added trade also has important implications for our understanding of how different sectors of our economy contribute to exports. Figure 3 compares U.S. gross exports of goods, the bar on the left, to services, on the right. With the height of these bars representing total gross exports from each sector, the panel confirms the conventional wisdom that we export more goods than services. However, we can decompose gross goods exports into the value-added from U.S. goods sectors (the dark blue bar), the value-added from U.S. services sectors (in light blue) and the value-added from imported foreign inputs (in red). Note that exports from the goods sectors are produced with large amounts of domestic services, such as financial services, real estate, and other business services. In contrast, nearly all of gross services exports represent services value-added, as those sectors use few inputs either from domestic goods sectors or from abroad.
| Table 2 |
|---|
| As Share of Total Exports | As Share of Total GDP | |||
|---|---|---|---|---|
| Gross | Value-Added | Gross | Value-Added | |
| (1) | (2) | (3) | (4) | |
| 1. Total | -- | -- | 11 | 9 |
| 2. Goods | 66 | 47 | 7 | 4 |
| 3. Services | 34 | 53 | 4 | 5 |
The implications of this decomposition may be seen in Table 2. As shown in the first column, gross goods exports account for a greater share of total gross exports 66 percent than services exports 34 percent. However, expressed on a value-added basis (column 2), U.S. exports of services both directly and indirectly as embodied in goods account for a larger share of total exported value-added than goods. By the same token, as shown in columns 3 and 4, on a gross basis, goods exports exceed services as a share of GDP, but this ordering is reversed on a value-added basis. All told, these calculations suggest that exports of services are a more important factor in U.S. trade and in economic activity and exports of goods a less important factor than is commonly understood.
1. For more information on the data, the OECD has compiled a short summary (PDF) and a detailed methodological description (PDF) . Return to text
Please cite as:
Lewis, Logan (2013). "Trade in Value-Added," IFDP Notes. Washington: Board of Governors of the Federal Reserve System, December 03, 2013. https://doi.org/10.17016/2573-2129.04
Disclaimer: IFDP Notes are articles in which Board economists offer their own views and present analysis on a range of topics in economics and finance. These articles are shorter and less technically oriented than IFDP Working Papers.