
IFDP Notes
 Print
PrintJune 19, 2015
Recent euro-area inflows into U.S. bonds: Reconciling and understanding new data sources
Carol Bertaut and Ruth Judson
1. Introduction
Understanding how global investors respond to differences in monetary policy stances, economic prospects, and other developments that affect financial markets is clearly a topic of interest. However, interpreting the data collected on U.S. (and other) cross-border financial flows can be challenging because different data sources have different features and shortcomings.
In this note we review the data on U.S. cross-border financial flows and positions with a focus on one question of current interest: have euro-area investors been increasing their holdings of U.S. securities since the possibility of European Central Bank quantitative easing (ECB QE) emerged in the latter half of 2014? The prospect of ECB QE, combined with the prospect of U.S. policy rate liftoff, suggested that U.S. interest rates would soon exceed euro-area rates by a wide margin, which might have provided an incentive for euro-area investors to seek higher-yielding U.S. assets, especially bonds. We note that, while some indicators suggest that financial flows from the euro area have been flat or even negative, our view is that the most reliable data indicate that euro-area purchases of U.S. bonds have strengthened, and were particularly strong in early 2015.
2. Data
As noted in greater detail in Bertaut and Judson (2014), the Treasury International Capital (TIC) system collects two types of monthly data on cross-border activity in long-term U.S. securities, each with its own advantages and shortcomings: cross-border transactions (the TIC S), and monthly aggregate reports on cross-border holdings (the TIC SLT).1 In addition, the Bureau of Economic Analysis (BEA) publishes quarterly data on cross-border securities flows and positions based on, but not necessarily equal to, measurements implied by the TIC data. 2 Finally, the ECB publishes quarterly data on cross-border securities flows and positions between itself and (among other locales) the United States.3 Thus, there are multiple current indicators of cross-border positions and flows, which sometimes point to different conclusions.
3. Euro-area investment flows
More recently, interest has focused on whether euro-area investors have increased their holdings of U.S. securities, especially bonds, since discussion of ECB QE began in the summer of 2014.
| Figure 1. TIC S and TIC SLT Estimates of Net Purchases of U.S. Bonds by Euro-Area Residents |
|---|
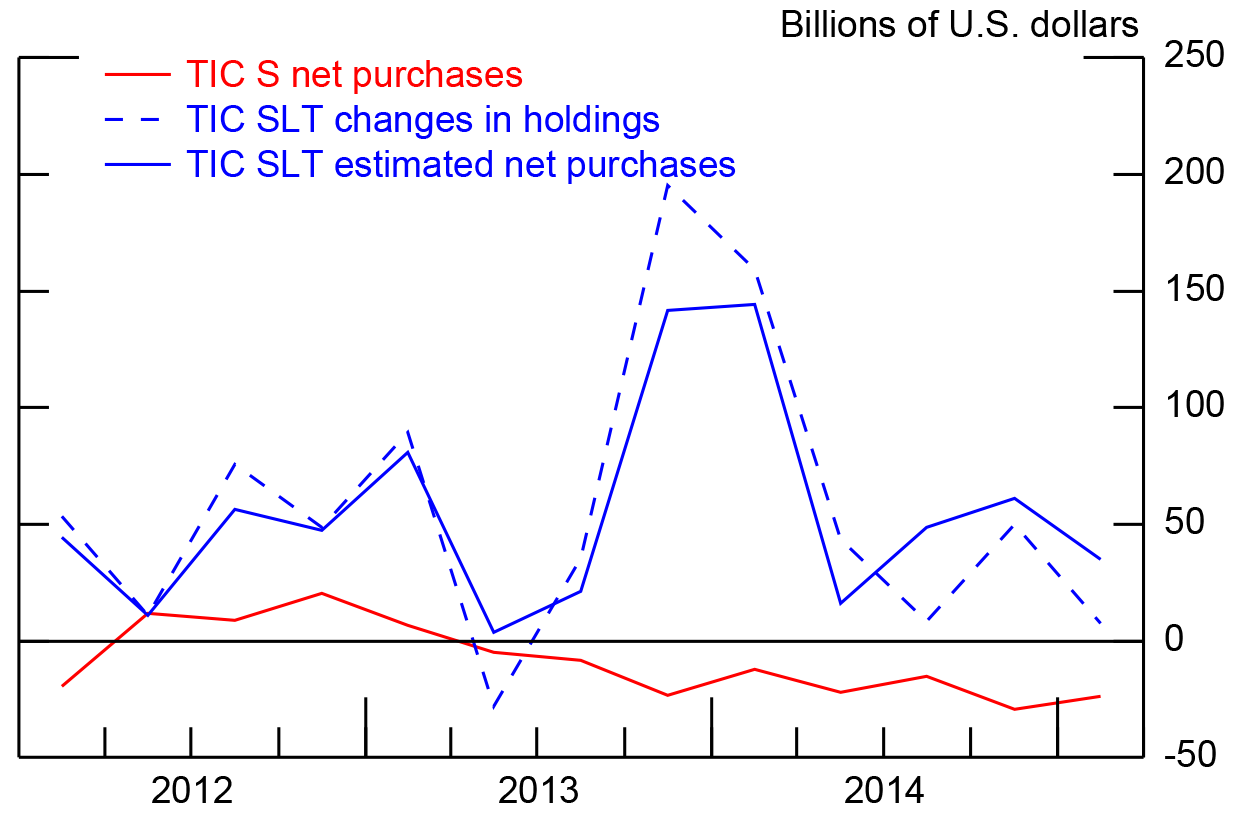 |
Source. U.S. Treasury and staff calculations |
Figure 1 displays three TIC measures of long-term bond flows between the euro area and the United States for 2012 to 2015:Q1. The red line, which displays net transactions as reported by the TIC S, indicates net sales of U.S. bonds by euro-area investors since 2012. As is well known, the transaction data suffer from transactions bias: transactions are recorded in the country where they are executed, which might not be the country of residence of the security owners. The dashed and solid blue lines show two alternative measurements. The dashed line shows the change in euro-area securities holdings as reported on the TIC SLT. Because changes in position are affected by valuation change as well as by transactions, we estimate transactions from the SLT, the solid blue line, as the change in SLT positions adjusted for valuation changes. The SLT is a relatively new report: its first reporting date was in September 2011. As discussed more fully in Bertaut-Judson (2014), we have come to view it as a better source of monthly position and flow estimates, and we thus consider the SLT-based flow estimates, the blue line, to be the most reliable. This estimate points to consistently positive U.S. bond purchases by euro area residents over the past three years, with purchases at moderate levels since mid-2014.
For the euro area, however, the SLT likely suffers from custodial bias: when U.S. securities are held with foreign custodians, the counterparty country reported in the TIC system is that of the custodian, not that of the ultimate owner of the security. In particular, Belgium's holdings of Treasuries are large enough--at about $250 billion, over half of Belgian GDP--that it is fair to conclude that a large share of those holdings are not held by Belgian or even other euro-area residents. Furthermore, changes in Belgian holdings likely do not reflect purchases or sales by euro-area residents. Thus, Figure 2 shows the same items as Figure 1, but for the euro area excluding Belgium. In this calculation, the SLT figures are somewhat less volatile and are smaller in magnitude, but still solidly positive. These SLT-based estimates, which we consider to be the most reliable, point to consistently strong purchases of U.S. bonds by euro-area residents since 2012 and a sizable estimated uptick for the first quarter.
| Figure 2. Estimates of Net Purchases of U.S. Bonds by Euro Area Residents: TIC S and TIC SLT, Excluding Belgium |
|---|
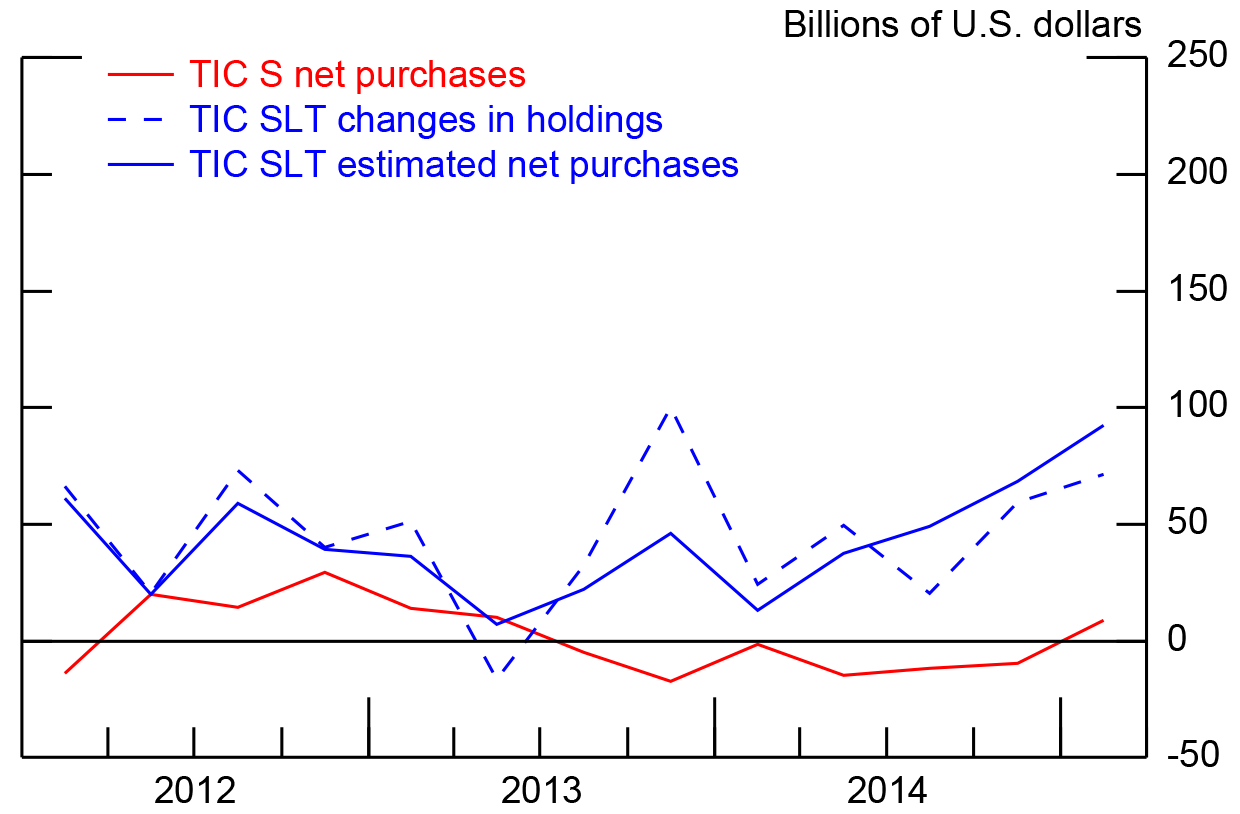 |
Source. U.S. Treasury and staff calculations |
This recent uptick has been concentrated in corporate bonds, as can be seen in Figure 3, which decomposes the SLT-based flow estimates into government bonds, in dark blue, and corporate bonds, in teal. Demand for government securities (Treasuries and agencies) by euro-area residents excluding Belgium has picked up somewhat in 2014, but flows into corporate bond flows have surged. The strength of euro-area inflows to U.S. corporate bonds is consistent with increased issuance of euro-denominated bonds by U.S. firms, which has been quite strong of late.
| Figure 3. Estimates of Net Purchases of U.S. Bonds by Euro Area Residents: TIC SLT Estimated Net Purchases by Type, Excluding Belgium |
|---|
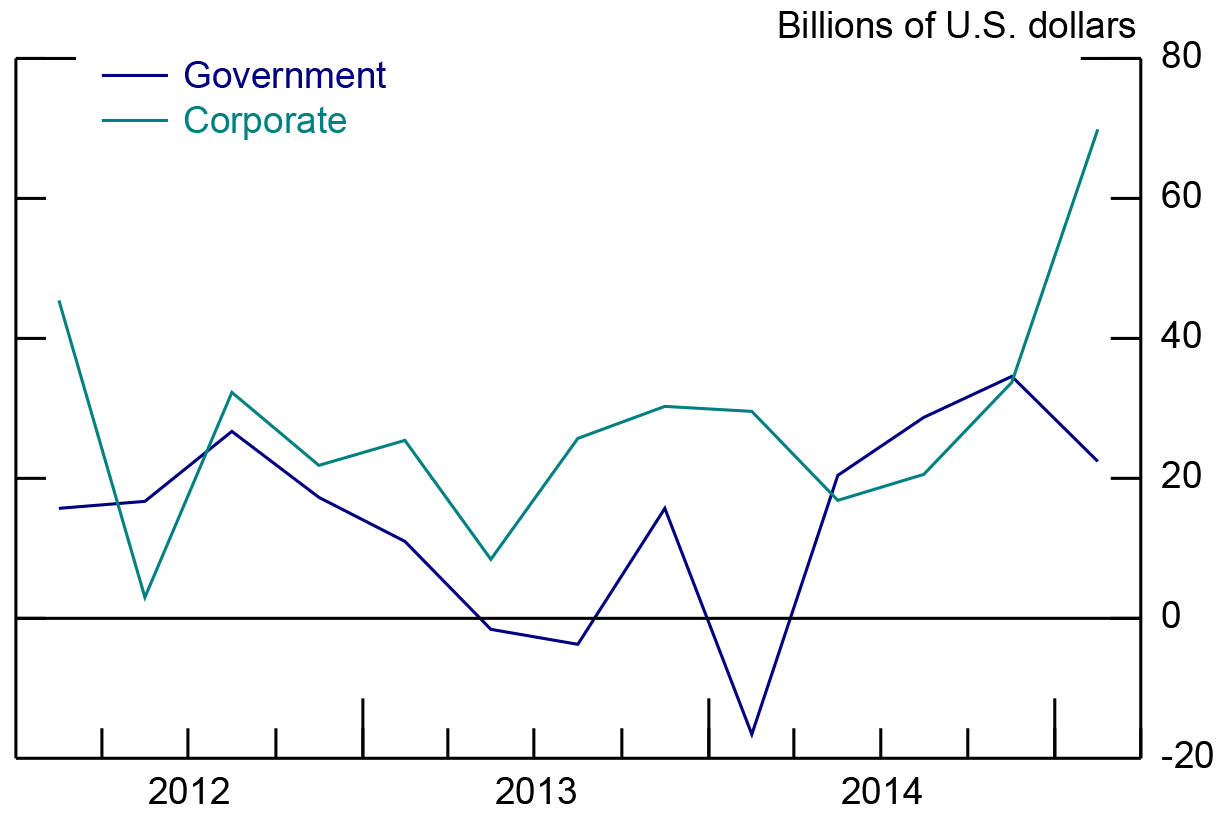 |
Source. U.S. Treasury and staff calculations |
Finally, Figure 4 displays the SLT-based estimates for the euro area excluding Belgium along with the analogous estimates from the BEA and the ECB through the end of 2014.4 The BEA bases its calculations on the TIC data but uses its own valuation change calculations and judgment when the flows reported on the TIC S and implied by the TIC SLT do not align with one another. Thus, the BEA's figures generally track our SLT estimates, but occasionally diverge--most notably in 2013:Q4. The ECB's estimates, shown in green, are considerably lower across the board, but do show a pickup in the latter half of 2014. Differences between the ECB's estimates and the SLT-based estimates may owe to problems of custodial bias in the TIC SLT for euro-area countries in addition to Belgium. Alternatively, the ECB data may understate euro area acquisitions of U.S. bonds, as asset surveys can have difficulty collecting data from residents who conduct transactions via foreign financial intermediaries and entrust their holdings of foreign securities to foreign custodians. Investigating why U.S. and ECB estimates differ and how they might be reconciled is clearly an area for further research. Still, our best estimate of bond flows points to a noticeable uptick in euro-area holdings of U.S bonds since the beginning of ECB QE in early 2015.
| Figure 4. Estimates of Net Purchase of U.S. Bonds by Euro Area Residents: TIC SLT, BEA, and ECB Net Purchases |
|---|
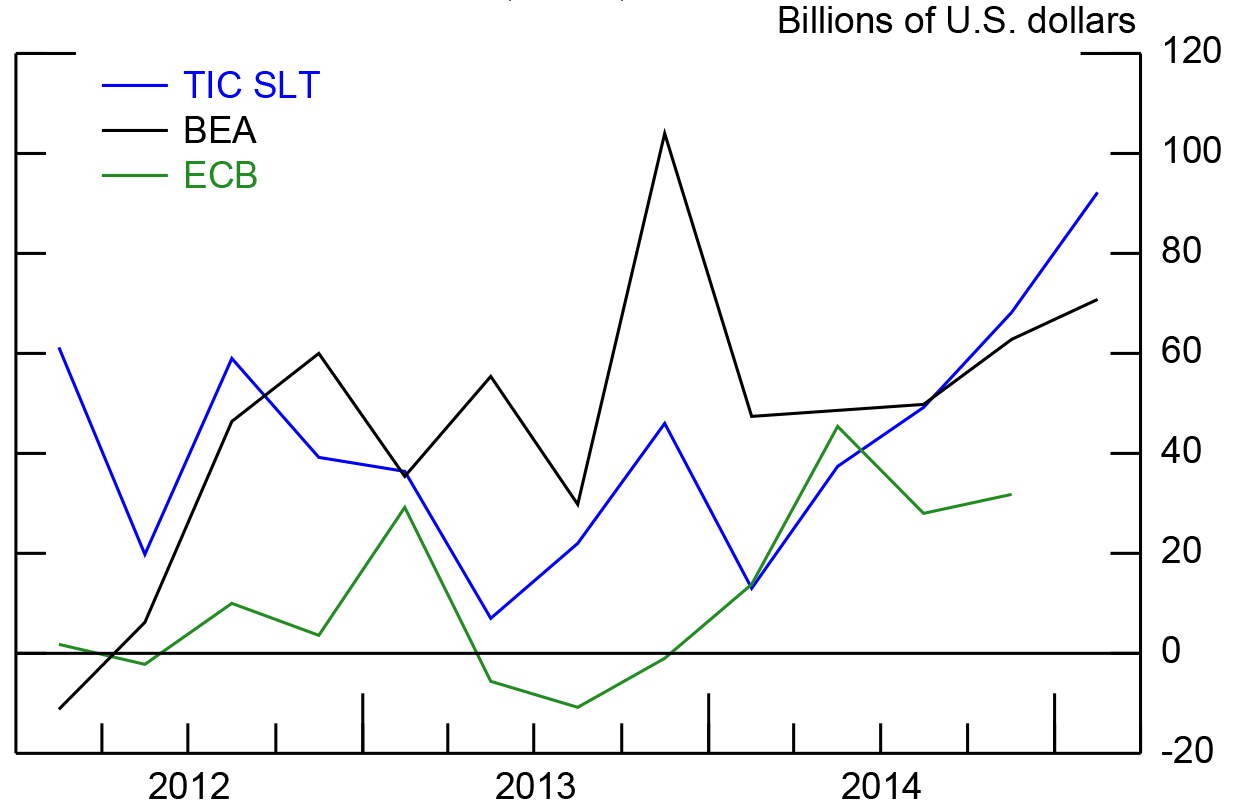 |
TIC SLT and BEA data are for euro area excluding Belgium. ECB data are for whole euro area. Source. U.S. Treasury, staff calculations, BEA, and ECB. |
1. See Bertaut, Carol, and Ruth Judson, "Estimating U.S. Cross-Border Securities Positions: New Data and New Methods," International Finance Discussion Paper 2014-1113. These data have been revised for calendar year 2013, and data for 2014 have been added. The dataset and paper are available at http://www.federalreserve.gov/pubs/ifdp/2014/1113/default.htm. Return to text
2. BEA balance of payments and international investment position data are available at http://www.bea.gov/international/. Return to text
3. ECB balance of payments and international investment position are available at https://www.ecb.europa.eu/stats/external/balance/html/index.en.html  . Return to text
4. Balance of payments data for 2015:Q1 are scheduled for release by the ECB on July 9, 2015. Return to text
Please cite as:
Bertaut, Carol C., and Ruth A. Judson (2015). "Recent Euro-area Inflows into U.S. Bonds: Reconciling and Understanding New Data Sources," IFDP Notes. Washington: Board of Governors of the Federal Reserve System, June 19, 2015. https://doi.org/10.17016/2573-2129.08
Disclaimer: IFDP Notes are articles in which Board economists offer their own views and present analysis on a range of topics in economics and finance. These articles are shorter and less technically oriented than IFDP Working Papers.