
IFDP Notes
 Print
PrintNovember 10, 2016
Causes of the Global Trade Slowdown (PDF)
Logan Lewis and Ryan Monarch *
This note analyzes the striking slowdown in world trade in recent years. After documenting key features of this slowdown, we assess its causes, including to what extent it reflects recent cyclical weakness in global growth versus underlying long-term structural shifts in the world economy. What its causes are has important implications for whether or not the trade slowdown should generates additional concerns in and of itself, beyond general concerns about the future trajectory of world economic growth.
|
|
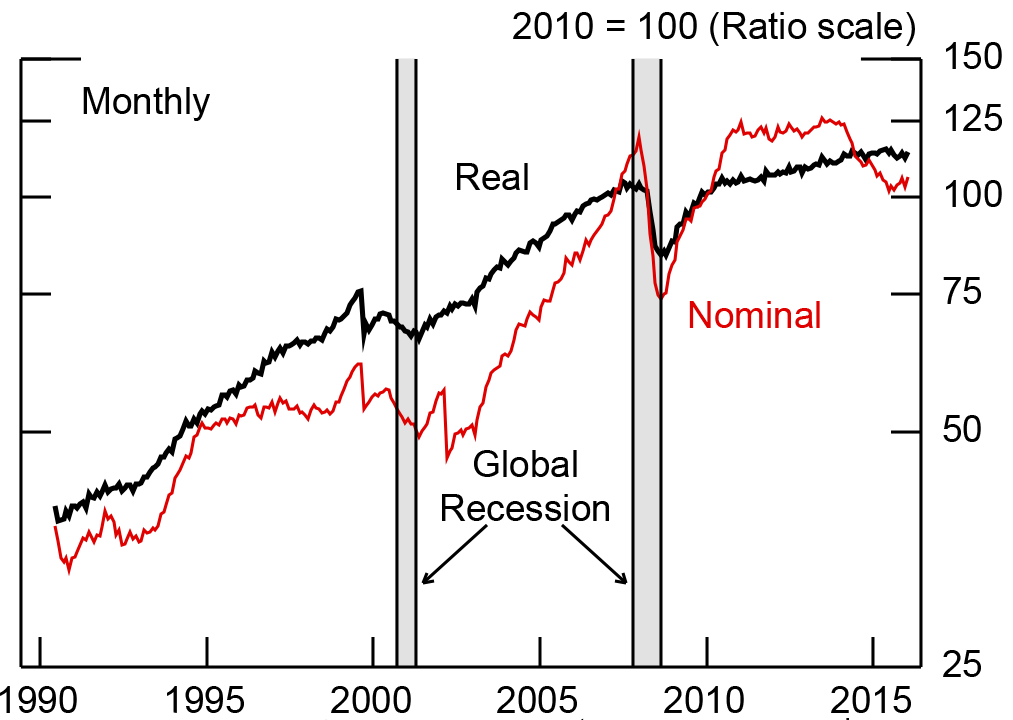
*Level of real imports. Grey bars represent FRB-defined global recessions: 55% of world GDP in recession. Return to text.
Source: Netherlands Bureau for Economic Policy Analysis.
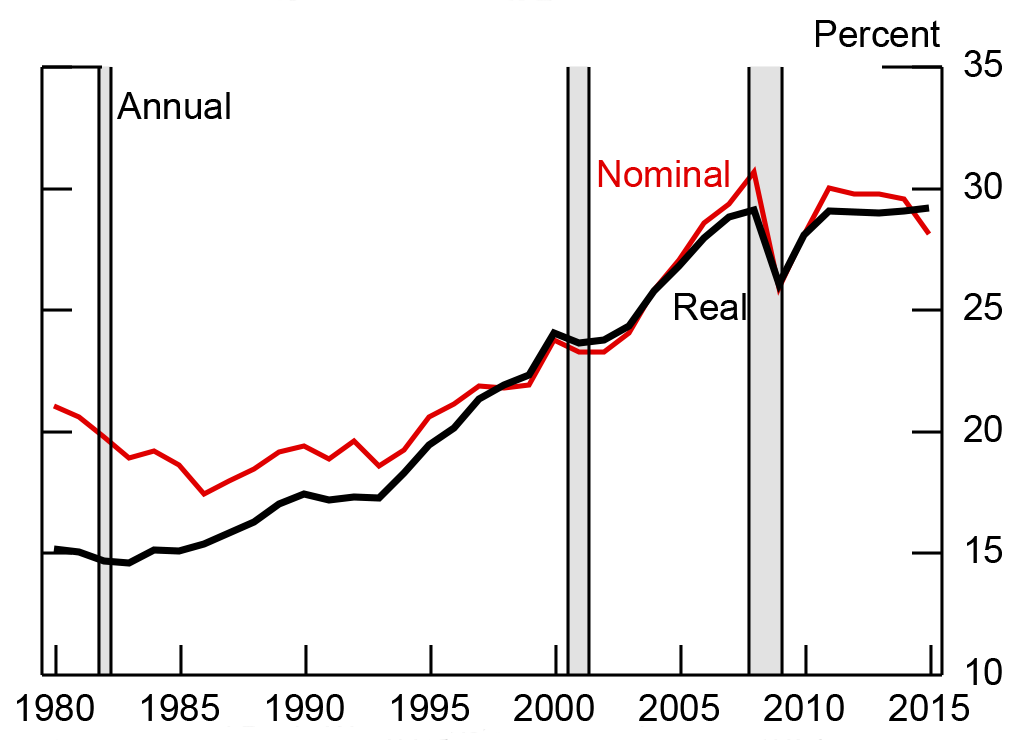
Figure 1 shows that nominal world imports were essentially flat from 2011-2014 and declined substantially in 20151. Much of the fall in nominal trade in 2015 stemmed from declines in commodity prices. This note focuses largely on trade volumes; as can also be seen in Figure 1, growth in real trade has slowed noticeably since 2011. Periods of near-zero growth in trade have been seen before, such as in the mid-1990s. Figure 2 shows that what is unusual about this episode is that real global trade as a share of GDP has been flat for an extended time. Outside of recessionary periods, such a pattern cannot be seen over the past several decades.
|
|
Note: Colors in key correspond with each bar segment, in order from left to right.
Source: Netherlands Bureau for Economic Policy Analysis.

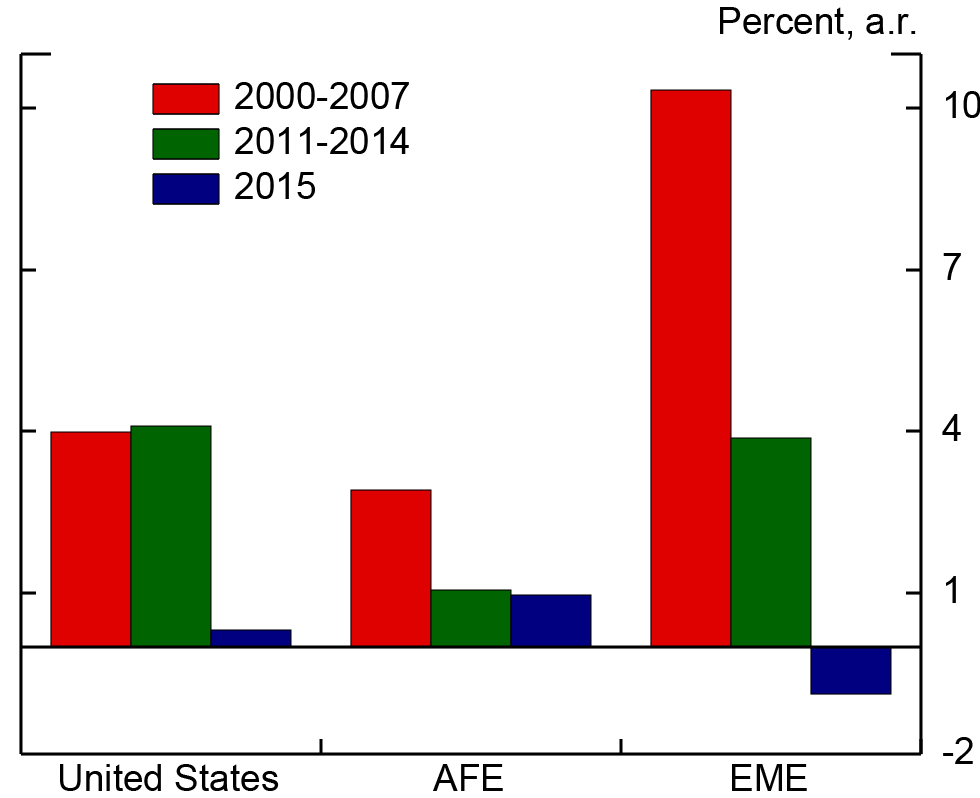
Trade has been sluggish everywhere. Figure 3 shows that U.S. real imports hardly rose at all in 2015, and average import growth rates also declined since 2011 in both the advanced foreign economies (AFEs) and emerging market economies (EMEs) to rates well below those seen before the global financial crisis2. Figure 4 compares real import growth in the years prior to the recent global financial crisis (GFC) (on the horizontal axis) with import growth post-GFC (on the vertical axis) for G20 countries; the clustering of dots below the 45 degree line shows that almost every country had lower import growth after 2011.
|
|
* World imports. Return to text.
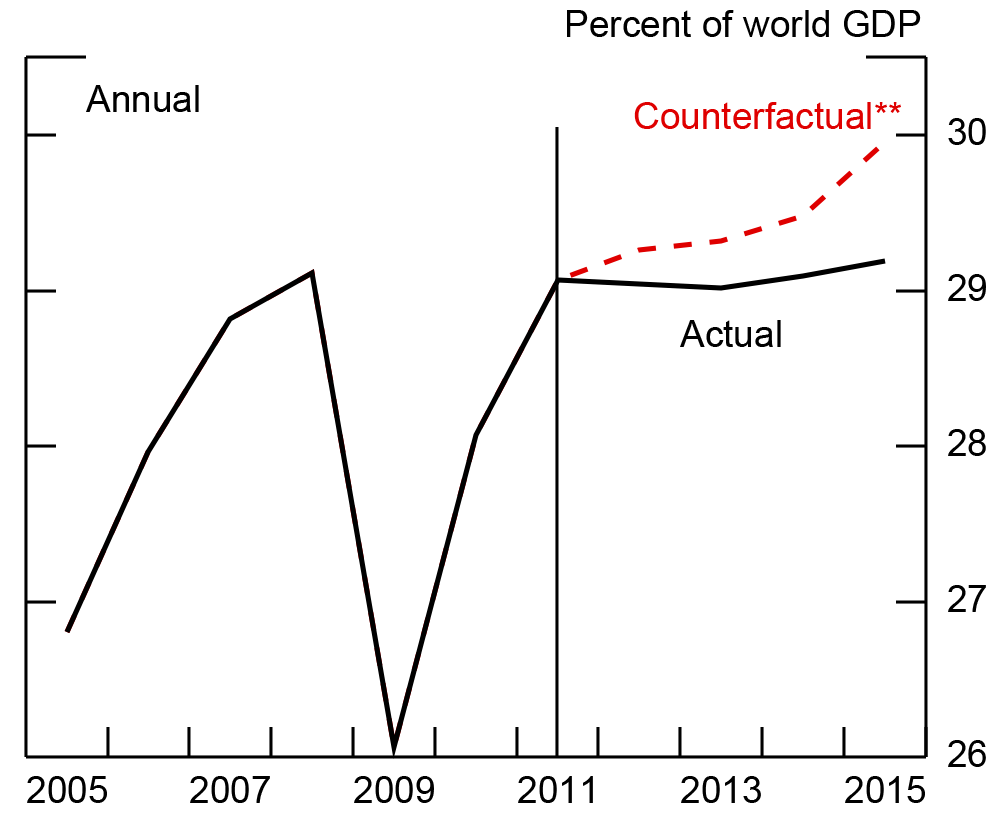
** Keeping China's exports and imports constant as a share of GDP.
Source: World Bank, World Development Indicators (2016).
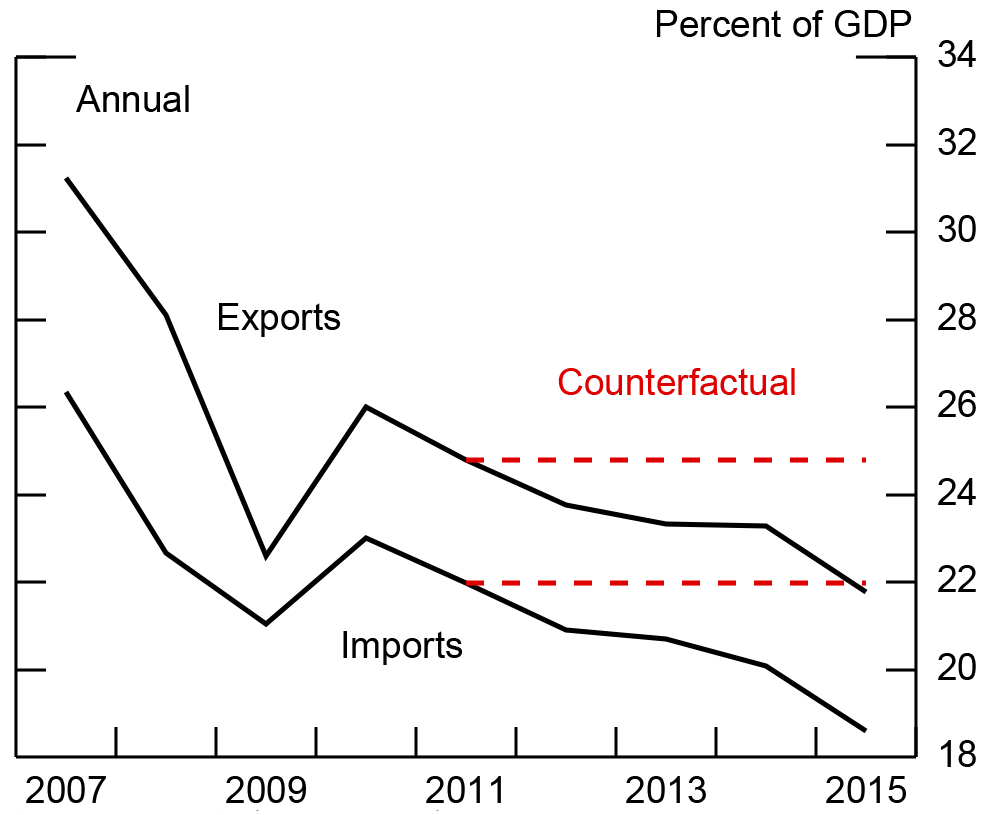
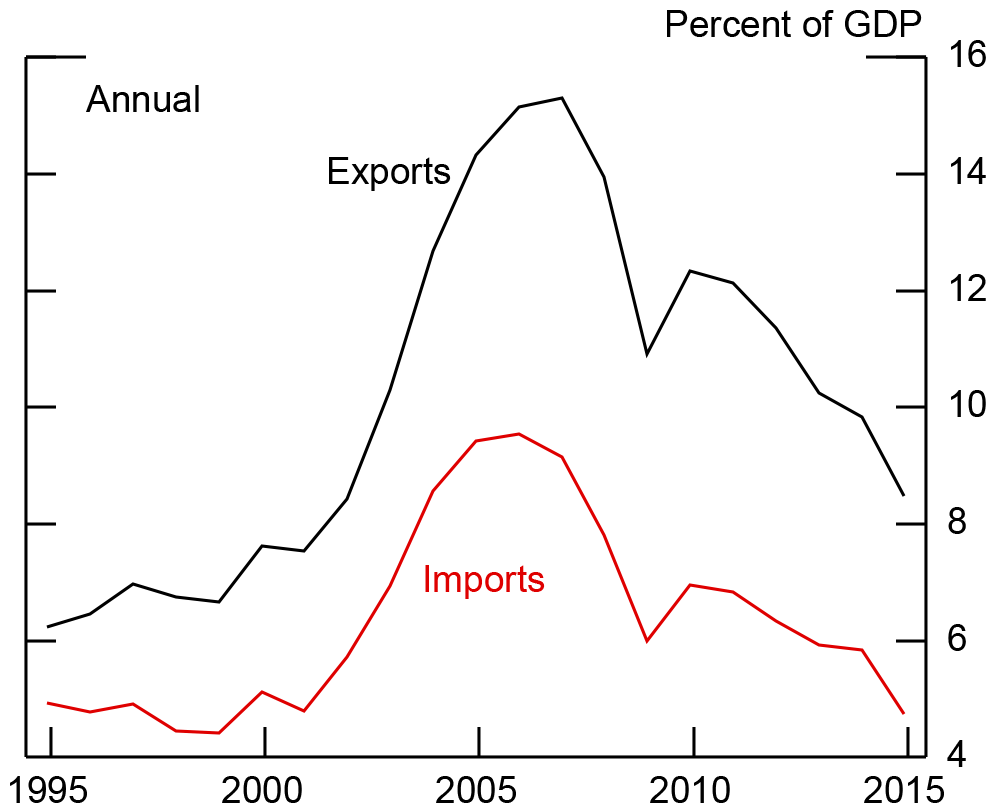
China is one of the countries where trade growth decelerated most. With 16 percent of world exports and 12 percent of world imports, movements in Chinese trade—whether they are a result of independent structural changes going on in China or a reflection of worldwide factors—will have significant implications for the global economy. To get a more concrete sense of the importance of China in world trade, one can ask how much did China contribute, mechanically, to the flattening of world trade relative to GDP? To measure this, we take Chinese real exports and imports as a share of GDP (shown in Figure 5) and hold these shares fixed at their 2011 level over the course of the slowdown period, examining what world trade would have been if China’s trade had not slowed. Figure 6 shows the result—if China’s trade had not fallen, the world real trade-to-GDP ratio would have continued to increase, although still at a significantly slower pace than the pre-GFC trend.
As alluded to earlier, whether the world trade slowdown is something of concern directly apart from general concerns about the global economy slowing depends on an assessment of the different potential causes of the slowdown, which are dealt with in the remainder of this note.
Potential Causes of the Slowdown
There are a number of potential explanations for the changed relationship between trade and growth, including weak demand concentrated in highly-traded products, a deceleration in the pace of trade liberalization, the slowing of cross-country supply chain formation, and ongoing changes in the structure of the Chinese economy3. Of these, the first explanation lends itself to the interpretation of the trade slowdown merely being a reflection of the overall turndown in global growth, whereas the other three explanations are more independent structural changes that would have more direct implications for global growth.
An Expenditure Components Explanation
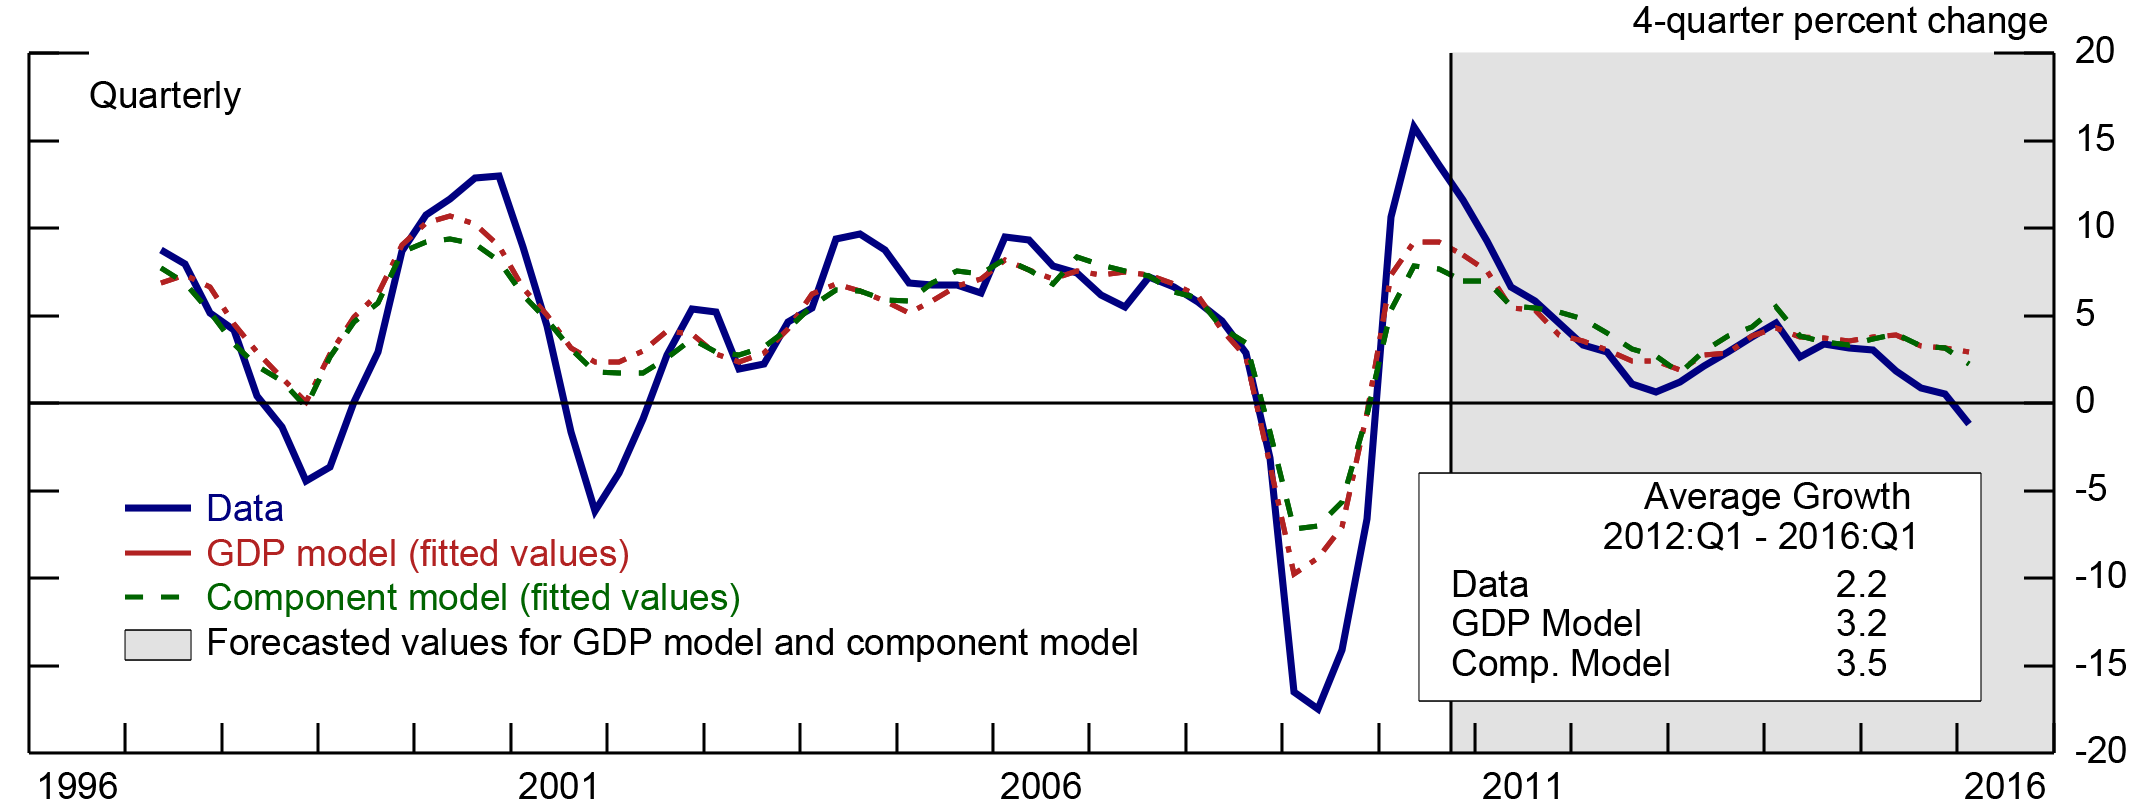
Turning to the first potential mechanism for the trade slowdown in more detail, it is notable that recent weakness in global demand has been concentrated in expenditure categories that are highly traded, such as investment goods and durables4. Trade flows are 40 percent machinery and transport equipment, so trade should be sensitive to trends in investment- this was indeed one of the main reasons trade fell so dramatically during the GFC (Lewis, Levchenko and Tesar 2010). In order to test whether the weakness in trade is just a reflection of weakness in particular sectors of the global economy, we model real imports as a function of consumption, investment, and real exchange rates for several countries, and compare the aggregate performance of this model to one where the components of demand are replaced by overall GDP. The models are estimated separately for 11 countries and the euro area, using quarterly OECD data from the early 1980s through 2010:Q4. China is excluded from this particular exercise due a lack of quarterly data on demand components of GDP.
|
|
Countries included: Australia, Brazil, Canada, Euro Area, Indonesia, Japan, Korea, Mexico, Sweden, Switzerland, and the United Kingdom.
Source: FRB staff calculations.
Figure 7 compares the out-of-sample forecast for aggregate average import growth from 2011:Q1 to 2016:Q1 implied by the "components" model (the green line) to the actual growth of imports (the blue line) and those implied by the real GDP model (the red line). Both models perform fairly well at capturing the overall trend of declining import growth, except in very recent quarters. However, although the components model does well for some individual countries, relative to the real GDP model, focusing only on these expenditure components does not provide much additional explanatory power in the aggregate.
We still believe the intuition behind the "components" model described earlier is valid and would thus note an important caveat with respect to our empirical results. It is worth highlighting that the OECD-based component data are still very highly aggregated. For most economies, we do not have sufficiently disaggregated data at the quarterly frequency to distinguish between durable and non-durable consumption, or between tangible and intangible investment, which could provide a better test of the "components" explanation. Nevertheless, our results are suggestive that the components model may not fully explain the slowdown in world trade relative to world GDP.
The Role of Trade Liberalization
|
|
Note: Colors in key correspond with each bar segment, in order from left to right.
Source: Bown and Crowley (2016).
|
|
Note: Colors in key correspond with each bar segment, in order from left to right.
Source: Haver Analytics.
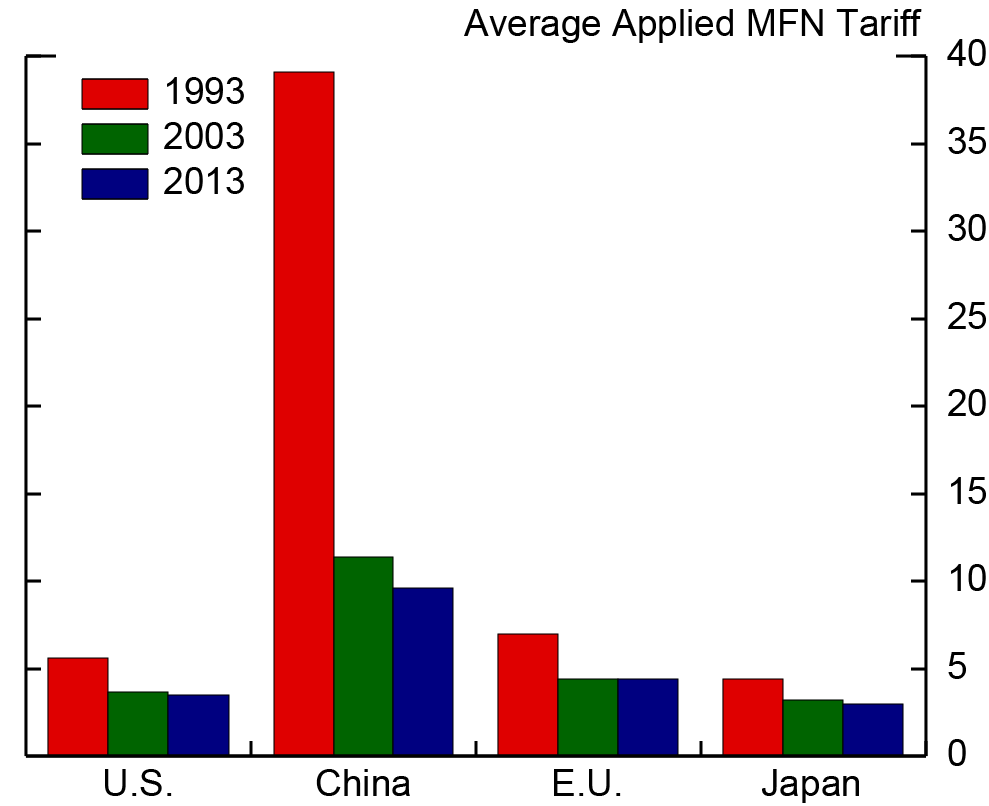
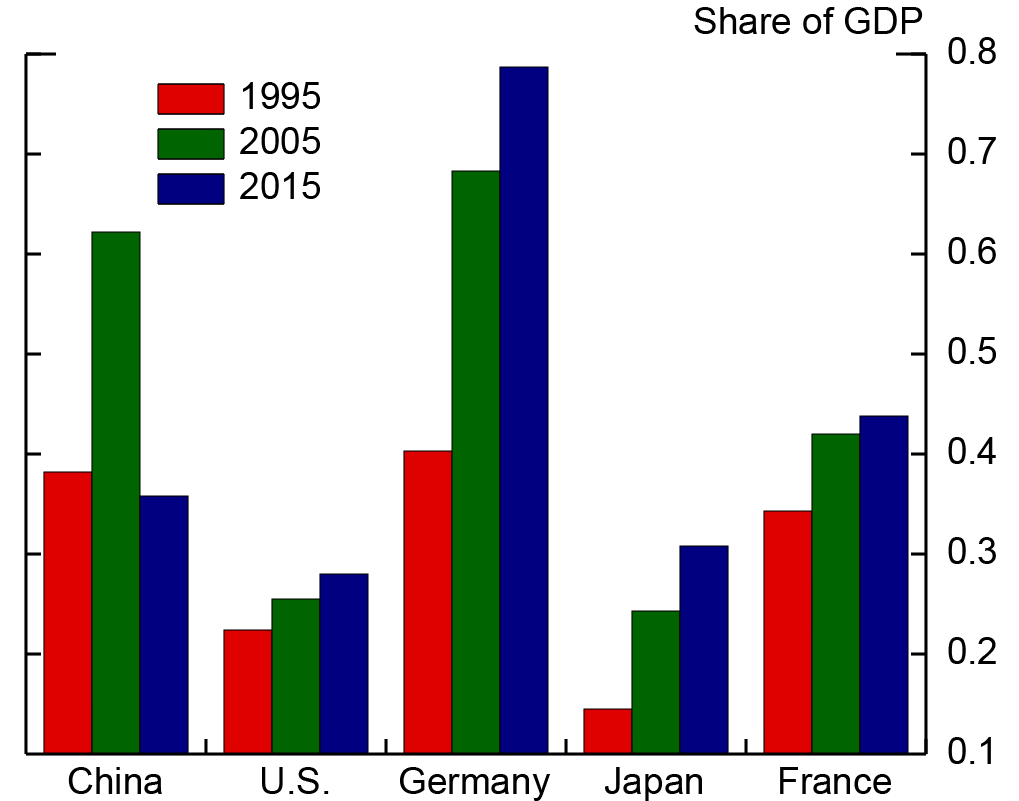
Turning to more structural-based explanations, a deceleration in the pace of trade liberalization since the early 2000s is a likely contributor to the trade slowdown. Trade barriers fell appreciably during the 1990s and early 2000s, and the pace of opening has slowed significantly since then. A number of events led to major increases in trade openness in those two decades, including the signing of NAFTA, the expiration of the Multi-Fiber Agreement, the Uruguay round of trade negotiations coming into force, China’s receiving of Permanent Normal Trading Relations status with the U.S., and China’s entry into the WTO. Tariff reductions mainly occurred between 1993 and 2003, as shown in Figure 8, and trade openness for major trading countries (measured as exports plus imports over GDP, in Figure 9) has not increased much since 2005. Although the world remains quite open, with the growth in openness decelerating, and with the literature implying a full adjustment to a permanent lowering of trade costs typically taking 5-10 years it is natural that the trade to GDP ratio would flatten5.
Slow Growth in Supply Chain Formation

|
|
Source: Authors' estimates based on data from World Input-Output Database, 2016 and for pre-2000, data from World Input-Output Database, 2013. Coverage of countries and industries differs slightly for pre-2000 period.
The ongoing evolution of supply chains is another structural change that has likely led to slower trade growth. An important part of the major expansion in trade flows in the 1990s and 2000s was the increased splitting of production across international borders, leading to more trade for any given value of final production. This can be seen in Figure 10, which uses world input-output tables to measure global value chain participation by summing the amount of foreign value-added in total world exports and expressing it as a share of world exports. Consistent with the idea that value chain expansion has moderated in recent years, this measure has remained flat or declined since 2011, mirroring the overall trade slowdown. Other evidence also suggests that this trend has slowed: As shown in Figure 11, Chinese processing trade (goods that have been imported into China just to be exported without major change) has been declining noticeably in recent years. For these reasons, we find the slowing of production splitting across countries to be a likely contributor to the trade slowdown.
The Role of China

|
|
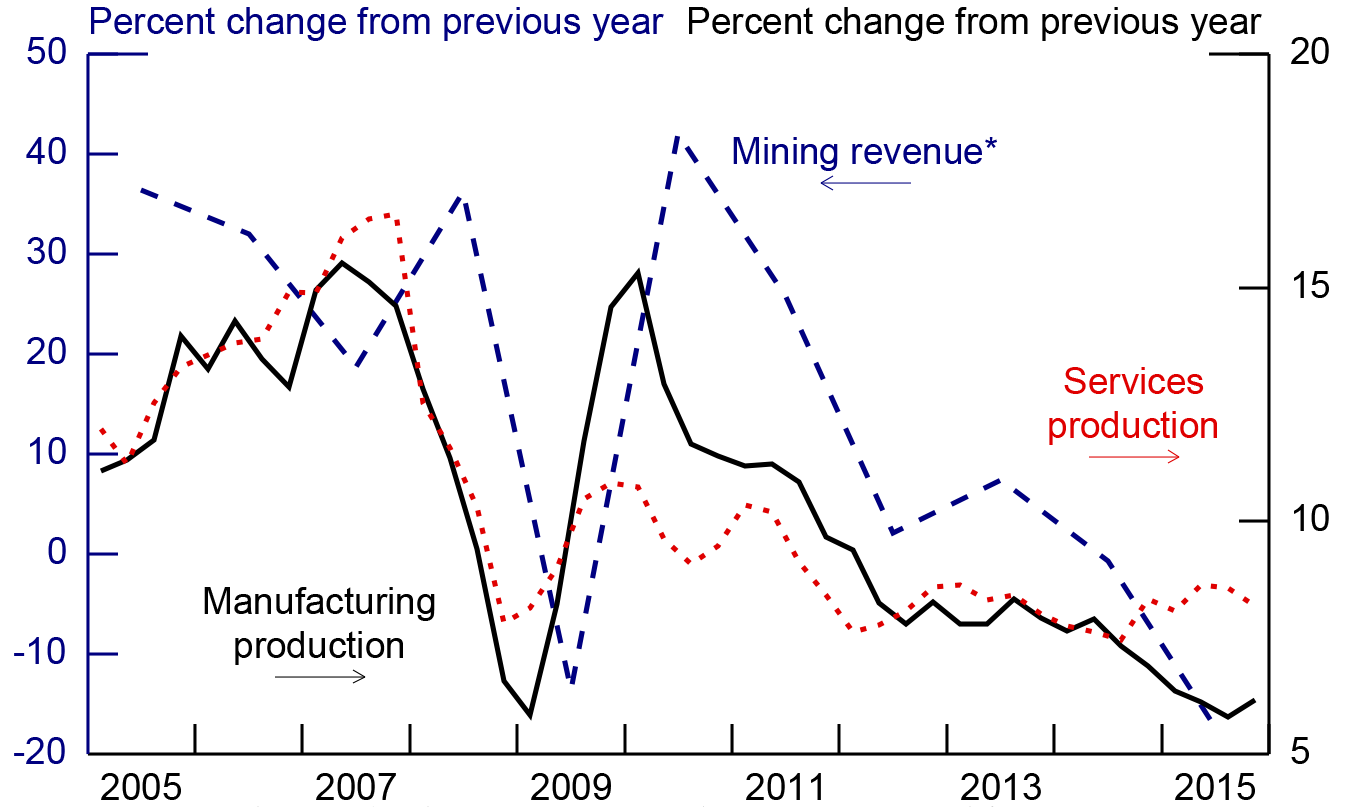
* Includes petroleum & natural gas, ferrous metals, non-ferrous metals, and non-metal minerals.
Source: Haver Analytics.
In addition to the changing pattern of processing trade, which might be a world-wide phenomenon, other structural changes more specific to China are occurring, which are also slowing Chinese trade Figure 12 shows that China has been concentrating more production domestically; imports of parts and components have declined steadily as a share of exports, suggesting increased substitution towards domestic inputs. Figure 13 shows that manufacturing and mining, the most import-intensive sectors of the Chinese economy, are also those where output has fallen fastest. Also, slow but steady progress in increased consumption and services as a share of GDP is powering the Chinese economy towards domestic demand and away from exports6. Given the importance of Chinese trade in world trade, it is plausible that these China-specific structural changes have contributed independently to the world trade slowdown.
Conclusion
In sum, no one explanation accounts for the entire slowdown in world trade in recent years. Structural factors, such as a deceleration in the speed of trade openness, the slowing of supply chain fragmentation, structural changes in Chinese trade, as well as cyclical factors, such as the weakness in the trade-oriented components of aggregate demand are all likely contributors. With several structural changes playing an important role in the trade slowdown, the slowdown has direct implications for growth going forward. Given the persistence of at least some of these contributing factors, the recent experience likely reflects to a large extent a new normal, and we do not foresee a return to the rapid pace of trade growth observed in the years prior to the GFC any time soon.
References
European Central Bank (2016) "Understanding the weakness in global trade. What is the new normal?" ECB Occasional Paper Series No 178, September 2016.
Hoekman (2015) "The Global Trade Slowdown: A New Normal?" VoxEU.org eBook, June 2015.
International Chamber of Commerce (2015) "Rethinking Trade and Finance: An ICC Private Sector Development Perspective". October 2015.
IMF (2016) "Global Trade: What’s behind the Slowdown?" IMF World Economic Outlook, Chapter 2, October 2016.
Levchenko, Andrei A., Logan T Lewis & Linda L Tesar (2010). "The Collapse of International Trade during the 2008–09 Crisis: In Search of the Smoking Gun," IMF Economic Review, Palgrave Macmillan, vol. 58(2), pages 214-253, December.
OECD (2016) "Cardiac Arrest of Dizzy Spell: Why Is World Trade So Weak and What Can Policy Do About it?" OECD Working Party No. 3, September 2016.
Ruhl, Kim J. (2008) "The International Elasticity Puzzle". Manuscript.
Timmer, Marcel P., Dietzenbacher, Erik, Los, Bart, Stehrer, Robert and de Vries, Gaaitzen J. (2015), "An Illustrated User Guide to the World InputOutput Database: the Case of Global Automotive Production", Review of International Economics., 23: 575605
WITS (2010) "Imports, Exports and Mirror Data with UN COMTRADE" Retrieved October 6, 2016. http://wits.worldbank.org/wits/wits/witshelp/Content/Data_Retrieval/T/Intro/B2.Imports_Exports_and_Mirror.htm 
World Input-Output Database, 2016 and 2013 releases. http://www.wiod.org/home . Accessed November 8, 2016.
* The views expressed in this paper are solely those of the authors and should not be interpreted as reflecting the view of the Board of Governors or the staff of the Federal Reserve System. Return to text
1. In principle, data on either world exports or world imports could be used to analyze global trade patterns. The two differ in practice, and in this note, we use world import data, which are generally regarded as more reliable at the country level due to import tariff collection. See also WITS (2010). Return to text
2. Throughout we use the term AFEs for the world’s major advanced economies, excluding the United States. Return to text
3. It could be argued that even though we are focusing on real trade and not nominal trade, the decline in commodity prices could explain some of the weakness in world real trade if imports of commodity exporters were restrained by more than imports of commodity importers were enhanced as a result of the lower commodity prices. However with commodity prices having turned down only since mid-2014, this mechanism is unlikely to help explain the protracted weakness back to 2011. In addition, another possible explanation is a tightening of trade finance conditions but survey evidence from the International Chamber of Commerce does not suggest any prolonged major changes post-GFC in the availability of trade credit. In 2015, a majority of respondents indicated an increase in trade finance activity. (ICC 2015 p.37) Return to text
4. The "components" explanation for changes in trade relative to GDP is highlighted by several authors in a VoxEU e-book, "The Global Trade Slowdown: A New Normal?" June 21, 2015. See also ECB (2016), IMF (2016), and OECD (2016). Return to text
5. See Ruhl (2008) for a summary of studies measuring the long-run elasticity of trade with respect to trade costs. Return to text
6. Shifting to domestic demand does not necessarily imply a slowdown in trade. For example, the decline in "parts and components" imports could be more than offset by a rise in consumption imports as domestic demand rises. China has not, at least yet, reached such a point, as the Comtrade measure of Chinese consumer imports remains fairly low as a share of overall Chinese consumption. Return to text
Please cite as:
Lewis, Logan, and Ryan Monarch (2016). "Causes of the Global Trade Slowdown," IFDP Notes. Washington: Board of Governors of the Federal Reserve System, November 10, 2016. https://doi.org/10.17016/2573-2129.25
Disclaimer: IFDP Notes are articles in which Board economists offer their own views and present analysis on a range of topics in economics and finance. These articles are shorter and less technically oriented than IFDP Working Papers.