
IFDP Notes
 Print
PrintApril 11, 2016
Measuring Monetary Policy Uncertainty: The Federal Reserve, January 1985-January 2016
Lucas Husted, John Rogers, and Bo Sun*
Data Appendix: Excel (.xlsx) | HTML
We construct a news-based index of monetary policy uncertainty (MPU) to capture the degree of uncertainty the public perceives about Federal Reserve policy actions and their consequences. We follow the news-based search approach in Baker, Bloom, and Davis (2015). In this note we focus on the U.S. over the period January 1985 to January 2016, but have also constructed measures over a longer time period and for other central banks/economies. After discussing our news-based MPU index itself, we compare it to several potentially-related measures, including survey-based and market-based measures of uncertainty, the VIX, and the Baker-Bloom-Davis uncertainty measures. As documented below, our index spikes at several points in the sample. Uncertainty was notably high during the financial market turmoil prior to the October 2015 FOMC meeting, but quickly dissipated before December 2015 when the Fed actually lifted the interest rate off the zero bound. We discuss general implications of our findings.
Our approach to constructing the MPU index is to track the frequency of newspaper articles related to monetary policy uncertainty. The underlying identification assumption is that increased newspaper coverage indicates that the public perceives more uncertainty about central bank actions. Using the ProQuest Newsstand and historical archives as our primary source, we construct the index by searching for keywords related to monetary policy uncertainty in the New York Times, Wall Street Journal, and Washington Post. In particular, we search for articles containing the triple of (i) "uncertainty" or "uncertain," (ii) "monetary policy(ies)" or "interest rate(s)" or "Federal fund(s) rate" or "Fed fund(s) rate," and (iii) "Federal Reserve" or "the Fed" or "Federal Open Market Committee" or "FOMC". We do this for every day in the year.
As detailed in Appendix A, to control for the changing volume of total news articles over time and the possibility that some newspapers naturally cover monetary policy more than others, we first divide the raw count of identified articles by the total number of news articles mentioning the Federal Reserve (or more precisely, any of the words in (iii) above) for each newspaper in a given period. The share of articles is subsequently normalized to have a unit standard deviation for each newspaper over the sample period. Our monetary policy index is aggregated by summing the resulting series and scaling them to have a mean of 100 over the sample.1
We aggregate our daily index into buckets based on the FOMC calendar. Specifically, the first day of each bucket is the day following the previous FOMC meeting, and the last day is the date of the meeting in the current period, with each value reported on the date of the meeting.
We display our baseline MPU index in Figure 1. While there is no evident drift over time, the index spikes around the time of Black Monday, the September 11 attacks, the March 2003 invasion of Iraq, the lead-up to the global financial crisis and announcements of QE I and II, the Taper Tantrum, and prior to the October 2015 FOMC meeting. Our index thus fluctuates substantially during the period the Federal Funds rate was at the lower bound.2
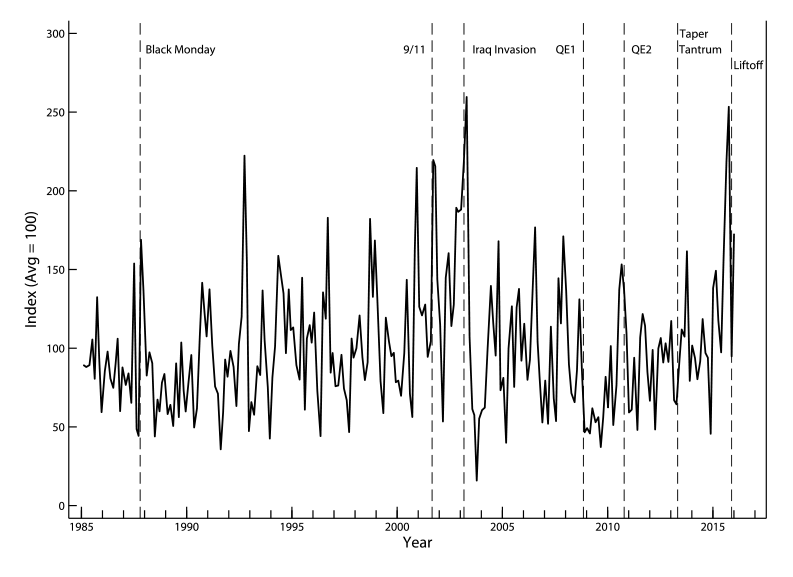
We make a special note of the movement of our MPU index in the second half of 2015. As the Federal Reserve poised itself to lift off from the zero interest rate policy in place since 2008, the intentions of monetary policymakers and the effects of their actions once again faced increased scrutiny. Worries over China's economic slowdown, crashing oil prices and stock market losses generated heightened uncertainty over the timing of liftoff. The resulting uncertainty regarding the timing and path of policy rate normalization is reflected in our MPU index rising noticeably prior to the October 2015 meeting. Monetary policy uncertainty quickly dissipated before the December 2015 meeting when the Fed actually raised the interest rate, strongly suggesting that Fed communication strategy was at least somewhat effective. The Financial Times proclaimed on the day after the October FOMC meeting, "Fed Speaks Plainer English on Rates: A clearer marker has been laid down for a December increase." The baseline index rose again prior to the January 2016 FOMC meeting, the final observation of the sample, reflecting uncertainty about the future path of policy rate normalization.
Index Construction Sensitivity
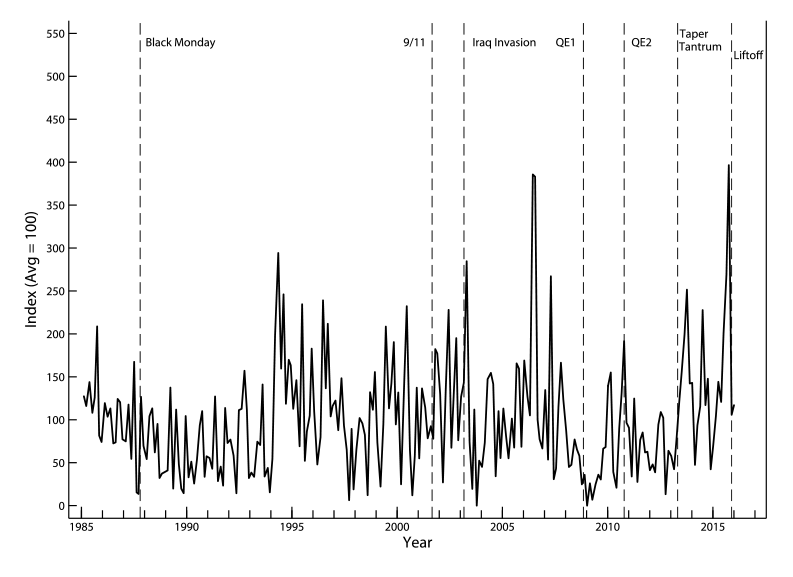
We examine the sensitivity of our baseline index by considering several adjustments to its construction. In the most noteworthy refinement, we narrow our search to articles in which the word uncertainty/uncertainties is in close proximity to Federal Reserve or monetary policy. Specifically, we restrict "uncertainty" or "uncertainties" to be within either 5, 10, or 20 words of the phrase "Federal Reserve" or "The Fed" or "monetary policy."
Figure 2 shows that the index resulting from a 10 word proximity refinement comoves with our benchmark index with a correlation of 0.64. Examining episodic movements in the indexes, we see some differences and many similarities. Notably, these indexes (and all of those we constructed) display a sharp rise before the October 2015 FOMC meeting, rapid decline just after it, and rebound prior to the January 2016 meeting. The proximity index features a larger increase prior to the October 2015 meeting, which again dissipated quickly before the December meeting, but in this case remained essentially unchanged from then through the January 2016 meeting. In addition, in all of our indexes monetary policy uncertainty spiked and remained elevated for several months during the Taper Tantrum in the summer of 2013. Furthermore, uncertainty was rising in the months leading up to the announcement of QE II but declined immediately after. Uncertainty also declined upon the announcement of QE I, but from a higher or lower (and already-declining) initial level depending on whether or not the proximity search is utilized.
Although one is tempted to seek immediate explanations for various spikes, it is the subject of our full paper to assess the determinants of the entire series itself and not just the spikes. There we analyze the relationship between MPU and several institutional and procedural measures related to FOMC actions: dissenting votes, member turnover, "FOMC-revealed uncertainty", FOMC transparency, and FOMC statement "persistence" (Meade and Acosta, 2015). We find an important association between FOMC communications and monetary policy uncertainty.
In order to better understand the trade-offs associated with using the proximity refinement, we extracted and read several articles. The proximity search does filter out articles that mention all the keywords but do not really discuss monetary policy uncertainty per se. For example, in articles that mention monetary policy or interest rate, "uncertainty" shows up in sentences like the following: "Concerns over Europe have also intensified, as political upheaval has bred uncertainty over whether the euro zone will be able to implement controversial austerity measures." The trade-off, however, is that the proximity search misses articles that discuss issues related to monetary policy uncertainty but have a somewhat large gap between keywords. With our 10-word search, for example, an article with the following sentence was not counted: "That the Fed can, if it chooses, intervene without limit in any credit market--not only mortgage-backed securities but also securities backed by automobile loans or student loans--creates more uncertainty and raises questions about why an independent agency of government should have such power."
We conclude from these readings that both the baseline and proximity searches cover the same four categories of articles listed in Appendix A. The difference is that by virtue of being more refined and restrictive, the proximity search has smaller type II error but greater type I error relative to the baseline strategy, as it filters out more of both "false" articles and "correct" articles.
We now turn to evaluate our MPU index in a number of ways. First, we show a strong link between our index and direct measures of monetary policy uncertainty constructed using survey data. Second, we show that our index closely tracks a market-based measure of monetary policy uncertainty, swaptions' implied volatility, before policy rates hit the zero bound, but that significant divergences appear afterward. These differences reveal that there is additional information embedded in our MPU index.3 Compared to these measures based on survey data and market volatility, our measure therefore has the advantage of (1) being available in countries and during time periods when market or survey data are not available and (2) better capturing uncertainty in periods with unconventional monetary policy when the policy rate is at or near the lower bound. We finish by comparing our measure of uncertainty to the Baker-Bloom-Davis (BBD) measures and by displaying how our index moves before and after the typical FOMC meeting.
Comparison to Survey-based index
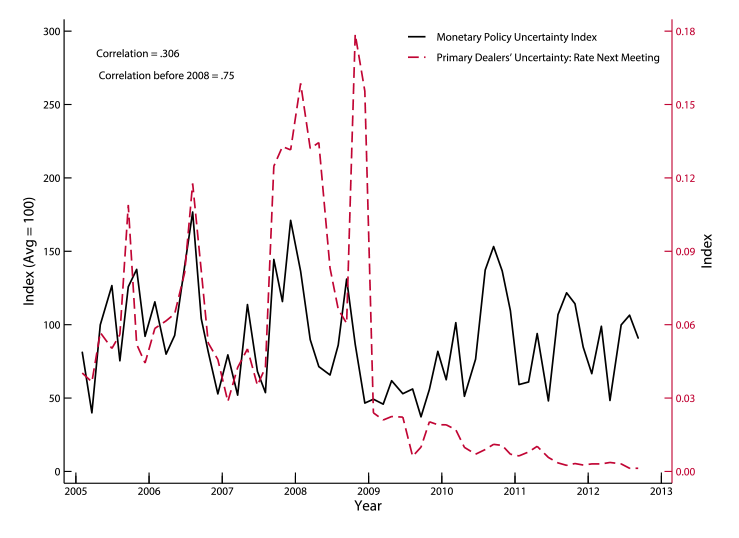
The Survey of Primary Dealers is conducted by the Federal Reserve Bank of New York one week before each FOMC meeting. The Survey is available beginning in 2004, and has the appealing feature of asking respondents to directly report both their forecasted policy rates and their forecast uncertainty. That is, respondents are asked to assign a probability to each of a number of pre-specified intervals over which their forecast may fall. Uncertainty is thus captured by the distribution of the possibilities a respondent attaches to the different possible outcomes of forecasted monetary policy actions. We use the dealers' responses to the following question, over the time period for which this question was relevant and hence asked (i.e., through late 2012): "Of the possible outcomes below (that is, -50 bps, -25 bps, +0 bps, +25 bps, +50 bps), please indicate the percent chance you attach to the indicated policy move at each of the next three FOMC meetings". To gauge the respondents' perceived uncertainty regarding monetary policy, we calculate the average within-respondent standard deviation of forecasted policy rates. Appendix B contains additional details of the Survey questions and our measure.
Figure 3 shows that our baseline MPU index tracks the survey-based uncertainty measure closely prior to 2008 when the effective zero bound was reached. This is reassuring as it indicates that our news-based index is informative about the uncertainty related to monetary policy that is perceived by the public. During the pre-ZLB sample, our MPU index is correlated with survey-based uncertainty at 0.75 for the one-meeting ahead forecast, the case displayed in the figure, and progressively slightly less for each of the next two meeting-ahead forecasts. This suggests that news-based search results capture the intensity of concerns over both near-term and longer-term horizons, with a relatively stronger focus on the near-term actions.4
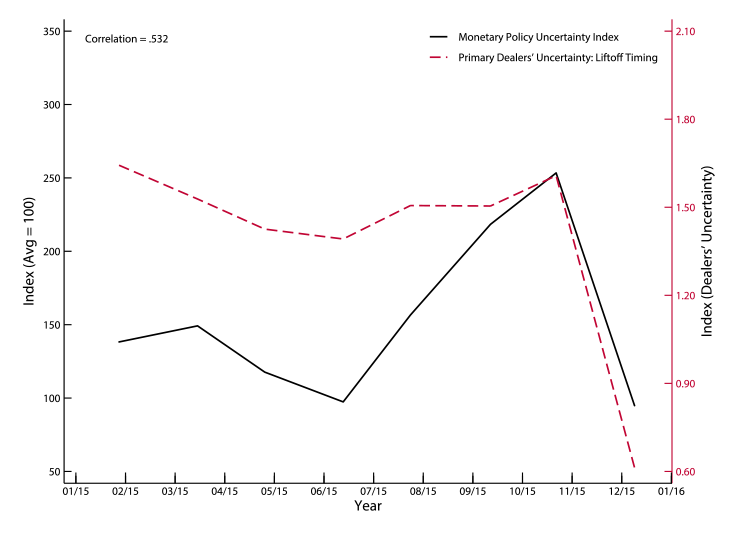
In the months preceding the actual liftoff in December 2015, it was apparent that a major component of monetary policy uncertainty centered on the timing of liftoff. We construct from the Primary Dealers Survey a measure of liftoff uncertainty in a manner similar to the interest rate uncertainty measure shown in Figure 3. The Survey began asking respondents to judge the likelihood of liftoff over a pre-defined horizon consisting of 6-11 time periods, starting in April 2010. We proxy dealers' uncertainty regarding liftoff using the following probability distributions: the expected value given to each distribution is simply the number of meetings ahead that the survey respondent thinks liftoff will occur. While this measure is interesting over the full sample of its existence, it is really only useful for our analysis after December 2014, when the pre-specified bins remained consistent.5 As shown in Figure 4, our MPU index moves quite closely with Primary Dealers' liftoff uncertainty during 2015, consistent with the notion that monetary policy uncertainty more generally was primarily about expectations concerning the timing of liftoff.
Comparison to market-based indicators
We compare our baseline MPU index with market-based indicators of monetary policy uncertainty. First, in Figure 5 we display our measure against the implied volatility of options on one-year swap rates (swaptions), taken from Carlston and Ochoa (2016). Note that as the short-term policy rate approached zero the market-based indicator fell quickly and remained extremely low during the ZLB period. This suggests that the market-based measures do not fully capture monetary policy uncertainty in a broad sense. Episodes such as the Taper Tantrum in 2013 and financial market turmoil prior to the October 2015 FOMC meeting suggest that uncertainty regarding the timing and pace of policy rate normalization was far from zero. Our MPU measure is more strongly correlated with one-year swaption volatility, shown above, than the ten-year (not shown), reinforcing the notion that our measure captures more of the near-term course of policy actions.
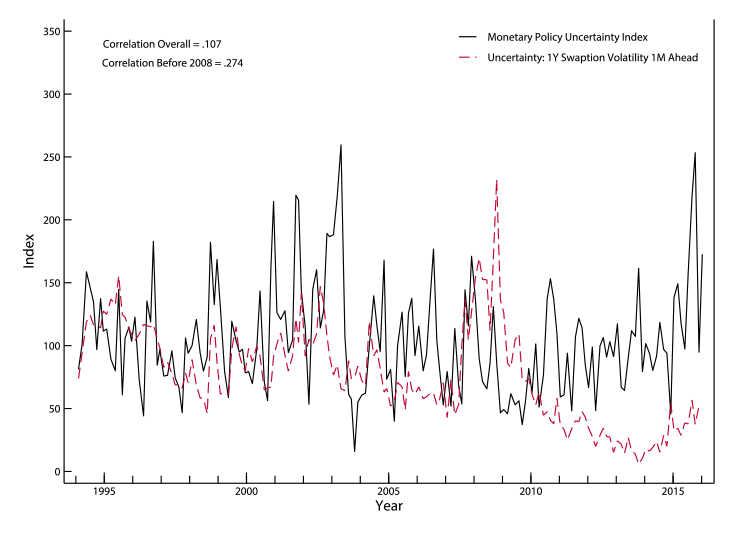
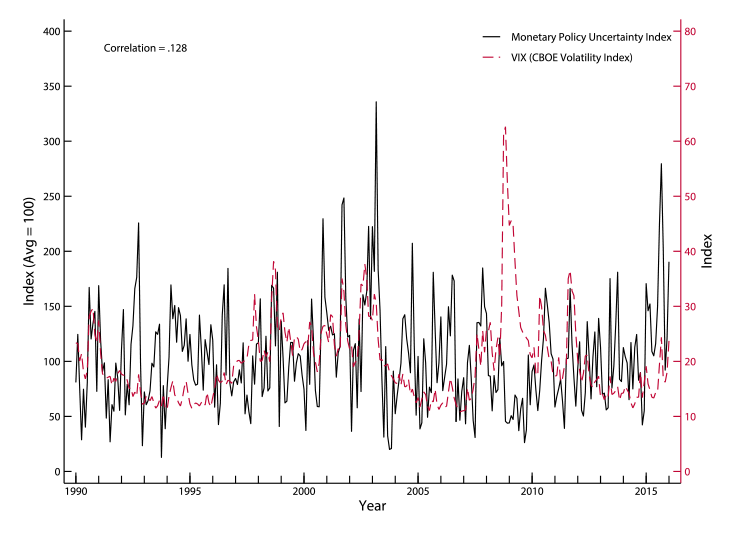
Figure 6 displays our index at a monthly frequency against the VIX, the stock market options-based implied volatility measure that has been widely used as a proxy for uncertainty (Bloom, 2009). As seen in the figure, our measure of monetary policy uncertainty is positively correlated with the VIX, but only weakly so.
Finally, we note that conceptual differences exist between our measure and the market-based indicators. In theory, the latter reflect the average perception of individuals participating in options markets. Our news-based index reflects the average opinion of people reading newspapers (assuming that newspapers reflect the readership). Since relatively few households participate in the options markets, the prices in these markets may not be particularly representative. Second, in market-based indicators the perceived degree of uncertainty is contaminated with time-varying risk aversion and state-dependent marginal utility. The market-based measures are presumed to reflect the price individuals are willing to pay for insurance against future policy rate fluctuations. Willingness to substitute resources from one possible future to another depends on the relative scarcity of resources in those futures. Therefore, a household may be willing to pay a lot to insure against the possibility of a rate increase even if the household sees the outcome as highly unlikely. Although we acknowledge (and try to control for) the potential state-dependency in newspaper coverage of central bank actions, we believe that our index is a preferable measure of monetary policy uncertainty, at least over the sample period (containing the ZLB) and for the frequency (FOMC meeting intervals) we study.
Comparison to Baker-Bloom-Davis' EPU and MPU
Our MPU measure is constructed following a methodology similar to Baker, Bloom, and Davis' (2015) monthly measures of Economic Policy Uncertainty (EPU), but as shown in Figure 7 the two indexes are only weakly correlated. For example, EPU experienced substantial volatility in the years during and immediately after the Great Recession, while MPU remained subdued--arguably in part due to the FOMC's enhanced communication strategy. The difference is also evident in several other historical episodes, such as the 2012 Fiscal Cliff Dispute when EPU reached a sample period high. While changes in financial regulation, national security threats or fiscal policy shocks generate uncertainty about government policy overall, they do not necessarily have direct implications for monetary policy.
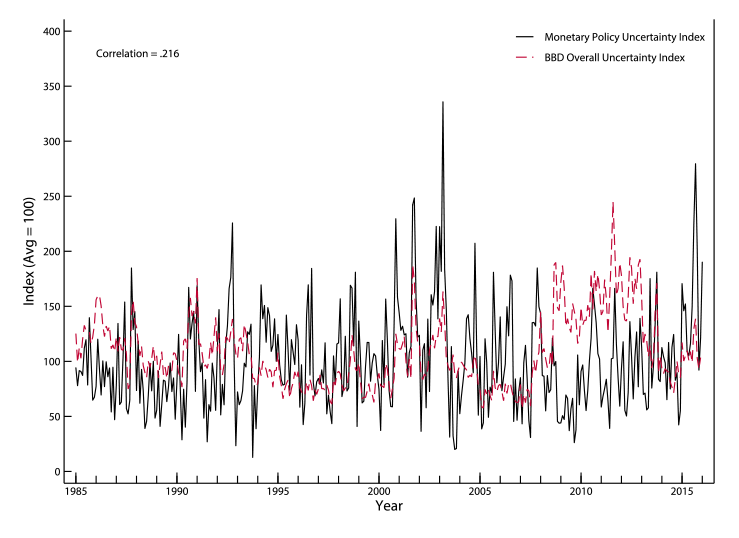
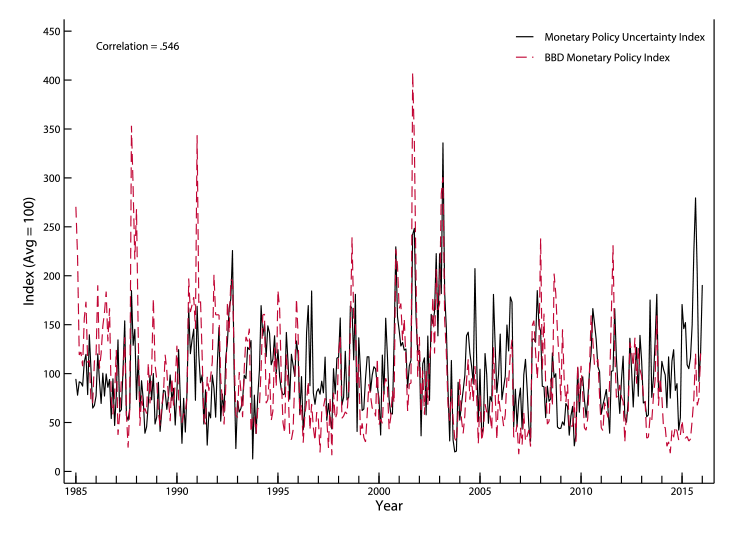
In Figure 8, we compare our baseline MPU with the BBD Monetary Policy sub-index of EPU (also available only at a monthly frequency). As expected, our index is considerably more correlated with their monetary policy sub-index than with their overall EPU index (.546 versus .216). However, their monetary policy sub-index has more pronounced spike-ups than ours early in the sample and reaches different levels compared to ours since 2014. The Baker-Bloom-Davis measure remained well below average throughout 2014 and into 2015, and is subdued relative to our index during the October 2015, December 2015, and January 2016 FOMC meeting intervals (though the see-saw pattern is largely the same as ours). As described in Appendix A, compared to our MPU, Baker et al. (2015) include a considerably broader set of words that potentially include discussions of other central banks or Fed chairman, and do not divide the total number of identified articles by the number mentioning "Federal Reserve" (broadly). This could explain some of the differences we highlight.
Movements in MPU around FOMC days
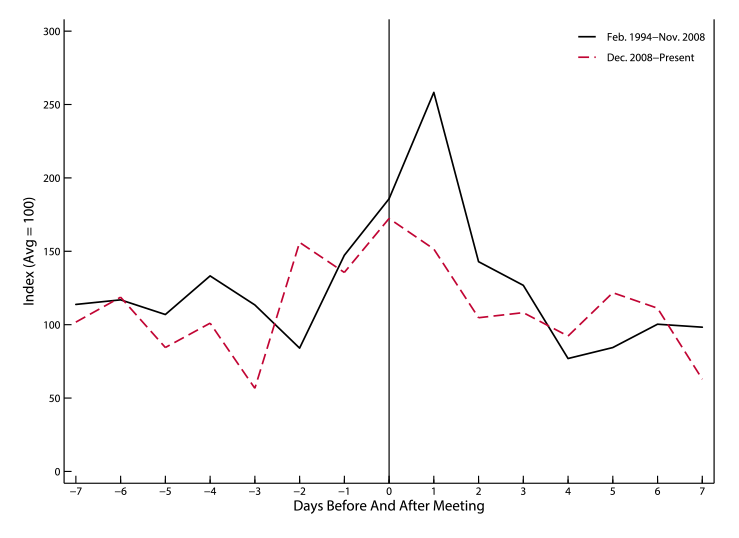
To conclude, we examine how the MPU index evolves on the days before and after FOMC meetings and how its behavior changed at the time the policy rate reached the lower bound and the FOMC relied increasingly on forward guidance. It is natural to expect that monetary policy uncertainty would decline after the FOMC meets, assuming that policy actions (or inactions) undertaken and the associated explanations help mitigate near-term uncertainty about monetary policy. Furthermore, it is logical that enhanced FOMC communication policies will affect uncertainty. These considerations lead us to examine the level of monetary policy uncertainty around FOMC meetings in two sub-periods: February 1994-November 2008 and December 2008-January 2016.
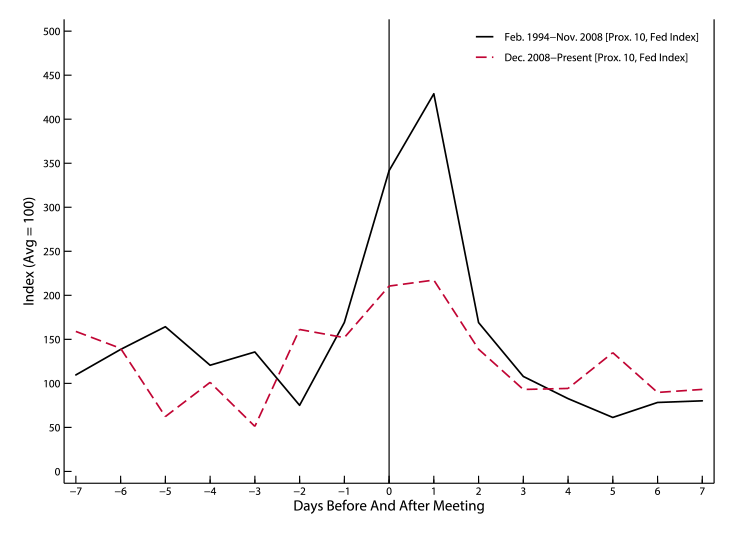
The results using the baseline index are depicted in Figure 9. In both sub-periods, there is a rise in MPU in the days prior to FOMC meetings. In the earlier sub-period, MPU peaks on the day after the FOMC meeting, the first day of newspaper coverage. Comparing the two lines, we see that after the FOMC began to rely increasingly on forward guidance, this rise in MPU is greatly muted and MPU peaks one day sooner. The evidence is thus consistent with the notion that enhanced communications policies helped ease uncertainty regarding monetary policy by building in expectations of both the near-term and longer-term course of monetary policy. The results using the MPU index constructed with the proximity refinement are similar (Figure 10).
References
Baker, Scott, Nicholas Bloom, and Steven J. Davis, 2015. "Measuring Economic Policy Uncertainty," NBER Working Paper No. 21633.
Bernanke, Ben S, 2015. The Courage to Act: A Memoir of a Crisis and its Aftermath. W.W. Norton and Company, New York.
Bloom, Nicholas, 2009. "The Impact of Uncertainty Shocks," Econometrica, 77(3), pp. 623-685.
Carlston, Benjamin, and Marcelo Ochoa, 2016. "Macroeconomic Announcements and Investors Beliefs at the Zero Lower Bound," working paper, Federal Reserve Board.
Meade, Ellen E, and Miguel Acosta, 2015. "Hanging on every word: Semantic analysis of the FOMC's postmeeting statement," FEDS Notes, Federal Reserve Board.
Appendix
A. Baseline Index Construction
The MPU index reflects automated text-search results for the newsstand edition of three major newspapers: New York Times, Wall Street Journal, and Washington Post. We use the ProQuest Newsstand database to search the electronic archives of each newspaper from January 1985 to January 2016 for terms related to monetary policy uncertainty. In particular, the search identifies articles containing the triple of (i) "uncertainty" or "uncertain," (ii) "monetary policy" or "interest rate" or "Federal funds rate" or "Fed fund rate," and (iii) "Federal Reserve" or "Fed" or "Federal Open Market Committee" or "FOMC". Based on these search criteria, we count in each newspaper how many articles contained the search terms above every day.
To deal with changing volume of newspapers over time, we normalize as follows. First, we divide, for each newspaper, in every inter-meeting period, the raw count of articles related to monetary policy uncertainty by the total article count mentioning the Fed. For each newspaper i in period t, we calculate the share of articles containing monetary policy uncertainty terms as
$$$$n(i,t)=\frac{\#\text{mpu_articles}(i,t)}{\#\text{Fed_articles}(i,t)}.$$$$
We then normalize the share of articles so that, for each newspaper, the resulting series has a standard error of one over the sample period. This normalization controls for the possibility that different newspapers mention monetary policy uncertainty with different frequency over time. That is, we denote the normalized share of articles using
$$$$nn(i,t)= \frac{n(i,t)}{stdev(n(i,1985:2015))}.$$$$
Finally, we sum the nn(i) series across newspapers and scale them so that the average value is 100 over the sample period. The scaling produces our monetary policy uncertainty index:
$$$$MPU(t)=\left[ \frac{\sum_{i} nn(t)}{avg(\sum_{i} nn(1985:2015))} \right] \times 100.$$$$
A human reading of a sample of the articles suggests that the news-based approach used to construct the index can provide a reasonable indicator of monetary policy uncertainty. Newspapers typically cite uncertainties related to monetary policy in one of the following cases:
- Newspaper articles comment on the uncertainty resulting from Federal Reserve actions. For example, "FOMC reserve injection during the day is reversed at the overnight closing time to achieve an artificial 5.25%. This target Fed funds chicanery leaves the financial market with considerable uncertainty."
- Newspaper articles discuss the implications of uncertainty regarding the Federal Reserve actions for the real economy and stock markets. For example, "Traders last week blamed uncertainty about the FOMC for the sharp ups and downs on the New York Stock Exchange."
- Newspaper articles analyze uncertainties at home and abroad that affect monetary policy. For example, "Given the inherent uncertainty about future developments, policy actions often importantly depend on the flow of new information and the FOMC's judgment about its implications." "There are significant uncertainties about the Fed moving to boost the cost of borrowing in the U.S. as China's economy has run into trouble and as financial markets have suffered significant losses."
- Newspaper articles quote policy-makers, economists, political leaders, or industry experts who refer to uncertainties in relation to monetary policy in their speeches or interviews. For example, "The Federal Open Market Committee, the central bank's top policymaking group, blamed the slowdown in growth largely on falling stock prices and `heightened uncertainty related to problems in corporate reporting and governance'."
Our index construction differs from the monetary policy sub-index in Baker et al. (2015) along three main dimensions. First, we search for a different set of key words that we believe feature a more refined focus on monetary policy in the U.S.. Baker et al. (2015) include a considerably broader set of words in a string of "or"s that potentially include discussions of other central banks or Fed chairman, for example, "Bernanke", "Volker", "Greenspan", "central bank", "Fed chairman", "Fed chair", "European Central Bank", "ECB", "Bank of England", "Bank of Japan", "BOJ", "Bank of China", "Bundesbank", "Bank of France", "Bank of Italy". Second, our daily index is aggregated into inter-meeting intervals (as well as monthly levels), while Baker et al. (2015) constructs a monthly measure. Since FOMC decisions are made on pre-specified meeting dates, our index allows us to incorporate information arrival following each FOMC meeting and capture any effects that FOMC (in)actions have on the uncertainty the public perceives (see Figure 9). Third, BBD do not divide by the number of articles mentioning the Fed.
B. The Survey of Primary Dealers index details
For each dealer $$i$$ in period $$t$$, we use $$Er(i,t)$$ to denote the expected value of the interest rate at the upcoming meeting, calculated as the policy rate in place prior to the survey $$r(t-1)$$ plus the expected change in the policy rate computed from the possibilities each dealer i assigned to the pre-specified bins
$$(b=\{1,\cdot\cdot\cdot, n\}):$$
$$$$Er(i,t) = r(t-1)+ \sum_{b=1}^{n}Pr(b,i)d(b)$$$$
where d(b) denotes the value of a possible rate change specified in each bin, for example, 0, +/- 25 bps, or +/- 50 bps; and $$Pr(b,i)$$ is the probability dealer $$i$$ assigned to each bin $$b$$.
For the policy rate set two meetings ahead, we calculate dealer i's expected rate as his own expected rate at the upcoming meeting plus the expected change in the policy rate two meetings ahead computed from the bins. That is, we replace the actual policy rate prior to the survey $$r(t-1)$$ by $$Er(i,t)$$ in the expectation calculation. By the same token, we use dealer i's own expected policy rate two meetings ahead as the basis to compute his expectation for three meetings ahead.
The degree of uncertainty perceived by dealer $$i$$ for $$m={1,2,3}$$ meetings ahead, denoted by $$U(i,m)$$, is calculated as the standard deviation of his forecasted rate for $$m$$ meetings ahead. The uncertainty measure in period $$t$$ for $$m$$ meetings ahead is then the average of all the uncertainty measures for the dealers $$m$$ meetings ahead. The disagreement measure for $$m$$ meetings ahead is the standard deviation of the expected policy rate $$m$$ meetings ahead among the dealers.
Finally, there is time variation in the survey questions. There are questions about the target interest rate only from February 2005 through September 2012. As the Fed Funds rate reached the ZLB and forward guidance ramped up, uncertainty about the interest rate fell to zero quickly. This question was dropped after September 2012 presumably because it did not provide useful information during the ZLB. In addition, the possible bins given in the survey question evolve with the level of the target policy rate. For example, at the beginning of the sample when a reduction in the target rate was unlikely, the possible bins were restricted to a change of 0, an increase of 25 basis points, and an increase of 50 basis points. Such time variation in the bins should not affect the consistency of our measure because we assume that survey questions are tailored to real possibilities. That is, the probability associated with, say a decrease of 25 basis points for any respondent in this period would be approximately zero anyway, so the fact that they were not asked this does not change the expected value or dispersion of the perceived target. The survey question appropriately added increasingly drastic negative changes in the target rate during the onset of the financial crisis. Finally, the survey question changed format in 2009. Instead of asking about the likelihood of an increase or decrease of a certain number of basis points from the current target, the survey asked about the likelihood of maintaining a certain target rate (0-25 bps, 25 bps, 50 bps, 75 bps). Using the mean/median of 0-25 bps as the point forecast for the first bin, it is straightforward to see that the former question and the updated question for the ZLB are mathematically equivalent.
* This memo is culled from our forthcoming paper "Monetary Policy Uncertainty". We thank Miguel Acosta, Nils Gornemann, Joe Gruber, Matteo Iacoviello, Illenin Kondo, Ellen Meade, Marcelo Ochoa, Marius Rodriguez, Chiara Scotti, Zhaogong Song, Min Wei, Jonathan Wright, and Egon Zakrajsek for sharing data and helpful conversations. The views expressed here are solely our own and should not be interpreted as reflecting the views of the Board of Governors of the Federal Reserve System or of any other person associated with the Federal Reserve System. Return to text
1. We have reproduced the EPU index of Baker, Bloom, and Davis (2015) as a robustness check of our automated search technology. This includes a robustness check to searching over a broader set of ten national newspapers. We perform additional robustness checks of our index, displaying in this note the most important one. Return to text
2. Consistent with the largest of these spikes, in March 2003, Bernanke (2015) recalls, "U.S. forces had invaded Iraq a few days before the (March 2003) meeting. Businesses and households were reluctant to invest or borrow until they saw how the invasion would play out. My colleagues and I were also uncertain about the economic consequences of the war, especially its effect on energy prices. At Greenspan's urging, we decided to wait before considering further action. In our post-meeting statement, we said uncertainty was so high that we couldn't usefully characterize the near-term course of the economy or monetary policy. That unprecedented assertion probably added to the public's angst about the economy." Return to text
3. We display comparisons only with our baseline index, primarily for the sake of brevity. Return to text
4. We also consider forecast dispersion among primary dealers, calculated as the standard deviation across respondents' expected policy rates, as another proxy for monetary policy uncertainty. This follows the common practice of assuming that episodes of high (low) dispersion of point forecasts are indicative of a high (low) level of uncertainty regarding the forecasted variable. Our MPU index comoves with forecast dispersion prior to 2008 similarly. Return to text
5. The survey changed the pre-defined horizon multiple times. Respondents were first asked how many quarters ahead they judged the likelihood of liftoff. As forward guidance signaled a lengthy stay at the ZLB, in January 2012 the bins were changed to half-year increments. In July 2014, the question changed to quarters again; finally in December 2014, participants were asked how many meetings ahead they anticipated liftoff. Any liftoff uncertainty measure computed from this Survey thus has notable spikes when the bins in question changed values. Return to text
Please cite as:
Husted, Lucas, John Harold Rogers, and Bo Sun (2016). "Measuring Monetary Policy Uncertainty: The Federal Reserve, January 1985-January 2016," IFDP Notes. Washington: Board of Governors of the Federal Reserve System, April 11, 2016. https://doi.org/10.17016/2573-2129.21
Disclaimer: IFDP Notes are articles in which Board economists offer their own views and present analysis on a range of topics in economics and finance. These articles are shorter and less technically oriented than IFDP Working Papers.
