 Print
Print
Freedom of Information Office
2012 Reserve Bank Budgets
Contents
Action
On December 21, 2011, the Board approved the 2012 Reserve Bank operating budgets totaling $3,441.3 million, an increase of $166.6 million, or 5.1 percent, from the 2011 estimated expenses and $90.1 million, or 2.7 percent, from the approved 2011 budget.1 The Board also approved the 2012 Reserve Bank, Federal Reserve Information Technology (FRIT), and the Office of Employee Benefits (OEB) capital budgets, which total $404.2 million. The capital budgets were approved with the understanding that approval for actual capital outlays will be in accordance with the Board's Policies and Guidelines Concerning Reserve Bank Operations (FRAM 1-049). The attached statistical information provides details on expenses, staffing, and capital outlays.
The Reserve Banks' salary administration budgets reflect a 2012 program for merit adjustments for eligible staff of 2.0 percent and no merit funding for officers and senior professionals. This is consistent with the 2010 federal salary-freeze legislation and with the funding approved in the 2011 Reserve Bank budgets.
Total Expense and Employment Summary
The 2012 operating budgets of the Reserve Banks total $3,441.3 million. The 2012 budget is $166.6 million, or 5.1 percent, higher than the 2011 estimate. Total 2012 projected employment for the Reserve Banks, FRIT, and OEB is 18,102 ANP, an increase of 388 ANP, or 2.2 percent, from 2011 estimated staff levels.2 The expense growth is driven by increases in central bank functions, specifically in supervision, which represents 30 percent of total expenses. Implementation of the Dodd-Frank Wall Street Reform and Consumer Protection Act (Dodd-Frank Act) continues to be a significant factor in budget growth. These increases are somewhat offset by decreases in priced services costs as a result of continued declines in check volume and associated infrastructure, and a reduction in vendor fees and staffing related to the winding down or closing of the liquidity facilities in FRB New York .3
Table 1
Reserve Bank Expenses and Staffing
(dollars in millions)
2011 Budget
2011 Estimate
2011 Bud. vs.
2011 Est.
2012 Budget
2011 Est. vs.
2012 Bud.
Amount
Percent
Amount
Percent
Central bank services
$2,462.2
$2,407.0
-$55.3
-2.2%
$2,570.4
$163.4
6.8%
Treasury Services
$471.1
$465.5
-$5.7
-1.2%
$474.7
$9.2
2.0%
Priced Services
$417.9
$402.2
-$15.6
-3.7%
$396.2
-$6.0
-1.5%
Total Expense
$3,351.2
$3,274.6
-$76.6
-2.3%
$3,441.3
$166.6
5.1%
Supervision
$934.2
$917.8
-$16.4
-1.8%
$1,032.5
$114.7
12.5%
Check
$220.0
$200.8
-$19.2
-8.7%
$174.4
-$26.4
-13.1%
Total Expense, less Check and Supervision
$2,197.0
$2,156.0
-$41.0
-1.9%
$2,234.3
$78.3
3.6%
Total Staffing1
17,979
17,714
-265
-1.5%
18,102
388
2.2%
Supervision
3,397
3,335
-62
-1.8%
3,688
353
10.6%
Check2
648
584
-64
-9.8%
459
-125
-21.4%
Total Staffing, less Check and Supervision
13,934
13,795
-139
-1.0%
13,955
161
1.2%
1. Staffing is stated in Average Number of Personnel (ANP), which includes the average projected employment at the Reserve Banks, FRIT, and OEB. Return to table.
2. Check staffing includes associated nationally provided support services. Return to table.
Budgeted expenses for 2012, net of revenue and reimbursements, are expected to increase $190.3 million, or 8.2 percent, from 2011 estimated expenses. More than 27 percent of Reserve Bank expenses in the 2012 budget are offset by either priced service revenues (12.7 percent) or reimbursable claims for services provided to the Treasury and other agencies (14.5 percent).4 Budgeted 2012 priced services revenue is 7.3 percent lower than the 2011 estimated level, reflecting continued declines in check volume as customers shift to other payment methods. Reimbursable claims remain fairly stable in 2012.
Table 2
Change in Net Expenses
(dollars in millions)
2011 Budget
2011 Estimate
2012 Budget
Percent change
11B vs. 12B
11E vs. 12B
Total expense
$3,351.2
$3,274.6
$3,441.3
2.7%
5.1%
Less:
Priced services revenue
$497.2
$471.2
$436.8
-12.2%
-7.3%
Reimbursable claims
$492.2
$486.8
$497.6
1.1%
2.2%
Net expenses1
$2,361.8
$2,316.7
$2,507.0
6.1%
8.2%
1. Section 318 of the Dodd-Frank Act directs the Board of Governors to assess a fee to certain bank holding companies and other entities to carry out its supervisory and regulatory responsibilities with respect to such companies. When these assessments, which are based on the System's estimated cost to carry out this function, are implemented, they will further reduce net expenses. Return to table.
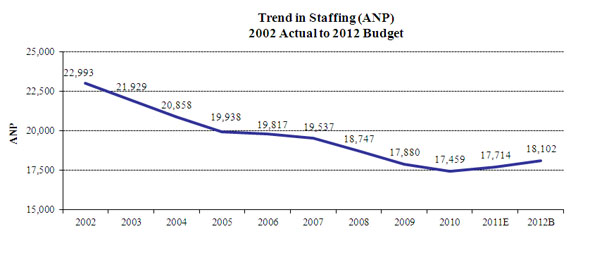
Staffing levels in 2012 are projected to increase slightly as supervision resources are added in all Districts. From 2002 - 2010, total staffing levels consistently decreased, primarily the result of the multiyear restructuring efforts in the check-processing function. During this period, staffing reached its lowest level of 17,459 in 2010. Subsequent increases reflect hiring, mainly in supervision, initially to address the financial crisis and, beginning in 2011, to implement the Dodd-Frank Act, along with growing resources in monetary policy and information technology.
2011 Budget Performance
Total 2011 expenses are estimated to be $3,274.6 million, which represents a decrease of $76.6 million, or 2.3 percent, from the approved 2011 budget of $3,351.2 million. Total 2011 estimated staffing of 17,714 ANP represents a decrease of 265 ANP from 2011 budgeted levels of 17,979 ANP.
The 2011 budget underrun is driven by the faster-than-projected decline in the volume of check and adjustment items, and the associated shrinking of the check infrastructure (-$19.2 million). Another significant factor contributing to the underrun is lower-than-budgeted expenses in supervision, primarily caused by hiring delays for staff with specialized skills, and higher-than-anticipated turnover (-$16.4 million). The research function also experienced hiring delays which resulted in lower-than-planned expenses (-$6.7 million).
Lower loan volume affected expenses associated with loans to depository institutions and others by decreasing vendor costs, dedicated staff, and operating expenses for the Maiden Lanes, TALF facilities, and the AIG credit facility (-$13.0 million). Additionally, the cash function is under budget due to greater-than-anticipated productivity and efficiency gains from the implementation of machine upgrades. As a result, several Reserve Bank cash functions reduced the number of machine shifts and experienced lower equipment repairs and maintenance costs (-$12.8 million).
Treasury Services is under budget as a result of a net underrun across its various programs (-$5.7 million). The primary drivers of the underrun are the decision by the Treasury to cancel the planned expansion of the Stored Value Card program, accelerated consolidation of Treasury Retail Securities operations, and decommissioning of other programs. These decreases are partially offset by the implementation of new projects, such as the Improper Payments Initiative (GOVerify).5
Total staffing is below budget by 265 ANP, including 132 ANP in central bank services. As detailed in table 3, the underrun reflects reductions in check adjustments, Treasury retail securities and other Treasury programs, as well as hiring delays, operational efficiencies, and adjustments to align resources to changing external and internal factors. Offsetting these underruns is higher-than-budgeted staffing, primarily to support the System's server consolidation initiative.
Table 3
Significant Staffing (ANP) Changes
2011 Budget to 2011 Estimate
2011 Budget
17,979
Reductions:
Central Bank Services
Research
-18
Cash
-27
Loans to Depository Institutions and Others
-28
Supervision
-62
Treasury Services
-90
Check Services
-64
Support
-56
Other Refinements
-11
Additions:
Centralized IT Services
73
Open Market
18
2011 Estimate
17,714
Initiatives Affecting the 2012 Budget
The 2012 growth of $166.6 million, or 5.1 percent, in the Reserve Banks' budgets reflects several initiatives, primarily for financial stability and enhanced resiliency, implementation of the Dodd-Frank Act, and application development projects for Treasury and priced services. A majority of the growth is driven by costs associated with the projected staff increases.
Central Bank Services
In the central bank services area, which includes monetary policy, services to financial institutions and the public, and supervision, total expenses are increasing $163.4 million, or 6.8 percent, compared to 2011 estimated expenses, and staffing levels are increasing 354 ANP, or 4.9 percent. The majority of the increase is in the supervision function, which is increasing $114.7 million, or 12.5 percent, for additional staffing to implement the requirements of the Dodd-Frank Act, as well as to address training initiatives and increased workload (353 ANP).
Cash operations expenses are increasing $23.0 million, or 4.5 percent, as work continues on the CashForward project. Although expenses are increasing for national project investments, cash operations are decreasing 30 ANP as a result of continued operational efficiencies.
Total 2012 budgeted costs for monetary policy are increasing $18.4 million, or 3.4 percent. Staffing is increasing 47 ANP, mainly in the FRB New York open market function, due to the full-year effect of 2011 staff additions for financial stability work, including the Dodd-Frank Act, as well as investments in data and data analytical tools and support for improved capabilities for mortgage backed securities sales.
The increases in central bank services expenses are being partially offset by a decrease of $6.3 million, or 6.8 percent, in expenses related to the loans to depository institutions and others function, primarily in FRB New York, as a result of lower vendor fees and staffing reductions of 13 ANP as the liquidity facilities created during the financial crisis continue to wind down.
Treasury-Related Functions
The budgeted expenses for services to the Treasury, which are fully reimbursable, show a net increase of $9.2 million, or 2.0 percent, in the 2012 budget as the result of continued work on several Treasury projects including GOVerify, the All-Electronic Treasury Initiative, and increased costs for the Treasury Collateral Management and Monitoring project.6 These expense increases are being offset largely by cost decreases related to the consolidation of the Treasury Retail Securities operation. Overall staffing for the Treasury function is budgeted to decrease by 18 ANP.
Priced Services
Total priced services expenses are decreasing $6.0 million, or 1.5 percent, from the 2011 estimate. The major driver of the decrease is check operations. Check expenses are decreasing $26.4 million, or 13.1 percent, reflecting lower costs associated with declining check volume, as well as continued operational efficiencies, and lower IT support costs. Check staffing levels are decreasing 125 ANP, or 21.4 percent, in the 2012 budget as a result of these actions. Partially offsetting this decrease are increases of $14.6 million for the Fedwire Funds and Securities services, primarily due to work for the Fedwire Modernization program. Full cost recovery is projected in the aggregate for the priced services in 2012.7
2012 Personnel Expenses
Reserve Bank officer and staff salaries and other personnel expenses for 2012 total $1,877.1 million, an increase of $106.2 million, or 6.0 percent, over 2011 estimated expenses. The increase reflects costs associated with additional staff and budgeted salary administration programs, including merit increases, promotions, and variable pay.
In December 2010, Congress enacted legislation prohibiting statutory pay adjustments for most federal civilian employees for a two-year period ending December 31, 2012. Although not required to do so under the legislation, the Reserve Banks comply with the spirit of the civilian federal government salary freeze enacted by Congress and interpreted in subsequent Office of Personnel Management (OPM) guidance, which permits increases under performance-based compensation systems such as those used by the Reserve Banks. Consistent with the funding approved in the 2011 Reserve Bank budgets, the 2012 Reserve Bank budgets reflect a 2.0 percent merit program for eligible staff ($23.8 million).8 There is no 2012 merit funding for officer and senior professionals.
The budgets also include funding for promotions and variable pay, which are unaffected by the salary-freeze legislation. The 2012 budgets include $2.6 million for officer promotions and $11.3 million for staff promotions. Funding for variable pay programs for officers and staff totals $114.4 million, an increase of $16.5 million from 2011 budgeted levels. The increased funding will be used to address targeted needs in certain areas.
Five-year trend in Reserve Bank expenses
Total expenses for the Reserve Banks have grown an average of 2.9 percent annually from 2007 to the 2012 budget.
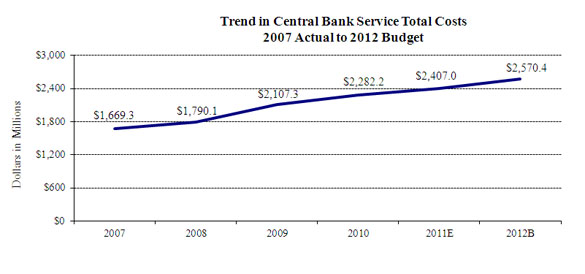
Trends in central bank services total cost
Central bank services have grown an average of 9.0 percent annually over the past five years. The largest expense growth is in supervision, where expenses have grown on average 11.7 percent per year over the past five years. Staffing in the area has increased by 1,031 ANP since 2007 due to additional resources necessary to address the financial crisis and changing banking conditions, as well as to implement the Dodd-Frank Act requirements. Monetary policy expenses have grown on average 9.5 percent annually. The increase reflects growth in the open market function in FRB New York due to increased staffing resources, data analysis, and data analytical tools to address increased responsibilities and lessons learned as a result of the financial crisis. Also contributing to the monetary policy growth are increased resources dedicated to regional economic research.
Expenses in loans to depository institutions and others have grown at an average annual rate of 23.7 percent over the past five years due to increased resources to support the emergency liquidity programs and other lending activities during the financial crisis. Expenses associated with these activities peaked in 2010 and have since declined, as most of the liquidity programs have wound down.9 Cash operations expenses increased on average 5.2 percent annually, reflecting a multiyear effort to modernize the cash processing and inventory-tracking infrastructure. The increases for cash project expenses have been partially offset by efficiency improvements.
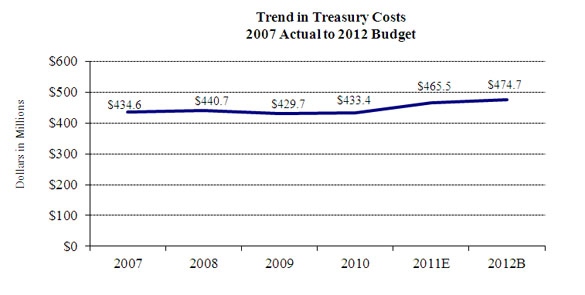
Trends in Treasury services total cost
Treasury services expenses have grown on average 1.8 percent annually since 2007. Costs have increased for initiatives related to the All-Electronic Treasury Initiative, the Treasury Web Application Infrastructure (TWAI), the Collections and Cash Management (CCMM) implementation, and other requested projects; efficiency improvements and program changes initiated by Treasury have offset some of the growth.
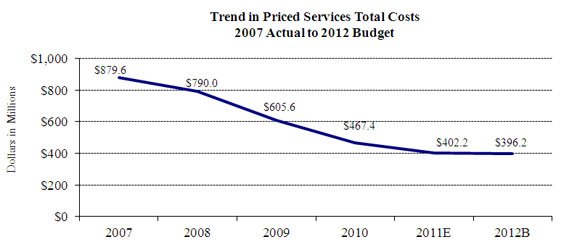
Trends in priced services total cost
Priced services expenses are decreasing at an average of 14.7 percent annually. As paper-check volume declined, check service expenses declined at an average of 24.5 percent annually since 2007. Slightly offsetting the declines in check services are increases in Fedwire funds and securities costs as a result of work on the Fedwire Modernization project.
Risks in the 2012 budget
The most significant risks in the 2012 budget are related to staffing. Most Reserve Banks have aggressive hiring plans, particularly in supervision, to address current banking conditions and to meet the responsibilities mandated by the Dodd-Frank Act. Attracting qualified staff and hiring as scheduled was challenging during 2011 and is expected to remain so in 2012. Increases in market demand could lead to significant turnover in key business areas and Reserve Banks could be further challenged to retain the necessary resources to meet critical business objectives. The Banks' compliance with the spirit of the federal government's current salary freeze also influences hiring and retention of staff. Conversely, there is a risk that Reserve Banks will not achieve the projected staff reductions associated with the IT and the accounts payable consolidation efforts.
Another risk to the 2012 budget is management of information technology costs. Continued growth in System projects could strain already stretched information technology resources, which could result in project delays or increased costs.
In addition, Treasury project changes and delays could affect budgeted expenses. The Treasury continues to refine its future vision for collections, payments, and cash management systems, along with the timing of different components of the project.
2012 Capital Plan
The 2012 capital budgets submitted by the Reserve Banks, FRIT, and OEB total $404.2 million, an $88.8 million, or 28.2 percent, increase from the 2011 estimated levels but 3.2 percent below the 2011 budget. The variance reflects a few new initiatives but is largely explained by project delays in multiyear building and automation initiatives, which shift the timing of outlays from 2011 to 2012.10 The capital budgets include funding for projects to support strategies that improve operational efficiencies, enhance services to Bank customers, and ensure a safe and productive work environment. In support of these strategies, the 2012 budgets include three categories of capital initiatives: building and infrastructure, information technology and System automation projects, and Treasury initiatives.
Building and infrastructure projects represent $177.4 million of the proposed capital budgets. Of the total building capital, $73.1 million is related to major projects in FRB Boston, FRB New York, FRB Chicago, and FRB San Francisco, including new initiatives in FRB New York for office reconfiguration ($4.2 million) to accommodate increased supervision staff and for vault automation ($5.0 million) in FRB Chicago. Other significant projects include emergency generators and uninterruptible power source equipment ($17.3 million) and security enhancements ($16.6 million) at several Banks. The remaining outlays in this category will fund other building renovation and refurbishment projects and various facility improvement projects.
The Reserve Banks and FRIT included $186.4 million in funding for major information technology initiatives and System automation projects. Multiyear projects currently underway to migrate major applications off the mainframe represent $51.1 million of the 2012 capital budget.11 Cash services initiatives represent $39.7 million of the total capital budgets, including $16.5 million for the CashForward project and $3.0 million for cash sensor upgrades. The Reserve Bank server consolidation effort and related network services account for an additional $18.1 million. The remaining budgets will fund other initiatives, such as data security, scheduled software and equipment upgrades, as well as telecommunications and LAN equipment for renovated or expanded office space.
The capital budgets also include $40.4 million for reimbursable Treasury initiatives, including support of TWAI ($9.5 million), GWA (Government-Wide Accounting, $8.1 million), CCMM-related efforts ($3.0 million), and various other projects.
Appendix
Statistical Supplement
Table A
Total Expenses of the Federal Reserve Banks, by District
Table B
Total Employment of the Federal Reserve Banks, by District
Table C
Total Expenses of the Federal Reserve Banks, by Functional Area
Table D
Total Employment of the Federal Reserve Banks, by Functional Area
Table E
Components of Compensation Programs of the Federal Reserve Banks, by District
Table F
Capital Outlays of the Federal Reserve Banks, by District
Table G
Capital Outlays of the Federal Reserve Banks, by Category
Notes: In the following tables, Reserve Bank expenses include those budgeted by FRIT and OEB that are chargeable to the Reserve Banks.
Components may not add to totals because of rounding. Table-to-table comparisons may also differ due to rounding.
Table A
2012 Final Budget
Total Expenses of the Federal Reserve Banks
by District, 2011 and 2012
(dollars in thousands)
District
a 2011
Budget
2011
Estimate
2012
Budget
Percent change
11B vs. 11E
11E vs. 12B
Boston
173,988
164,469
177,695
-5.5%
8.0%
New York
808,668
802,960
846,686
-0.7%
5.4%
Philadelphia
163,181
159,151
181,300
-2.5%
13.9%
Cleveland
182,753
182,393
158,538
-0.2%
-13.1%
Richmond
324,123
328,493
342,050
1.3%
4.1%
Atlanta
326,549
311,278
314,765
-4.7%
1.1%
Chicago
291,191
285,558
307,244
-1.9%
7.6%
St. Louis
236,880
224,638
234,550
-5.2%
4.4%
Minneapolis
159,059
157,597
172,357
-0.9%
9.4%
Kansas City
186,130
181,614
195,114
-2.4%
7.4%
Dallas
205,545
198,775
206,961
-3.3%
4.1%
San Francisco
293,164
277,717
304,027
-5.3%
9.5%
Total
3,351,230
3,274,641
3,441,287
-2.3%
5.1%
Return to statistical supplement index
Table B
2012 Final Budget
Total Employment of the Federal Reserve Banks
by District, 2011 and 2012
(average number of personnel)
District
2011
Budget
2011
Estimate
2012
Budget
Change
11B vs. 11E
11E vs. 12B
Boston
929
908
968
-22
61
New York
3,205
3,156
3,254
-49
98
Philadelphia
873
871
917
-3
46
Cleveland
1,302
1,179
973
-123
-205
Richmond
1,538
1,489
1,506
-49
18
Atlanta
1,648
1,617
1,593
-30
-24
Chicago
1,358
1,351
1,425
-7
74
St. Louis
979
955
1,006
-24
51
Minneapolis
1,036
1,042
1,109
6
67
Kansas City
1,262
1,283
1,343
21
60
Dallas
1,290
1,242
1,340
-47
97
San Francisco
1,546
1,520
1,568
-26
48
Subtotal
16,965
16,612
17,003
-353
391
FRIT
965
1,055
1,048
90
-6
OEB
49
47
51
-2
3
Total
17,979
17,714
18,102
-265
388
Return to statistical supplement index
Table C
2012 Final Budget
Total Expenses of the Federal Reserve Banks
by Service Line
(dollars in thousands)
Year
Total
Monetary and economic policy
Services to U.S. Treasury and gov't agencies
Services to financial institutions and the public
Supervision
Fee based services to financial institutions
2007
2,983,489
351,221
434,578
724,907
593,222
879,561
2008
3,020,762
389,219
440,669
758,595
642,238
790,042
2009
3,142,535
501,297
429,658
880,714
725,253
605,613
2010
3,183,011
497,719
433,417
982,559
801,910
467,404
2011E
3,274,641
533,787
465,450
955,360
917,809
402,235
2012B
3,441,287
552,149
474,653
985,700
1,032,540
396,244
AAGR
2007-2012
2.9%
9.5%
1.8%
6.3%
11.7%
-14.7%
Return to statistical supplement index
Table D
2012 Final Budget
Total Employment of the Federal Reserve Banks1
by Service Line
(average number of personnel)
Year
Total
Monetary and economic policy
Services to U.S. Treasury and gov't agencies
Services to financial institutions
and the public
Supervision
Fee based services to financial institutions
Local support and overhead
Nationally
provided
support
Centralized
service
providers
2007
19,537
934
1,293
2,708
2,657
3,891
6,366
874
813
2008
18,747
1,010
1,220
2,594
2,674
3,064
6,362
957
865
2009
17,880
1,081
1,147
2,727
2,863
1,772
6,461
969
861
2010
17,459
1,115
1,092
2,764
3,052
1,147
6,379
1,037
873
2011E
17,714
1,190
1,122
2,670
3,335
915
6,350
1,161
972
2012B
18,102
1,236
1,104
2,625
3,688
803
6,405
1,246
994
AAGR
2007-2012
-1.5%
5.8%
-3.1%
-0.6%
6.8%
-27.1%
0.1%
7.3%
4.1%
1. Includes average number of personnel (ANP) at FRIT and OEB. Return to table.
Nationally Provided Support: Support services performed on behalf of multiple Districts under a regionalized or centralized function. In this table, select nationally provided support ANP have been included in the associated service lines.
Centralized Service Providers: Support services provided by FRIT and OEB.
Return to statistical supplement index
Table E
2012 Final Budget
Components of Compensation Programs of the Federal Reserve Banks
Officers and Employees by District, 2012
(dollars in thousands)
District
Additions to salary base
Incremental
variable pay
Total
Merit
Equity
& market adjustments
Promotions and reclasses
Percent of total salary expense
Dollars
Percent of total salary expense
Dollars
Percent of total salary expense
Boston
1,468
0
479
2.1%
1,667
1.8%
3,614
3.9%
New York
5,391
0
5,294
2.7%
2,570
0.7%
13,255
3.4%
Philadelphia
1,143
0
650
2.4%
481
0.7%
2,274
3.1%
Cleveland
1,038
0
658
2.2%
382
0.5%
2,077
2.7%
Richmond
1,992
0
309
1.8%
1,485
1.2%
3,787
3.0%
Atlanta
1,647
0
1,218
2.1%
917
0.7%
3,782
2.8%
Chicago
1,585
0
1,625
2.4%
1,564
1.2%
4,774
3.6%
St. Louis
1,240
0
595
2.2%
690
0.8%
2,525
3.0%
Minneapolis
1,380
0
391
2.2%
651
0.8%
2,423
3.0%
Kansas City
1,543
0
1,105
2.7%
1,314
1.3%
3,962
4.0%
Dallas
1,122
0
436
1.7%
2,247
2.5%
3,805
4.2%
San Francisco
2,509
0
753
2.1%
1,779
1.2%
5,042
3.3%
FRIT
1,621
0
292
1.8%
662
0.6%
2,576
2.5%
OEB
79
0
145
3.3%
103
1.5%
327
4.8%
Total
23,760
0
13,951
2.3%
16,513
1.0%
54,223
3.3%
Merit: the amount of budgeted salary expense that reflects the cumulative effect of planned salary increases based on performance.
Promo & Reclasses: the amount of budgeted salary expense that reflects the cumulative impact of salary increases for individuals as a result of grade promotions and reclassifications resulting from a job evaluation.
Equity & Market Adjustments: the amount of budgeted salary expense to bring individual salaries to the minimum of a grade range or to better align salaries with the market. In 2012 Reserve Banks may reallocate some of the budgeted merit funds to equity. This allocation would not affect the total expense.
Variable Pay: tthe incremental amount of incentive payments (payment for the achievement of pre-determined goals) and cash awards (awards in recognition of exceptional achievements). Represents the expense change from 2011.
Return to statistical supplement index
Table F
2012 Final Budget
Capital Outlays of the Federal Reserve Banks
by District, 2011 and 2012
(dollars in thousands)
District
2011
Budget
2011
Estimate
2012
Budget
Percent change
11B vs. 11E
11E vs. 12B
Boston
22,558
19,600
29,573
-13.1%
50.9%
New York
128,183
74,193
122,319
-42.1%
64.9%
Philadelphia
12,731
13,096
15,181
2.9%
15.9%
Cleveland
13,781
10,023
14,471
-27.3%
44.4%
Richmond
18,311
12,895
21,797
-29.6%
69.0%
Atlanta
27,754
19,421
19,081
-30.0%
-1.7%
Chicago
31,446
28,118
39,384
-10.6%
40.1%
St. Louis
19,418
13,352
8,378
-31.2%
-37.3%
Minneapolis
16,110
15,441
15,401
-4.1%
-0.3%
Kansas City
1,233
5,392
7,160
337.2%
32.8%
Dallas
18,676
18,277
13,385
-2.1%
-26.8%
San Francisco
34,402
24,893
43,393
-27.6%
74.3%
Subtotal
344,603
254,701
349,523
-26.1%
37.2%
FRIT
70,687
59,777
53,727
-15.4%
-10.1%
OEB
2,300
933
950
-59.4%
1.8%
Total
417,590
315,411
404,200
-24.5%
28.2%
Return to statistical supplement index
Table G
2012 Final Budget
Capital Outlays of the Federal Reserve Banks1
by Category, 2011 and 2012
(dollars in thousands)
2011 Budget
2011 Estimate
2012 Budget
Percent change
11B vs. 11E
11E vs. 12B
Building / Infrastructure Projects
208,838
132,090
177,446
-36.7%
34.3%
IT & System Automation Projects
163,301
138,686
186,352
-15.1%
34.4%
Treasury Initiatives
45,451
44,635
40,401
-1.8%
-9.5%
Total
417,590
315,411
404,200
-24.5%
28.2%
1. Capital outlays for the twelve Reserve Banks, FRIT, and OEB. Return to table.
Return to statistical supplement index
Footnotes
*File updated on March 9, 2012, to reflect final version approved by the Board of Governors of the Federal Reserve System.
1. These expenses include those budgeted by Federal Reserve Information Technology and the Office of Employee Benefits that are chargeable to the Reserve Banks. Expenses exclude assessments for the Board of Governors operating expenses, pension costs, the cost of currency, the Consumer Financial Protection Bureau, and the Office of Financial Research. Return to text.
2. ANP is the average number of employees in terms of full-time positions for the period. For instance, a full-time employee who works one-half of the year counts as 0.5 ANP for that calendar year; two half-time employees who work the full year count as 1 ANP. Return to text.
3. Although most of the liquidity programs have ended, FRB New York continues to support several liquidity programs, including Maiden Lane, Maiden Lane II, Maiden Lane III, and Term Asset-Backed Securities Loan Facility (TALF). Return to text.
4. Reimbursable claims include the costs of fiscal agency and depository services provided to the U.S. Treasury, other government agencies, and other fiscal principals. Reimbursable claims are slightly higher than Treasury service expenses shown in table 1 because the reimbursable claims also include costs associated with the government's use of the Reserve Banks' check, ACH, Fedwire Funds, and Fedwire Securities services; these costs are included in priced services expense in table 1. Return to text.
5. GOVerify is a project in which FRB Kansas City is developing a data repository portal for the Bureau of Public Debt that will allow federal program agencies to verify the propriety of federal payments before they are disbursed. Return to text.
6. The All-Electronic Treasury Initiative implements the requirement for all federal payments to be made electronically and eliminates paper payroll savings bonds. Return to text.
7. When the priced services fee schedule was approved by the Board in October 2011, cost recovery for each priced service was projected to be 100 percent or greater for 2012. Based on the Reserve Banks' subsequent final budget submissions, 2012 cost recovery for the Fedwire Funds Service is now projected to be 99.2 percent. Return to text.
8. Reserve Banks have the discretion to allocate a portion of the merit pool to equity adjustments. Return to text.
9. Expenses associated with the remaining programs will continue to diminish, but this decrease will be gradual depending on continued activity, especially for the Maiden Lane facilities. In addition, the higher expenses reflect an increase in activities related to assessing value and margining collateral pledged to the Reserve Banks and steps that FRB New York, in particular, took structurally to manage its risk more effectively. These expenses are not likely to decrease over time and reflect additional ongoing activities. Return to text.
10. FRB New York expects to underspend its 2011 capital budget by $54.0 million, largely reflecting delayed or postponed building projects as well as delays in the Fedwire Migration program. Return to text.
11. The System's migration strategy involves moving a majority of applications from the mainframe to alternate processing environments. The migration strategy is managed in stages to minimize excess capacity and expenses. Projects included in the 2012 budget include the migration of the Fedwire, FedACH, check, accounting, and statistics/reserves systems. Return to text.
Contents
Action
On December 21, 2011, the Board approved the 2012 Reserve Bank operating budgets totaling $3,441.3 million, an increase of $166.6 million, or 5.1 percent, from the 2011 estimated expenses and $90.1 million, or 2.7 percent, from the approved 2011 budget.1 The Board also approved the 2012 Reserve Bank, Federal Reserve Information Technology (FRIT), and the Office of Employee Benefits (OEB) capital budgets, which total $404.2 million. The capital budgets were approved with the understanding that approval for actual capital outlays will be in accordance with the Board's Policies and Guidelines Concerning Reserve Bank Operations (FRAM 1-049). The attached statistical information provides details on expenses, staffing, and capital outlays.
The Reserve Banks' salary administration budgets reflect a 2012 program for merit adjustments for eligible staff of 2.0 percent and no merit funding for officers and senior professionals. This is consistent with the 2010 federal salary-freeze legislation and with the funding approved in the 2011 Reserve Bank budgets.

Total Expense and Employment Summary
The 2012 operating budgets of the Reserve Banks total $3,441.3 million. The 2012 budget is $166.6 million, or 5.1 percent, higher than the 2011 estimate. Total 2012 projected employment for the Reserve Banks, FRIT, and OEB is 18,102 ANP, an increase of 388 ANP, or 2.2 percent, from 2011 estimated staff levels.2 The expense growth is driven by increases in central bank functions, specifically in supervision, which represents 30 percent of total expenses. Implementation of the Dodd-Frank Wall Street Reform and Consumer Protection Act (Dodd-Frank Act) continues to be a significant factor in budget growth. These increases are somewhat offset by decreases in priced services costs as a result of continued declines in check volume and associated infrastructure, and a reduction in vendor fees and staffing related to the winding down or closing of the liquidity facilities in FRB New York .3
Table 1
Reserve Bank Expenses and Staffing
(dollars in millions)
| 2011 Budget | 2011 Estimate |
2011 Bud. vs. 2011 Est. |
2012 Budget |
2011 Est. vs. 2012 Bud. |
|||
|---|---|---|---|---|---|---|---|
| Amount | Percent | Amount | Percent | ||||
| Central bank services | $2,462.2 | $2,407.0 | -$55.3 | -2.2% | $2,570.4 | $163.4 | 6.8% |
| Treasury Services | $471.1 | $465.5 | -$5.7 | -1.2% | $474.7 | $9.2 | 2.0% |
| Priced Services | $417.9 | $402.2 | -$15.6 | -3.7% | $396.2 | -$6.0 | -1.5% |
| Total Expense | $3,351.2 | $3,274.6 | -$76.6 | -2.3% | $3,441.3 | $166.6 | 5.1% |
| Supervision | $934.2 | $917.8 | -$16.4 | -1.8% | $1,032.5 | $114.7 | 12.5% |
| Check | $220.0 | $200.8 | -$19.2 | -8.7% | $174.4 | -$26.4 | -13.1% |
| Total Expense, less Check and Supervision | $2,197.0 | $2,156.0 | -$41.0 | -1.9% | $2,234.3 | $78.3 | 3.6% |
| Total Staffing1 | 17,979 | 17,714 | -265 | -1.5% | 18,102 | 388 | 2.2% |
| Supervision | 3,397 | 3,335 | -62 | -1.8% | 3,688 | 353 | 10.6% |
| Check2 | 648 | 584 | -64 | -9.8% | 459 | -125 | -21.4% |
| Total Staffing, less Check and Supervision | 13,934 | 13,795 | -139 | -1.0% | 13,955 | 161 | 1.2% |
1. Staffing is stated in Average Number of Personnel (ANP), which includes the average projected employment at the Reserve Banks, FRIT, and OEB. Return to table.
2. Check staffing includes associated nationally provided support services. Return to table.
Budgeted expenses for 2012, net of revenue and reimbursements, are expected to increase $190.3 million, or 8.2 percent, from 2011 estimated expenses. More than 27 percent of Reserve Bank expenses in the 2012 budget are offset by either priced service revenues (12.7 percent) or reimbursable claims for services provided to the Treasury and other agencies (14.5 percent).4 Budgeted 2012 priced services revenue is 7.3 percent lower than the 2011 estimated level, reflecting continued declines in check volume as customers shift to other payment methods. Reimbursable claims remain fairly stable in 2012.
Table 2
Change in Net Expenses
(dollars in millions)
| 2011 Budget | 2011 Estimate | 2012 Budget | Percent change | ||
|---|---|---|---|---|---|
| 11B vs. 12B | 11E vs. 12B | ||||
| Total expense | $3,351.2 | $3,274.6 | $3,441.3 | 2.7% | 5.1% |
| Less: | |||||
| Priced services revenue | $497.2 | $471.2 | $436.8 | -12.2% | -7.3% |
| Reimbursable claims | $492.2 | $486.8 | $497.6 | 1.1% | 2.2% |
| Net expenses1 | $2,361.8 | $2,316.7 | $2,507.0 | 6.1% | 8.2% |
1. Section 318 of the Dodd-Frank Act directs the Board of Governors to assess a fee to certain bank holding companies and other entities to carry out its supervisory and regulatory responsibilities with respect to such companies. When these assessments, which are based on the System's estimated cost to carry out this function, are implemented, they will further reduce net expenses. Return to table.
Staffing levels in 2012 are projected to increase slightly as supervision resources are added in all Districts. From 2002 - 2010, total staffing levels consistently decreased, primarily the result of the multiyear restructuring efforts in the check-processing function. During this period, staffing reached its lowest level of 17,459 in 2010. Subsequent increases reflect hiring, mainly in supervision, initially to address the financial crisis and, beginning in 2011, to implement the Dodd-Frank Act, along with growing resources in monetary policy and information technology.
2011 Budget Performance
Total 2011 expenses are estimated to be $3,274.6 million, which represents a decrease of $76.6 million, or 2.3 percent, from the approved 2011 budget of $3,351.2 million. Total 2011 estimated staffing of 17,714 ANP represents a decrease of 265 ANP from 2011 budgeted levels of 17,979 ANP.
The 2011 budget underrun is driven by the faster-than-projected decline in the volume of check and adjustment items, and the associated shrinking of the check infrastructure (-$19.2 million). Another significant factor contributing to the underrun is lower-than-budgeted expenses in supervision, primarily caused by hiring delays for staff with specialized skills, and higher-than-anticipated turnover (-$16.4 million). The research function also experienced hiring delays which resulted in lower-than-planned expenses (-$6.7 million).
Lower loan volume affected expenses associated with loans to depository institutions and others by decreasing vendor costs, dedicated staff, and operating expenses for the Maiden Lanes, TALF facilities, and the AIG credit facility (-$13.0 million). Additionally, the cash function is under budget due to greater-than-anticipated productivity and efficiency gains from the implementation of machine upgrades. As a result, several Reserve Bank cash functions reduced the number of machine shifts and experienced lower equipment repairs and maintenance costs (-$12.8 million).
Treasury Services is under budget as a result of a net underrun across its various programs (-$5.7 million). The primary drivers of the underrun are the decision by the Treasury to cancel the planned expansion of the Stored Value Card program, accelerated consolidation of Treasury Retail Securities operations, and decommissioning of other programs. These decreases are partially offset by the implementation of new projects, such as the Improper Payments Initiative (GOVerify).5
Total staffing is below budget by 265 ANP, including 132 ANP in central bank services. As detailed in table 3, the underrun reflects reductions in check adjustments, Treasury retail securities and other Treasury programs, as well as hiring delays, operational efficiencies, and adjustments to align resources to changing external and internal factors. Offsetting these underruns is higher-than-budgeted staffing, primarily to support the System's server consolidation initiative.
Table 3
Significant Staffing (ANP) Changes
2011 Budget to 2011 Estimate
| 2011 Budget | 17,979 |
|---|---|
| Reductions: | |
| Central Bank Services | |
| Research | -18 |
| Cash | -27 |
| Loans to Depository Institutions and Others | -28 |
| Supervision | -62 |
| Treasury Services | -90 |
| Check Services | -64 |
| Support | -56 |
| Other Refinements | -11 |
| Additions: | |
| Centralized IT Services | 73 |
| Open Market | 18 |
| 2011 Estimate | 17,714 |
Initiatives Affecting the 2012 Budget
The 2012 growth of $166.6 million, or 5.1 percent, in the Reserve Banks' budgets reflects several initiatives, primarily for financial stability and enhanced resiliency, implementation of the Dodd-Frank Act, and application development projects for Treasury and priced services. A majority of the growth is driven by costs associated with the projected staff increases.
Central Bank Services
In the central bank services area, which includes monetary policy, services to financial institutions and the public, and supervision, total expenses are increasing $163.4 million, or 6.8 percent, compared to 2011 estimated expenses, and staffing levels are increasing 354 ANP, or 4.9 percent. The majority of the increase is in the supervision function, which is increasing $114.7 million, or 12.5 percent, for additional staffing to implement the requirements of the Dodd-Frank Act, as well as to address training initiatives and increased workload (353 ANP).
Cash operations expenses are increasing $23.0 million, or 4.5 percent, as work continues on the CashForward project. Although expenses are increasing for national project investments, cash operations are decreasing 30 ANP as a result of continued operational efficiencies.
Total 2012 budgeted costs for monetary policy are increasing $18.4 million, or 3.4 percent. Staffing is increasing 47 ANP, mainly in the FRB New York open market function, due to the full-year effect of 2011 staff additions for financial stability work, including the Dodd-Frank Act, as well as investments in data and data analytical tools and support for improved capabilities for mortgage backed securities sales.
The increases in central bank services expenses are being partially offset by a decrease of $6.3 million, or 6.8 percent, in expenses related to the loans to depository institutions and others function, primarily in FRB New York, as a result of lower vendor fees and staffing reductions of 13 ANP as the liquidity facilities created during the financial crisis continue to wind down.
Treasury-Related Functions
The budgeted expenses for services to the Treasury, which are fully reimbursable, show a net increase of $9.2 million, or 2.0 percent, in the 2012 budget as the result of continued work on several Treasury projects including GOVerify, the All-Electronic Treasury Initiative, and increased costs for the Treasury Collateral Management and Monitoring project.6 These expense increases are being offset largely by cost decreases related to the consolidation of the Treasury Retail Securities operation. Overall staffing for the Treasury function is budgeted to decrease by 18 ANP.
Priced Services
Total priced services expenses are decreasing $6.0 million, or 1.5 percent, from the 2011 estimate. The major driver of the decrease is check operations. Check expenses are decreasing $26.4 million, or 13.1 percent, reflecting lower costs associated with declining check volume, as well as continued operational efficiencies, and lower IT support costs. Check staffing levels are decreasing 125 ANP, or 21.4 percent, in the 2012 budget as a result of these actions. Partially offsetting this decrease are increases of $14.6 million for the Fedwire Funds and Securities services, primarily due to work for the Fedwire Modernization program. Full cost recovery is projected in the aggregate for the priced services in 2012.7
2012 Personnel Expenses
Reserve Bank officer and staff salaries and other personnel expenses for 2012 total $1,877.1 million, an increase of $106.2 million, or 6.0 percent, over 2011 estimated expenses. The increase reflects costs associated with additional staff and budgeted salary administration programs, including merit increases, promotions, and variable pay.
In December 2010, Congress enacted legislation prohibiting statutory pay adjustments for most federal civilian employees for a two-year period ending December 31, 2012. Although not required to do so under the legislation, the Reserve Banks comply with the spirit of the civilian federal government salary freeze enacted by Congress and interpreted in subsequent Office of Personnel Management (OPM) guidance, which permits increases under performance-based compensation systems such as those used by the Reserve Banks. Consistent with the funding approved in the 2011 Reserve Bank budgets, the 2012 Reserve Bank budgets reflect a 2.0 percent merit program for eligible staff ($23.8 million).8 There is no 2012 merit funding for officer and senior professionals.
The budgets also include funding for promotions and variable pay, which are unaffected by the salary-freeze legislation. The 2012 budgets include $2.6 million for officer promotions and $11.3 million for staff promotions. Funding for variable pay programs for officers and staff totals $114.4 million, an increase of $16.5 million from 2011 budgeted levels. The increased funding will be used to address targeted needs in certain areas.
Five-year trend in Reserve Bank expenses
Total expenses for the Reserve Banks have grown an average of 2.9 percent annually from 2007 to the 2012 budget.
Trends in central bank services total cost
Central bank services have grown an average of 9.0 percent annually over the past five years. The largest expense growth is in supervision, where expenses have grown on average 11.7 percent per year over the past five years. Staffing in the area has increased by 1,031 ANP since 2007 due to additional resources necessary to address the financial crisis and changing banking conditions, as well as to implement the Dodd-Frank Act requirements. Monetary policy expenses have grown on average 9.5 percent annually. The increase reflects growth in the open market function in FRB New York due to increased staffing resources, data analysis, and data analytical tools to address increased responsibilities and lessons learned as a result of the financial crisis. Also contributing to the monetary policy growth are increased resources dedicated to regional economic research.
Expenses in loans to depository institutions and others have grown at an average annual rate of 23.7 percent over the past five years due to increased resources to support the emergency liquidity programs and other lending activities during the financial crisis. Expenses associated with these activities peaked in 2010 and have since declined, as most of the liquidity programs have wound down.9 Cash operations expenses increased on average 5.2 percent annually, reflecting a multiyear effort to modernize the cash processing and inventory-tracking infrastructure. The increases for cash project expenses have been partially offset by efficiency improvements.
Trends in Treasury services total cost
Treasury services expenses have grown on average 1.8 percent annually since 2007. Costs have increased for initiatives related to the All-Electronic Treasury Initiative, the Treasury Web Application Infrastructure (TWAI), the Collections and Cash Management (CCMM) implementation, and other requested projects; efficiency improvements and program changes initiated by Treasury have offset some of the growth.
Trends in priced services total cost
Priced services expenses are decreasing at an average of 14.7 percent annually. As paper-check volume declined, check service expenses declined at an average of 24.5 percent annually since 2007. Slightly offsetting the declines in check services are increases in Fedwire funds and securities costs as a result of work on the Fedwire Modernization project.
Risks in the 2012 budget
The most significant risks in the 2012 budget are related to staffing. Most Reserve Banks have aggressive hiring plans, particularly in supervision, to address current banking conditions and to meet the responsibilities mandated by the Dodd-Frank Act. Attracting qualified staff and hiring as scheduled was challenging during 2011 and is expected to remain so in 2012. Increases in market demand could lead to significant turnover in key business areas and Reserve Banks could be further challenged to retain the necessary resources to meet critical business objectives. The Banks' compliance with the spirit of the federal government's current salary freeze also influences hiring and retention of staff. Conversely, there is a risk that Reserve Banks will not achieve the projected staff reductions associated with the IT and the accounts payable consolidation efforts.
Another risk to the 2012 budget is management of information technology costs. Continued growth in System projects could strain already stretched information technology resources, which could result in project delays or increased costs.
In addition, Treasury project changes and delays could affect budgeted expenses. The Treasury continues to refine its future vision for collections, payments, and cash management systems, along with the timing of different components of the project.
2012 Capital Plan
The 2012 capital budgets submitted by the Reserve Banks, FRIT, and OEB total $404.2 million, an $88.8 million, or 28.2 percent, increase from the 2011 estimated levels but 3.2 percent below the 2011 budget. The variance reflects a few new initiatives but is largely explained by project delays in multiyear building and automation initiatives, which shift the timing of outlays from 2011 to 2012.10 The capital budgets include funding for projects to support strategies that improve operational efficiencies, enhance services to Bank customers, and ensure a safe and productive work environment. In support of these strategies, the 2012 budgets include three categories of capital initiatives: building and infrastructure, information technology and System automation projects, and Treasury initiatives.
Building and infrastructure projects represent $177.4 million of the proposed capital budgets. Of the total building capital, $73.1 million is related to major projects in FRB Boston, FRB New York, FRB Chicago, and FRB San Francisco, including new initiatives in FRB New York for office reconfiguration ($4.2 million) to accommodate increased supervision staff and for vault automation ($5.0 million) in FRB Chicago. Other significant projects include emergency generators and uninterruptible power source equipment ($17.3 million) and security enhancements ($16.6 million) at several Banks. The remaining outlays in this category will fund other building renovation and refurbishment projects and various facility improvement projects.
The Reserve Banks and FRIT included $186.4 million in funding for major information technology initiatives and System automation projects. Multiyear projects currently underway to migrate major applications off the mainframe represent $51.1 million of the 2012 capital budget.11 Cash services initiatives represent $39.7 million of the total capital budgets, including $16.5 million for the CashForward project and $3.0 million for cash sensor upgrades. The Reserve Bank server consolidation effort and related network services account for an additional $18.1 million. The remaining budgets will fund other initiatives, such as data security, scheduled software and equipment upgrades, as well as telecommunications and LAN equipment for renovated or expanded office space.
The capital budgets also include $40.4 million for reimbursable Treasury initiatives, including support of TWAI ($9.5 million), GWA (Government-Wide Accounting, $8.1 million), CCMM-related efforts ($3.0 million), and various other projects.
Appendix
Statistical Supplement
| Table A | Total Expenses of the Federal Reserve Banks, by District |
| Table B | Total Employment of the Federal Reserve Banks, by District |
| Table C | Total Expenses of the Federal Reserve Banks, by Functional Area |
| Table D | Total Employment of the Federal Reserve Banks, by Functional Area |
| Table E | Components of Compensation Programs of the Federal Reserve Banks, by District |
| Table F | Capital Outlays of the Federal Reserve Banks, by District |
| Table G | Capital Outlays of the Federal Reserve Banks, by Category |
Notes: In the following tables, Reserve Bank expenses include those budgeted by FRIT and OEB that are chargeable to the Reserve Banks.
Components may not add to totals because of rounding. Table-to-table comparisons may also differ due to rounding.
Table A
2012 Final Budget
Total Expenses of the Federal Reserve Banks
by District, 2011 and 2012
(dollars in thousands)
| District |
a 2011 Budget |
2011 Estimate |
2012 Budget |
Percent change | |
|---|---|---|---|---|---|
| 11B vs. 11E | 11E vs. 12B | ||||
| Boston | 173,988 | 164,469 | 177,695 | -5.5% | 8.0% |
| New York | 808,668 | 802,960 | 846,686 | -0.7% | 5.4% |
| Philadelphia | 163,181 | 159,151 | 181,300 | -2.5% | 13.9% |
| Cleveland | 182,753 | 182,393 | 158,538 | -0.2% | -13.1% |
| Richmond | 324,123 | 328,493 | 342,050 | 1.3% | 4.1% |
| Atlanta | 326,549 | 311,278 | 314,765 | -4.7% | 1.1% |
| Chicago | 291,191 | 285,558 | 307,244 | -1.9% | 7.6% |
| St. Louis | 236,880 | 224,638 | 234,550 | -5.2% | 4.4% |
| Minneapolis | 159,059 | 157,597 | 172,357 | -0.9% | 9.4% |
| Kansas City | 186,130 | 181,614 | 195,114 | -2.4% | 7.4% |
| Dallas | 205,545 | 198,775 | 206,961 | -3.3% | 4.1% |
| San Francisco | 293,164 | 277,717 | 304,027 | -5.3% | 9.5% |
| Total | 3,351,230 | 3,274,641 | 3,441,287 | -2.3% | 5.1% |
Return to statistical supplement index
Table B
2012 Final Budget
Total Employment of the Federal Reserve Banks
by District, 2011 and 2012
(average number of personnel)
| District |
2011 Budget |
2011 Estimate |
2012 Budget |
Change | |
|---|---|---|---|---|---|
| 11B vs. 11E | 11E vs. 12B | ||||
| Boston | 929 | 908 | 968 | -22 | 61 |
| New York | 3,205 | 3,156 | 3,254 | -49 | 98 |
| Philadelphia | 873 | 871 | 917 | -3 | 46 |
| Cleveland | 1,302 | 1,179 | 973 | -123 | -205 |
| Richmond | 1,538 | 1,489 | 1,506 | -49 | 18 |
| Atlanta | 1,648 | 1,617 | 1,593 | -30 | -24 |
| Chicago | 1,358 | 1,351 | 1,425 | -7 | 74 |
| St. Louis | 979 | 955 | 1,006 | -24 | 51 |
| Minneapolis | 1,036 | 1,042 | 1,109 | 6 | 67 |
| Kansas City | 1,262 | 1,283 | 1,343 | 21 | 60 |
| Dallas | 1,290 | 1,242 | 1,340 | -47 | 97 |
| San Francisco | 1,546 | 1,520 | 1,568 | -26 | 48 |
| Subtotal | 16,965 | 16,612 | 17,003 | -353 | 391 |
| FRIT | 965 | 1,055 | 1,048 | 90 | -6 |
| OEB | 49 | 47 | 51 | -2 | 3 |
| Total | 17,979 | 17,714 | 18,102 | -265 | 388 |
Return to statistical supplement index
Table C
2012 Final Budget
Total Expenses of the Federal Reserve Banks
by Service Line
(dollars in thousands)
| Year | Total | Monetary and economic policy | Services to U.S. Treasury and gov't agencies | Services to financial institutions and the public | Supervision | Fee based services to financial institutions |
|---|---|---|---|---|---|---|
| 2007 | 2,983,489 | 351,221 | 434,578 | 724,907 | 593,222 | 879,561 |
| 2008 | 3,020,762 | 389,219 | 440,669 | 758,595 | 642,238 | 790,042 |
| 2009 | 3,142,535 | 501,297 | 429,658 | 880,714 | 725,253 | 605,613 |
| 2010 | 3,183,011 | 497,719 | 433,417 | 982,559 | 801,910 | 467,404 |
| 2011E | 3,274,641 | 533,787 | 465,450 | 955,360 | 917,809 | 402,235 |
| 2012B | 3,441,287 | 552,149 | 474,653 | 985,700 | 1,032,540 | 396,244 |
|
AAGR 2007-2012 |
2.9% | 9.5% | 1.8% | 6.3% | 11.7% | -14.7% |
Return to statistical supplement index
Table D
2012 Final Budget
Total Employment of the Federal Reserve Banks1
by Service Line
(average number of personnel)
| Year | Total | Monetary and economic policy | Services to U.S. Treasury and gov't agencies |
Services to financial institutions and the public |
Supervision | Fee based services to financial institutions | Local support and overhead |
Nationally provided support |
Centralized service providers |
|---|---|---|---|---|---|---|---|---|---|
| 2007 | 19,537 | 934 | 1,293 | 2,708 | 2,657 | 3,891 | 6,366 | 874 | 813 |
| 2008 | 18,747 | 1,010 | 1,220 | 2,594 | 2,674 | 3,064 | 6,362 | 957 | 865 |
| 2009 | 17,880 | 1,081 | 1,147 | 2,727 | 2,863 | 1,772 | 6,461 | 969 | 861 |
| 2010 | 17,459 | 1,115 | 1,092 | 2,764 | 3,052 | 1,147 | 6,379 | 1,037 | 873 |
| 2011E | 17,714 | 1,190 | 1,122 | 2,670 | 3,335 | 915 | 6,350 | 1,161 | 972 |
| 2012B | 18,102 | 1,236 | 1,104 | 2,625 | 3,688 | 803 | 6,405 | 1,246 | 994 |
|
AAGR 2007-2012 |
-1.5% | 5.8% | -3.1% | -0.6% | 6.8% | -27.1% | 0.1% | 7.3% | 4.1% |
Nationally Provided Support: Support services performed on behalf of multiple Districts under a regionalized or centralized function. In this table, select nationally provided support ANP have been included in the associated service lines.
Centralized Service Providers: Support services provided by FRIT and OEB.
Return to statistical supplement index
Table E
2012 Final Budget
Components of Compensation Programs of the Federal Reserve Banks
Officers and Employees by District, 2012
(dollars in thousands)
| District | Additions to salary base |
Incremental variable pay |
Total | |||||
|---|---|---|---|---|---|---|---|---|
| Merit |
Equity & market adjustments |
Promotions and reclasses | Percent of total salary expense | Dollars | Percent of total salary expense | Dollars | Percent of total salary expense | |
| Boston | 1,468 | 0 | 479 | 2.1% | 1,667 | 1.8% | 3,614 | 3.9% |
| New York | 5,391 | 0 | 5,294 | 2.7% | 2,570 | 0.7% | 13,255 | 3.4% |
| Philadelphia | 1,143 | 0 | 650 | 2.4% | 481 | 0.7% | 2,274 | 3.1% |
| Cleveland | 1,038 | 0 | 658 | 2.2% | 382 | 0.5% | 2,077 | 2.7% |
| Richmond | 1,992 | 0 | 309 | 1.8% | 1,485 | 1.2% | 3,787 | 3.0% |
| Atlanta | 1,647 | 0 | 1,218 | 2.1% | 917 | 0.7% | 3,782 | 2.8% |
| Chicago | 1,585 | 0 | 1,625 | 2.4% | 1,564 | 1.2% | 4,774 | 3.6% |
| St. Louis | 1,240 | 0 | 595 | 2.2% | 690 | 0.8% | 2,525 | 3.0% |
| Minneapolis | 1,380 | 0 | 391 | 2.2% | 651 | 0.8% | 2,423 | 3.0% |
| Kansas City | 1,543 | 0 | 1,105 | 2.7% | 1,314 | 1.3% | 3,962 | 4.0% |
| Dallas | 1,122 | 0 | 436 | 1.7% | 2,247 | 2.5% | 3,805 | 4.2% |
| San Francisco | 2,509 | 0 | 753 | 2.1% | 1,779 | 1.2% | 5,042 | 3.3% |
| FRIT | 1,621 | 0 | 292 | 1.8% | 662 | 0.6% | 2,576 | 2.5% |
| OEB | 79 | 0 | 145 | 3.3% | 103 | 1.5% | 327 | 4.8% |
| Total | 23,760 | 0 | 13,951 | 2.3% | 16,513 | 1.0% | 54,223 | 3.3% |
Promo & Reclasses: the amount of budgeted salary expense that reflects the cumulative impact of salary increases for individuals as a result of grade promotions and reclassifications resulting from a job evaluation.
Equity & Market Adjustments: the amount of budgeted salary expense to bring individual salaries to the minimum of a grade range or to better align salaries with the market. In 2012 Reserve Banks may reallocate some of the budgeted merit funds to equity. This allocation would not affect the total expense.
Variable Pay: tthe incremental amount of incentive payments (payment for the achievement of pre-determined goals) and cash awards (awards in recognition of exceptional achievements). Represents the expense change from 2011.
Table F
2012 Final Budget
Capital Outlays of the Federal Reserve Banks
by District, 2011 and 2012
(dollars in thousands)
| District |
2011 Budget |
2011 Estimate |
2012 Budget |
Percent change | |
|---|---|---|---|---|---|
| 11B vs. 11E | 11E vs. 12B | ||||
| Boston | 22,558 | 19,600 | 29,573 | -13.1% | 50.9% |
| New York | 128,183 | 74,193 | 122,319 | -42.1% | 64.9% |
| Philadelphia | 12,731 | 13,096 | 15,181 | 2.9% | 15.9% |
| Cleveland | 13,781 | 10,023 | 14,471 | -27.3% | 44.4% |
| Richmond | 18,311 | 12,895 | 21,797 | -29.6% | 69.0% |
| Atlanta | 27,754 | 19,421 | 19,081 | -30.0% | -1.7% |
| Chicago | 31,446 | 28,118 | 39,384 | -10.6% | 40.1% |
| St. Louis | 19,418 | 13,352 | 8,378 | -31.2% | -37.3% |
| Minneapolis | 16,110 | 15,441 | 15,401 | -4.1% | -0.3% |
| Kansas City | 1,233 | 5,392 | 7,160 | 337.2% | 32.8% |
| Dallas | 18,676 | 18,277 | 13,385 | -2.1% | -26.8% |
| San Francisco | 34,402 | 24,893 | 43,393 | -27.6% | 74.3% |
| Subtotal | 344,603 | 254,701 | 349,523 | -26.1% | 37.2% |
| FRIT | 70,687 | 59,777 | 53,727 | -15.4% | -10.1% |
| OEB | 2,300 | 933 | 950 | -59.4% | 1.8% |
| Total | 417,590 | 315,411 | 404,200 | -24.5% | 28.2% |
Return to statistical supplement index
Table G
2012 Final Budget
Capital Outlays of the Federal Reserve Banks1
by Category, 2011 and 2012
(dollars in thousands)
| 2011 Budget | 2011 Estimate | 2012 Budget | Percent change | ||
|---|---|---|---|---|---|
| 11B vs. 11E | 11E vs. 12B | ||||
| Building / Infrastructure Projects | 208,838 | 132,090 | 177,446 | -36.7% | 34.3% |
| IT & System Automation Projects | 163,301 | 138,686 | 186,352 | -15.1% | 34.4% |
| Treasury Initiatives | 45,451 | 44,635 | 40,401 | -1.8% | -9.5% |
| Total | 417,590 | 315,411 | 404,200 | -24.5% | 28.2% |
Return to statistical supplement index
Footnotes
*File updated on March 9, 2012, to reflect final version approved by the Board of Governors of the Federal Reserve System.
1. These expenses include those budgeted by Federal Reserve Information Technology and the Office of Employee Benefits that are chargeable to the Reserve Banks. Expenses exclude assessments for the Board of Governors operating expenses, pension costs, the cost of currency, the Consumer Financial Protection Bureau, and the Office of Financial Research. Return to text.
2. ANP is the average number of employees in terms of full-time positions for the period. For instance, a full-time employee who works one-half of the year counts as 0.5 ANP for that calendar year; two half-time employees who work the full year count as 1 ANP. Return to text.
3. Although most of the liquidity programs have ended, FRB New York continues to support several liquidity programs, including Maiden Lane, Maiden Lane II, Maiden Lane III, and Term Asset-Backed Securities Loan Facility (TALF). Return to text.
4. Reimbursable claims include the costs of fiscal agency and depository services provided to the U.S. Treasury, other government agencies, and other fiscal principals. Reimbursable claims are slightly higher than Treasury service expenses shown in table 1 because the reimbursable claims also include costs associated with the government's use of the Reserve Banks' check, ACH, Fedwire Funds, and Fedwire Securities services; these costs are included in priced services expense in table 1. Return to text.
5. GOVerify is a project in which FRB Kansas City is developing a data repository portal for the Bureau of Public Debt that will allow federal program agencies to verify the propriety of federal payments before they are disbursed. Return to text.
6. The All-Electronic Treasury Initiative implements the requirement for all federal payments to be made electronically and eliminates paper payroll savings bonds. Return to text.
7. When the priced services fee schedule was approved by the Board in October 2011, cost recovery for each priced service was projected to be 100 percent or greater for 2012. Based on the Reserve Banks' subsequent final budget submissions, 2012 cost recovery for the Fedwire Funds Service is now projected to be 99.2 percent. Return to text.
8. Reserve Banks have the discretion to allocate a portion of the merit pool to equity adjustments. Return to text.
9. Expenses associated with the remaining programs will continue to diminish, but this decrease will be gradual depending on continued activity, especially for the Maiden Lane facilities. In addition, the higher expenses reflect an increase in activities related to assessing value and margining collateral pledged to the Reserve Banks and steps that FRB New York, in particular, took structurally to manage its risk more effectively. These expenses are not likely to decrease over time and reflect additional ongoing activities. Return to text.
10. FRB New York expects to underspend its 2011 capital budget by $54.0 million, largely reflecting delayed or postponed building projects as well as delays in the Fedwire Migration program. Return to text.
11. The System's migration strategy involves moving a majority of applications from the mainframe to alternate processing environments. The migration strategy is managed in stages to minimize excess capacity and expenses. Projects included in the 2012 budget include the migration of the Fedwire, FedACH, check, accounting, and statistics/reserves systems. Return to text.
