 Print
Print
Freedom of Information Office
2013 Reserve Bank Budgets
Contents
Action
On December 17, 2012, the Board approved the 2013 Reserve Bank operating budgets totaling $3,688.2 million, an increase of $211.9 million, or 6.1 percent, from the 2012 estimated expenses and $242.1 million, or 7.0 percent, from the approved 2012 budget.1,2 The Board also approved the 2013 Reserve Bank, Federal Reserve Information Technology (FRIT), and the Office of Employee Benefits (OEB) capital budgets, which total $492.1 million. The capital budgets are approved with the understanding that approval for actual capital outlays will be in accordance with the Boards Policies and Guidelines Concerning Reserve Bank Operations (FRAM 1-049). The attached statistical information provides details on expenses, staffing, and capital outlays.
The Reserve Banks 2013 budgets reflect salary administration that includes a 3.0 percent merit program, effective January 1 for eligible staff and April 1 for eligible officers and senior professionals. This is consistent with the federal government salary-freeze legislation, which currently extends through March 27, 2013. The salary administration budgets also include funding for equity adjustments and promotions.
Total Expense and Employment Summary
The 2013 operating budgets of the Reserve Banks total $3,688.2 million. The 2013 budget is $211.9 million, or 6.1 percent, higher than the 2012 estimate. Total 2013 projected employment for the Reserve Banks, FRIT, and OEB is 18,656 ANP, an increase of 347 ANP, or 1.9 percent, from 2012 estimated staff levels.3
Table 1
Reserve Bank Expenses and Staffing
(dollars in millions)
2012 Budget
2012 Estimate
2012 Bud. vs.
2012 Est.
2013 Budget
2012 Est. vs.
2013 Bud.
2012 Bud. vs.
2013 Bud.
Amount
Percent
Amount
Percent
Amount
Percent
Central bank services
$2,575.2
$2,594.0
$18.8
0.7%
$2,781.7
$187.7
7.2%
$206.5
8.0%
Treasury services
$474.7
$483.6
$9.0
1.9%
$522.7
$39.1
8.1%
$48.1
10.1%
Priced services
$396.2
$398.6
$2.4
0.6%
$383.8
-$14.9
-3.7%
-$12.5
-3.1%
Total expense1
$3,446.1
$3,476.2
$30.1
0.9%
$3,688.2
$211.9
6.1%
$242.1
7.0%
Supervision
$1,032.5
$1,054.0
$21.5
2.1%
$1,146.3
$92.2
8.8%
$113.7
11.0%
Check
$174.4
$175.8
$1.4
0.8%
$144.2
-$31.6
-18.0%
-$30.3
-17.4%
Total expense, less check and supervision
$2,239.1
$2,246.4
$7.3
0.3%
$2,397.7
$151.3
6.7%
$158.6
7.1%
Total staffing2
18,102
18,308
206
1.1%
18,656
347
1.9%
554
3.1%
Supervision
3,688
3,727
39
1.1%
3,904
177
4.7%
216
5.9%
Check3
459
491
32
6.9%
368
-122
-24.9%
-91
-19.7%
Total expense, less check and supervision
13,955
14,090
135
1.0%
14,383
293
2.1%
428
3.1%
1. The 2012 budget includes an employee equity adjustment of $4.8 million approved in May 2012. Return to table.
2. Staffing is stated in average number of personnel (ANP), which includes the average projected employment at the Reserve Banks, FRIT, and OEB. Return to table.
3. Check staffing includes associated nationally provided support services. Return to table.
The expense growth continues to be driven by increases in central bank functions, primarily in supervision, which represents 31.1 percent of total expenses in 2013. Portfolio growth, workload demand, initiatives to improve analytical capabilities, and ongoing support of the Dodd-Frank Wall Street Reform and Consumer Protection Act (Dodd-Frank Act) drive the budget increase of the supervision function. The cash function also is experiencing an increase due to the CashForward automation project.4 Additionally, the monetary policy function is expanding to meet evolving policy and financial stability responsibilities. Treasury services are rising due to increased demand from the Treasury. These increases are somewhat offset by decreases in priced services costs as a result of continued declines in check volume and improved operational efficiencies in check processing.
Budgeted expenses for 2013, net of revenue and reimbursements, are expected to increase $198.1 million, or 7.8 percent, from 2012 estimated expenses. More than 26 percent of Reserve Bank expenses in the 2013 budget are offset by either priced service revenues (11.5 percent) or reimbursable claims for services provided to the Treasury and other agencies (14.6 percent).5 Budgeted 2013 priced services revenue is 5.0 percent lower than the 2012 estimated level, reflecting continued declines in check volume as customers shift to other payment methods. Reimbursable claims are expected to increase 7.2 percent in 2013, reflecting increased activity on new or expanded Treasury projects.
Table 2
Change in Net Expenses
(dollars in millions)
2012 Budget
2012 Estimate
2013 Budget
Percent change
12B vs. 13B
12E vs. 13B
Total expense
$3,446.1
$3,476.2
$3,688.2
7.0%
6.1%
Less:
Priced services revenue
$436.8
$446.1
$423.9
-3.0%
-5.0%
Reimbursable claims
$497.6
$503.3
$539.4
8.4%
7.2%
Net expenses1
$2,511.7
$2,526.8
$2,724.9
8.5%
7.8%
1. Section 318 of the Dodd-Frank Act directs the Board of Governors to assess a fee to certain bank holding companies and other entities to carry out its supervisory and regulatory responsibilities with respect to such companies. When these assessments, which are based on the System's estimated cost to carry out this function, are implemented, they will further reduce net expenses. Return to table.
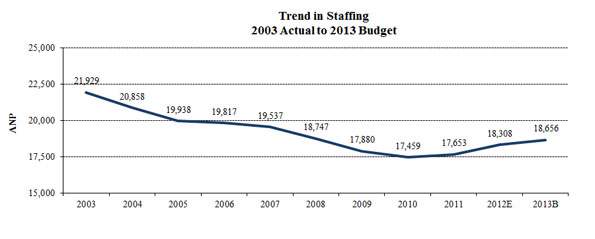
Staffing levels in 2013 are projected to increase 347 ANP, primarily driven by supervision and IT. Supervision is increasing as resources are added to support portfolio growth, workload due to increased supervisory responsibilities, and initiatives to improve the functions analytical capabilities and infrastructure. IT is also a significant driver of increased staffing in order to transition to a consolidated IT services delivery model and to support information security efforts. Treasury services accounts for a slightly smaller portion of the growth in support of the expansion of several programs such as the Invoice Processing Platform.6 These increases are offset by a significant decline in check staff with the transfer of Clevelands check processing function to Atlanta, the implementation of a more efficient check processing platform, and continued volume declines. From 2003 to 2010, total staffing levels declined by 20 percent, primarily the result of the multiyear restructuring efforts in the check-processing function. Subsequent increases reflect hiring, mainly in supervision, initially to address the financial crisis and Dodd-Frank Act implementation as well as portfolio growth. Other areas contributing to the growth include IT, Treasury services, and monetary policy.
2012 Budget Performance
Total 2012 expenses are estimated to be $3,476.2 million, which represents an increase of $30.1 million, or 0.9 percent, from the approved 2012 budget of $3,446.1 million. Total 2012 estimated staffing of 18,308 ANP represents an increase of 206 ANP from 2012 budgeted levels of 18,102 ANP.
The 2012 budget overrun is primarily driven by supervision due to accelerated hiring to meet the responsibilities of the Dodd-Frank Act, additional resources required to support portfolio growth and increased workload, and the initiative to implement a new supervisory framework ($21.5 million).
Treasury services are over budget due to the Treasurys request to expand several existing programs such as Government-Wide Accounting and Do Not Pay and to support new programs such as the Post Payment System and the Financial Information Repository.7 These increases are partially offset by the completion of the Treasury Collateral Management and Monitoring application development project, decline in call volume associated with the Go Direct initiative, and shift in the timing of other initiatives ($9.0 million).8
The overrun in monetary policy is driven by increased support cost charges related to IT services, protection, and facilities. Offsetting these increases are lower personnel expenses resulting from hiring delays for staff with specialized skills.
Partially offsetting the overrun are decreased expenses in public programs resulting from shifts in project timing and the use of support services (-$4.6 million). In addition, the cash area has experienced an underrun due to the refinement of project costs and timing for the CashForward program, which is partially offset by lower-than-projected recoveries from depository institutions related to the recirculation policy.9
Total staffing is over budget by 206 ANP. As detailed in table 3, the overrun reflects staff additions in IT due primarily to an increase in business-line IT projects, support of information security enhancements, and the Reserve Banks server consolidation initiative. Additions in priced services are related to increased resource requirements necessary for the electronic Check 21 environment and for the FedACH Technology Transition project. The overrun in supervision is due to accelerated staffing to support Dodd-Frank Act responsibilities, portfolio growth, increased workload, and the implementation of a new supervisory framework. Offsetting these overruns are decreases in the Treasury services function due to changes in the scope, timing, and alignment of projects and in cash due to operational efficiencies.
Table 3
Significant Staffing (ANP) Changes
2012 Budget to 2012 Estimate
2012 Budget
18,102
Additions:
IT
199
Priced Services (Check/ACH Projects)
39
Supervision
39
Reductions:
Treasury Services
-48
Cash
-19
Other Refinements
-4
2012 Estimate
18,308
Initiatives Affecting the 2013 Budget
The 2013 growth of $211.9 million, or 6.1 percent, in the Reserve Banks budgets reflects several initiatives, primarily in supervision and monetary policy to address resource needs, and in Treasury services and cash operations to fund modernization efforts. A majority of the growth is driven by costs associated with the projected staff increases to support these initiatives. The growth is slightly offset by reductions in check operations.
Central Bank Services
In the central bank services area, which includes supervision, services to financial institutions and the public, and monetary policy, total expenses are increasing $187.7 million, or 7.2 percent, compared to 2012 estimated expenses, and staffing levels are increasing 232 ANP, or 3.0 percent. The largest portion of the increase is in the supervision function, which is increasing $92.2 million, or 8.8 percent, with a corresponding projected staffing growth of 177 ANP. This expansion is in response to portfolio growth and expenses in support of infrastructure needs in a growing business function, as well as ongoing support of the Dodd-Frank Act. Cash operation expenses are increasing $44.0 million, or 8.2 percent, and 19 ANP driven primarily by continued work on the CashForward project as it enters a major development phase. Slightly offsetting the project growth are lower cash operation expenses due to continued operational efficiencies.
Monetary policy total budgeted expenses in 2013 are increasing $41.9 million, or 7.5 percent. Staffing is increasing 30 ANP as several Reserve Banks add resources to meet policy and research demands, as well as to meet expanded responsibilities related to financial stability. Also adding to the expense increase are investments in data and data analytical tools to support policy and research demands.
The increases in central bank services expenses are being partially offset by a decrease of $4.8 million, or 5.6 percent, in expenses related to the loans to depository institutions and others function, primarily in FRB New York, as a result of staffing reductions of 17 ANP and lower professional service fees following the ongoing wind down of the financial stability liquidity facilities created in response to the financial crisis.10
Treasury-Related Functions
The budgeted expenses for services to the Treasury, which are fully reimbursable, show an increase of $39.1 million, or 8.1 percent, in the 2013 budget as the result of large growth in work on several Treasury projects including the accelerated and expanded Invoice Processing Platform, the continuation of the Do Not Pay project, and the new Payment Information Repository and Financial Information Repository projects.11 Overall staffing for the Treasury function is budgeted to increase by 52 ANP in support of these initiatives.
Priced Services
Total priced services expenses are decreasing $14.9 million, or 3.7 percent, from the 2012 estimate. The major driver of the decrease is check operations, which are driving down expenses by $31.6 million, or 18 percent. This decline reflects lower costs primarily associated with the transfer of Clevelands check function to Atlanta and the implementation of the check processing platform modernization initiative. Check staffing levels have a corresponding decrease of 122 ANP, or 24.9 percent, in the 2013 budget. Partially offsetting this decrease are increases of $10.6 million for the Fedwire funds and securities services, primarily due to work for the Fedwire Modernization program.12 Full cost recovery is projected in the aggregate for the priced services in 2013
2013 Personnel Expenses
Reserve Bank officer and staff salaries and other personnel expenses for 2013 total $2,040.6 million, an increase of $139.8 million, or 7.4 percent, over 2012 estimated expenses. The increase reflects costs associated with additional staff and budgeted salary administration, including merit increases, equity adjustments, promotions, and funding for variable pay.
Congress has enacted legislation prohibiting statutory pay adjustments for most federal civilian employees, beginning in January 2011, and recently extended through March 27, 2013. Although not required to do so under the legislation, the Reserve Banks comply with the spirit of the civilian federal government salary freeze enacted by Congress and interpreted in subsequent Office of Personnel Management guidance, which permits increases for staff (but not officers) under performance-based compensation systems such as those used by the Reserve Banks. The 2013 Reserve Bank budgets reflect a 3.0 percent merit program, effective January 1 for eligible staff and April 1 for eligible officers and senior professionals ($44.6 million).13
The 2013 budgets also include funding for equity adjustments, promotions, and variable pay, which will be administered consistent with the salary-freeze legislation. Equity adjustments and promotions total $7.3 million for officers and senior professionals and $18.7 million for staff. Funding for variable pay programs for officers and staff totals $147.1 million, with incremental funding used to address targeted needs in certain areas.
Five-year trend in Reserve Bank expenses
Total expenses for the Reserve Banks have grown an average of 4.1 percent annually from 2008 to the 2013 budget.
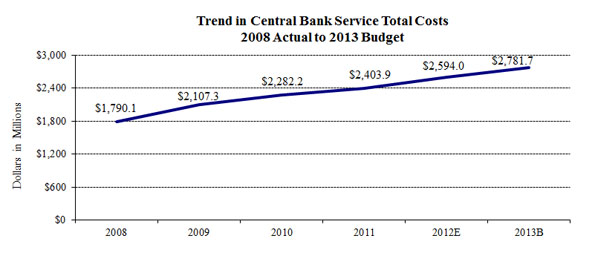
Trends in central bank services total cost
The cost of central bank services has grown an average of 9.2 percent annually over the past five years. Supervision is driving a large portion of this expense increase, with an average of 12.3 percent expense growth per year over the past five years and a corresponding increase of 1,230 ANP since 2008. The additional resources and staffing were added over this period in response to the financial crisis and to implement the Dodd-Frank Act requirements. More recently contributing to the growth is the expansion of resources in response to portfolio growth and to support infrastructure needs. Supervision resource growth is expected to moderate and remain fairly stable going forward, barring any further significant changes in banking conditions. Monetary policy expenses have grown on average 9.1 percent annually. This growth largely follows increases in the open market function in FRB New York driven by the Systems response to the financial crisis, specifically mortgage-backed security fees, staffing resources, and operational and analytical tools to address the increased needs and responsibilities for financial stability monitoring. Increased resources dedicated to regional economic research are also reflected in the monetary policy growth.
Expenses in loans to depository institutions and others have grown at an average annual rate of 17.1 percent over the past five years due to increased resources to support the liquidity programs and other lending activities during the financial crisis. Expenses associated with these activities peaked in 2010 and have since declined. Expenses in the cash area have increased on average 6.1 percent annually, as a multiyear effort to modernize the cash processing and inventory-tracking infrastructure continues. These increases have been partially offset by efficiency improvements in cash operations.
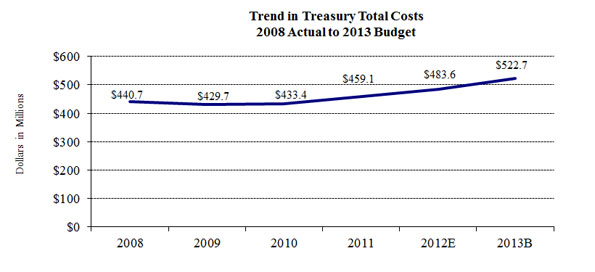
Trends in Treasury services total cost
Treasury services expenses have grown on average 3.5 percent annually since 2008. Costs have increased to meet the Treasurys evolving needs, including continuing initiatives such as the Do Not Pay project, the Treasury Web Application Infrastructure, and other requested projects.14 The past two years have presented a larger increase due to requested projects and related expenses and staffing, including the expanded Invoice Processing Platform initiative and the new Payment Information Repository and Financial Information Repository projects. A portion of the growth has been offset by program changes initiated by the Treasury and reflect efficiency improvements.
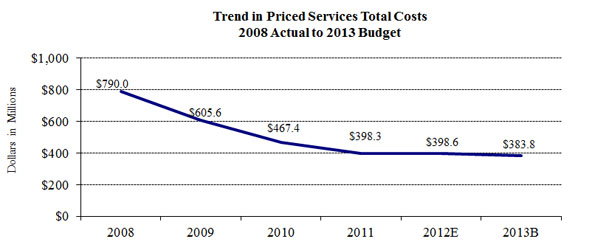
Trends in priced services total cost
Priced services expenses are decreasing at an average of 13.4 percent annually. Check service expenses have declined at an average of 25.2 percent annually since 2008, with the continued decline of paper-check volume. These declines have been slightly offset by increases in Fedwire funds and securities expenses for continued work on the Fedwire Modernization program.
Risks in the 2013 budget
The most significant risks in the 2013 budget are related to staffing. Banks are concerned about the effects of the extended federal pay freeze on hiring and retention, particularly in locations where the employment market is improving. Most Reserve Banks have aggressive hiring plans, and some Banks may experience difficulty meeting schedules for hiring staff with specialized skills and experience, particularly in supervision and IT.
An additional area of budgetary risk involves large-scale automation programs, which are subject to changes in schedules that could cause significant expense variances in 2013. Treasury requests for additional work could also occur. Moreover, the Federal Reserve Bank of New York will likely be incurring costs in 2013 related to Treasurys planned issuance of floating-rate notes.
2013 Capital Plan
The 2013 capital budgets submitted by the Reserve Banks, FRIT, and OEB total $492.1 million, a $13.3 million, or 2.6 percent, decrease from the 2012 estimated levels and 21.8 percent above the 2012 budget. In January 2012, FRB New York incurred an unbudgeted capital outlay of $172.5 million to purchase the 33 Maiden Lane building. The building purchase caused the $101.2 million overrun in the 2012 estimate over the 2012 budget. The effect was partially reduced during the year by project delays in multiyear building and automation initiatives, which shifted the timing of outlays from 2012 to 2013. The capital budgets include funding for projects to support strategies that improve operational efficiencies, enhance services to Bank customers, and ensure a safe and productive work environment. In support of these strategies, the 2013 budgets include three categories of capital initiatives: Reserve Bank automation projects, building and infrastructure, and Treasury initiatives.
The Reserve Banks and FRIT included $236.4 million in funding for major IT initiatives and Reserve Bank automation projects. Multiyear projects currently underway to migrate major applications off the mainframe represent $43.7 million of the 2013 capital budget.15 Cash services initiatives represent $79.3 million of the total capital budgets, including $36.3 million for the CashForward project and $21.4 million for cash sensor upgrades. The Reserve Bank server consolidation effort and related network services account for an additional $9.2 million. The remaining budgets will fund other initiatives, such as data security, scheduled software and equipment upgrades, as well as telecommunications and LAN equipment for renovated or expanded office space.
Building and infrastructure projects represent $207.8 million of the proposed capital budgets. Over half of the total building capital ($135.8 million) is related to projects in the Federal Reserve Banks of Boston, New York, Chicago, and San Francisco, including new initiatives in FRB Chicago to increase security ($24.5 million) and in FRB Boston for reclamation of tenant space for the Banks use ($15.9 million). Other significant projects include the acquisition of emergency generators ($17.5 million) and uninterruptible power source equipment ($20.6 million) at several Banks. The remaining outlays in this category will fund other building renovation and refurbishment projects and various facility improvement projects.
The capital budgets also include $47.9 million for reimbursable Treasury initiatives, including support of Treasury Web Application Infrastructure ($13.7 million), Treasury E-Services ($4.9 million), Government-Wide Accounting ($3.5 million), Post Payment System ($3.5 million), and various other projects.
Table A
Total Expenses of the Federal Reserve Banks, by District
Table B
Total Employment of the Federal Reserve Banks, by District
Table C
Total Expenses of the Federal Reserve Banks, by Functional Area
Table D
Total Employment of the Federal Reserve Banks, by Functional Area
Table E
Components of Compensation of the Federal Reserve Banks, by District
Table F
Capital Outlays of the Federal Reserve Banks, by District
Table G
Capital Outlays of the Federal Reserve Banks, by Category
Notes:
In the following tables, Reserve Bank expenses include those budgeted by FRIT and OEB that are chargeable to the Reserve Banks.
Components may not add to totals because of rounding. Table-to-table comparisons may also differ due to rounding.
Table A
2013 Final Budget
Total Expenses of the Federal Reserve Banks
by District, 2012 and 2013
(dollars in thousands)
District
2012
Budget
2012
Estimate
2013
Budget
Percent change
12B vs. 12E
12E vs. 13B
12B vs. 13B
Boston
177,787
182,601
207,175
2.7%
13.5%
16.5%
New York
848,775
864,787
896,777
1.9%
3.7%
5.7%
Philadelphia
181,466
179,374
198,951
-1.2%
10.9%
9.6%
Cleveland
158,730
154,738
158,372
-2.5%
2.3%
-0.2%
Richmond
342,474
353,053
372,699
3.1%
5.6%
8.8%
Atlanta
314,935
316,589
318,710
0.5%
0.7%
1.2%
Chicago
307,724
306,422
326,131
-0.4%
6.4%
6.0%
St. Louis
234,700
240,076
258,046
2.3%
7.5%
9.9%
Minneapolis
172,645
174,373
189,561
1.0%
8.7%
9.8%
Kansas City
195,327
197,176
214,515
0.9%
8.8%
9.8%
Dallas
207,152
207,142
214,455
0.0%
3.5%
3.5%
San Francisco
304,337
299,899
332,772
-1.5%
11.0%
9.3%
Total
3,446,053
3,476,231
3,688,165
0.9%
6.1%
7.0%
Return to statistical supplement index.
Table B
2013 Final Budget
Total Employment of the Federal Reserve Banks
by District, 2012 and 2013
(average number of personnel)
District
2012
Budget
2012
Estimate
2013
Budget
Change
12B vs. 12E
12E vs. 13B
12B vs. 13B
Boston
968
980
1,080
12
100
112
New York
3,254
3,345
3,326
90
-19
72
Philadelphia
917
900
944
-17
44
27
Cleveland
973
979
908
6
-71
-65
Richmond
1,506
1,497
1,541
-10
45
35
Atlanta
1,593
1,592
1,630
-1
38
37
Chicago
1,425
1,449
1,490
24
42
65
St. Louis
1,006
1,014
1,066
8
52
60
Minneapolis
1,109
1,129
1,147
20
17
37
Kansas City
1,343
1,380
1,430
37
51
87
Dallas
1,340
1,241
1,239
-99
-2
-101
San Francisco
1,568
1,573
1,599
4
26
30
Subtotal
17,003
17,078
17,400
75
323
397
FRIT
1,048
1,181
1,202
132
21
154
OEB
51
50
53
-1
3
2
Total
18,102
18,308
18,656
206
347
554
Return to statistical supplement index
Table C
2013 Final Budget
Total Expenses of the Federal Reserve Banks
by Service Line
(dollars in thousands)
Year
Total
Monetary and economic policy
Services to U.S. Treasury and gov't agencies
Services to financial institutions and the public
Supervision
Fee based services to financial institutions
2008
3,020,762
389,219
440,669
758,595
642,238
790,042
2009
3,142,535
501,297
429,658
880,714
725,253
605,613
2010
3,183,011
497,719
433,417
982,559
801,910
467,404
2011
3,261,320
532,326
459,129
954,111
917,438
398,317
2012E
3,476,231
560,444
483,616
979,508
1,054,017
398,647
2013B
3,688,165
602,317
522,712
1,033,104
1,146,258
383,773
AAGR
2008-2013
4.1%
9.1%
3.5%
6.4%
12.3%
-13.4%
Return to statistical supplement index
Table D
2013 Final Budget
Total Employment of the Federal Reserve Banks1
by Service Line
(average number of personnel)
Year
Total
Monetary and economic policy
Services to U.S. Treasury and gov't agencies
Services to financial institutions
and the public
Supervision
Fee based services to financial institutions
Local support and overhead
Nationally
provided
support
Centralized
service
providers
2008
18,747
1,010
1,220
2,594
2,674
3,064
6,362
957
865
2009
17,880
1,081
1,147
2,727
2,863
1,772
6,461
969
861
2010
17,459
1,115
1,092
2,764
3,052
1,147
6,379
1,037
873
2011
17,653
1,179
1,114
2,646
3,339
910
6,303
1,157
1,003
2012E
18,308
1,229
1,057
2,588
3,727
845
6,474
1,346
1,042
2013B
18,656
1,259
1,108
2,605
3,904
720
6,534
1,426
1,098
AAGR
2008-2013
-0.1%
4.5%
-1.9%
0.1%
7.9%
-25.1%
0.5%
8.3%
4.9%
1. Includes average number of personnel (ANP) at FRIT and OEB. Return to table.
Nationally Provided Support: Support services performed on behalf of multiple Districts under a regionalized or centralized function. In this table, select nationally provided support ANP have been included in the associated service lines.
Centralized Service Providers: Support services provided by FRIT and OEB.
Return to statistical supplement index
Table E
2013 Final Budget
Budgeted Changes to Cash Compensation Programs of the Federal Reserve Banks
Officers and Staff by District, 2013
(dollars in thousands)
District
Total
12/31/12
salary
liability
(a)
Additions to salary base
Incremental
variable pay
(e)
Total
Merit
(b)
Equity
& market adjustments
(c)
Promotions and reclasses
(d)
Percentage
increase to
total 12/31/12
salary liability
(b+c+d) / (a)
Dollars
(b+c+d+e)
Percentage
increase to total 12/31/12 salary liability
(b+c+d+e)/(a)
Boston
97,641
2,809
892
558
4.4%
2,980
7,240
7.4%
New York
397,614
10,977
2,555
6,519
5.0%
6,569
26,620
6.7%
Philadelphia
73,025
2,092
849
650
4.9%
2,712
6,303
8.6%
Cleveland
76,139
1,852
883
583
4.4%
1,411
4,729
6.2%
Richmond
125,580
3,625
450
788
3.9%
1,468
6,330
5.0%
Atlanta
126,786
2,935
440
907
3.4%
4,171
8,454
6.7%
Chicago
134,282
3,017
789
1,261
3.8%
1,844
6,910
5.1%
St. Louis
84,040
2,361
512
767
4.3%
1,303
4,942
5.9%
Minneapolis
84,376
2,456
400
422
3.9%
2,058
5,336
6.3%
Kansas City
99,586
2,880
216
1,228
4.3%
1,448
5,771
5.8%
Dallas
92,779
2,059
437
468
3.2%
1,470
4,434
4.8%
San Francisco
152,380
4,397
883
879
4.0%
981
7,140
4.7%
FRIT
113,452
2,968
1,067
370
3.9%
2,747
7,153
6.3%
OEB
6,535
166
76
125
5.6%
272
639
9.8%
Total
1,664,216
44,593
10,448
15,525
4.2%
31,435
102,002
6.1%
The table above shows the cash compensation components that add to base salary (merit, equity, and promotion) and the 2013 incremental increase in variable pay expense compared to those estimated for 2012. Consistent with the spirit of the salary-freeze legislation, the 2013 Reserve Bank salary administration budgets reflect no merit or equity funding for officers and senior professionals (and no base salary changes for presidents) during the first quarter of the year.
December 31, 2012 Salary Liability: the annualized salary expense based on the salaries in effect on December 31.
Merit: the amount of 2013 budgeted salary expense that reflects the cumulative effect of planned salary increases based on performance.
Equity Adjustments: the amount of 2013 budgeted salary expense to bring individual salaries to the minimum of a grade range or to better align salaries based on internal or external compensation pressures.
Promotions: the amount of 2013 budgeted salary expense that reflects salary increases for individuals as a result of promotions resulting from a significant increase in job responsibilities.
Variable Pay: The change in 2013 budgeted incentive payments (payment for the achievement of pre-determined goals) and cash awards (awards in recognition of exceptional achievements) compared to the 2012 estimate.
The table above provided in previous annual Reserve Bank budget memoranda showed the percentage that the budgeted compensation components were of total budgeted salary-related expenses. This table reflects the percentage these compensation components are of 2012 year-end salary liability.
Table F
2012 Final Budget
Capital Outlays of the Federal Reserve Banks
by District, 2012 and 2013
(dollars in thousands)
District
2012
Budget
2012
Estimate
2013
Budget
Percent change
12B vs. 12E
12E vs. 13B
12B vs. 13B
Boston
29,573
26,405
49,710
-10.7%
88.3%
68.1%
New York
122,319
244,061
122,460
99.5%
-49.8%
0.1%
Philadelphia
15,181
14,132
18,833
-6.9%
33.3%
24.1%
Cleveland
14,471
11,026
15,589
-23.8%
41.4%
7.7%
Richmond
21,797
19,066
32,146
-12.5%
68.6%
47.5%
Atlanta
19,081
18,187
21,874
-4.7%
20.3%
14.6%
Chicago
39,384
25,618
49,923
-35.0%
94.9%
26.8%
St. Louis
8,378
11,998
8,208
43.2%
-31.6%
-2.0%
Minneapolis
15,401
22,087
15,624
43.4%
-29.3%
1.5%
Kansas City
7,160
5,848
8,458
-18.3%
44.6%
18.1%
Dallas
13,385
11,617
15,467
-13.2%
33.1%
15.6%
San Francisco
43,393
26,591
53,137
-38.7%
99.8%
22.5%
Subtotal
349,523
436,636
411,431
24.9%
-5.8%
17.7%
FRIT
53,727
68,488
80,510
27.5%
17.6%
49.9%
OEB
950
289
200
-69.6%
-30.7%
-78.9%
Total
404,200
505,412
492,141
25.0%
-2.6%
21.8%
Return to statistical supplement index
Table G
2012 Final Budget
Capital Outlays of the Federal Reserve Banks1
by Category, 2012 and 2013
(dollars in thousands)
2012
Budget
2012
Estimate
2013
Budget
Percent change
12B vs. 12E
12E vs. 13B
12B vs. 13B
Building / infrastructure projects
177,446
288,008
207,816
62.3%
-27.8%
17.1%
IT & System automation projects
186,352
169,344
236,380
-9.1%
39.6%
26.8%
Treasury initiatives
40,401
48,061
47,945
19.0%
-0.2%
18.7%
Total
404,200
505,412
492,141
25.0%
-2.6%
21.8%
1. Includes capital outlays for the twelve Reserve Banks, FRIT, and OEB. Return to table.
Return to statistical supplement index
Footnotes
1. These expenses include those budgeted by Federal Reserve Information Technology and the Office of Employee Benefits that are chargeable to the Reserve Banks. Expenses exclude assessments for the Board of Governors operating expenses, pension costs, the cost of currency, the Consumer Financial Protection Bureau, and the Office of Financial Research. Return to text.
2. The 2012 budget of $3,446.1 million includes equity funding of $4.8 million that was approved in May 2012 to be used in a targeted manner for staff only. Return to text.
3. ANP is the average number of employees in terms of full-time positions for the period. For instance, a full-time employee who works one-half of the year counts as 0.5 ANP for that calendar year; two half-time employees who work the full year count as 1 ANP. Return to text.
4. CashForward is a cash automation platform that will replace legacy software applications, automate business processes, and employ technologies to meet current and future needs for the cash function. Return to text.
5. Reimbursable claims include the costs of fiscal agency and depository services provided to the U.S. Treasury, other government agencies, and other fiscal principals. Reimbursable claims are slightly higher than Treasury service expenses shown in table 1 because the reimbursable claims also include costs associated with the government's use of the Reserve Banks' check, ACH, Fedwire Funds, and Fedwire Securities services; these costs are included in priced services expense in table 1. Return to text.
6. The Invoice Processing Platform is a secure, web-based system that manages the governments invoicing processes. Return to text.
7. The Government-Wide Accounting program will streamline and modernize the federal governments central accounting and reporting systems to enable better financial management across the government. The Do Not Pay program was established to reduce the number of improper payments made through major programs administered by the federal government. The Post Payment System will streamline post-payment processes and eliminate redundant functionality by consolidating several existing applications into a single, centralized system. The Financial Information Repository is a platform that will consolidate federal government financial information from its various business lines and provide summarized, aggregated, and detailed financial information. Return to text.
8. The Treasury Collateral Management and Monitoring application monitors collateral for the three Treasury Fiscal Service collateral programs: Payment of Federal Taxes and the Treasury Tax and Loan Program, Depositaries and Financial Agents of the Federal Government, and the Acceptance of Bonds Secured by Government Obligations in Lieu of Bonds with Sureties. Go Direct supports Treasurys all-electronic initiative requiring that all federal benefit payments be issued electronically by March 1, 2013. Return to text.
9. Under the recirculation policy, depository institutions are charged a fee if they deposit large amounts of fit $10 and $20 notes and order notes in the same denomination within the same week. Return to text.
10. Although most of the liquidity programs have ended, FRB New York continues to incur costs for several liquidity programs, including Maiden Lane, Maiden Lane II, Maiden Lane III, and Term Asset-Backed Securities Loan Facility. Return to text.
11. The Payment Information Repository is a central repository for all federal payment transaction data and will be used by Treasury and federal agencies. Return to text.
12. The Fedwire Modernization initiative is a large-scale multiyear IT project, the goal of which is to transition the applications that support the Fedwire Funds and Fedwire Securities businesses from the legacy mainframe environment to a distributed platform. Return to text.
13. Consistent with the spirit of the salary-freeze legislation, the 2013 Reserve Bank salary administration budgets reflect no merit or equity funding for officers and senior professionals (and no base salary changes for presidents) during the first quarter of the year. Return to text.
14. The Treasury Web Application Infrastructure is a dedicated, distributed computing environment that houses several Treasury applications. Return to text.
15. The Reserve Bank migration strategy involves moving a majority of applications from the mainframe to alternate processing environments. Projects included in the 2013 budget include the migration of the Fedwire, FedACH, accounting, and statistics/reserves systems. Return to text.
Contents
Action
On December 17, 2012, the Board approved the 2013 Reserve Bank operating budgets totaling $3,688.2 million, an increase of $211.9 million, or 6.1 percent, from the 2012 estimated expenses and $242.1 million, or 7.0 percent, from the approved 2012 budget.1,2 The Board also approved the 2013 Reserve Bank, Federal Reserve Information Technology (FRIT), and the Office of Employee Benefits (OEB) capital budgets, which total $492.1 million. The capital budgets are approved with the understanding that approval for actual capital outlays will be in accordance with the Boards Policies and Guidelines Concerning Reserve Bank Operations (FRAM 1-049). The attached statistical information provides details on expenses, staffing, and capital outlays.
The Reserve Banks 2013 budgets reflect salary administration that includes a 3.0 percent merit program, effective January 1 for eligible staff and April 1 for eligible officers and senior professionals. This is consistent with the federal government salary-freeze legislation, which currently extends through March 27, 2013. The salary administration budgets also include funding for equity adjustments and promotions.
 Return to contents
Total Expense and Employment Summary
The 2013 operating budgets of the Reserve Banks total $3,688.2 million. The 2013 budget is $211.9 million, or 6.1 percent, higher than the 2012 estimate. Total 2013 projected employment for the Reserve Banks, FRIT, and OEB is 18,656 ANP, an increase of 347 ANP, or 1.9 percent, from 2012 estimated staff levels.3
Table 1
Reserve Bank Expenses and Staffing
(dollars in millions)
| 2012 Budget | 2012 Estimate |
2012 Bud. vs. 2012 Est. |
2013 Budget |
2012 Est. vs. 2013 Bud. |
2012 Bud. vs. 2013 Bud. |
||||
|---|---|---|---|---|---|---|---|---|---|
| Amount | Percent | Amount | Percent | Amount | Percent | ||||
| Central bank services | $2,575.2 | $2,594.0 | $18.8 | 0.7% | $2,781.7 | $187.7 | 7.2% | $206.5 | 8.0% |
| Treasury services | $474.7 | $483.6 | $9.0 | 1.9% | $522.7 | $39.1 | 8.1% | $48.1 | 10.1% |
| Priced services | $396.2 | $398.6 | $2.4 | 0.6% | $383.8 | -$14.9 | -3.7% | -$12.5 | -3.1% |
| Total expense1 | $3,446.1 | $3,476.2 | $30.1 | 0.9% | $3,688.2 | $211.9 | 6.1% | $242.1 | 7.0% |
| Supervision | $1,032.5 | $1,054.0 | $21.5 | 2.1% | $1,146.3 | $92.2 | 8.8% | $113.7 | 11.0% |
| Check | $174.4 | $175.8 | $1.4 | 0.8% | $144.2 | -$31.6 | -18.0% | -$30.3 | -17.4% |
| Total expense, less check and supervision | $2,239.1 | $2,246.4 | $7.3 | 0.3% | $2,397.7 | $151.3 | 6.7% | $158.6 | 7.1% |
| Total staffing2 | 18,102 | 18,308 | 206 | 1.1% | 18,656 | 347 | 1.9% | 554 | 3.1% |
| Supervision | 3,688 | 3,727 | 39 | 1.1% | 3,904 | 177 | 4.7% | 216 | 5.9% |
| Check3 | 459 | 491 | 32 | 6.9% | 368 | -122 | -24.9% | -91 | -19.7% |
| Total expense, less check and supervision | 13,955 | 14,090 | 135 | 1.0% | 14,383 | 293 | 2.1% | 428 | 3.1% |
2. Staffing is stated in average number of personnel (ANP), which includes the average projected employment at the Reserve Banks, FRIT, and OEB. Return to table.
3. Check staffing includes associated nationally provided support services. Return to table.
The expense growth continues to be driven by increases in central bank functions, primarily in supervision, which represents 31.1 percent of total expenses in 2013. Portfolio growth, workload demand, initiatives to improve analytical capabilities, and ongoing support of the Dodd-Frank Wall Street Reform and Consumer Protection Act (Dodd-Frank Act) drive the budget increase of the supervision function. The cash function also is experiencing an increase due to the CashForward automation project.4 Additionally, the monetary policy function is expanding to meet evolving policy and financial stability responsibilities. Treasury services are rising due to increased demand from the Treasury. These increases are somewhat offset by decreases in priced services costs as a result of continued declines in check volume and improved operational efficiencies in check processing.
Budgeted expenses for 2013, net of revenue and reimbursements, are expected to increase $198.1 million, or 7.8 percent, from 2012 estimated expenses. More than 26 percent of Reserve Bank expenses in the 2013 budget are offset by either priced service revenues (11.5 percent) or reimbursable claims for services provided to the Treasury and other agencies (14.6 percent).5 Budgeted 2013 priced services revenue is 5.0 percent lower than the 2012 estimated level, reflecting continued declines in check volume as customers shift to other payment methods. Reimbursable claims are expected to increase 7.2 percent in 2013, reflecting increased activity on new or expanded Treasury projects.
Table 2
Change in Net Expenses
(dollars in millions)
| 2012 Budget | 2012 Estimate | 2013 Budget | Percent change | ||
|---|---|---|---|---|---|
| 12B vs. 13B | 12E vs. 13B | ||||
| Total expense | $3,446.1 | $3,476.2 | $3,688.2 | 7.0% | 6.1% |
| Less: | |||||
| Priced services revenue | $436.8 | $446.1 | $423.9 | -3.0% | -5.0% |
| Reimbursable claims | $497.6 | $503.3 | $539.4 | 8.4% | 7.2% |
| Net expenses1 | $2,511.7 | $2,526.8 | $2,724.9 | 8.5% | 7.8% |
Staffing levels in 2013 are projected to increase 347 ANP, primarily driven by supervision and IT. Supervision is increasing as resources are added to support portfolio growth, workload due to increased supervisory responsibilities, and initiatives to improve the functions analytical capabilities and infrastructure. IT is also a significant driver of increased staffing in order to transition to a consolidated IT services delivery model and to support information security efforts. Treasury services accounts for a slightly smaller portion of the growth in support of the expansion of several programs such as the Invoice Processing Platform.6 These increases are offset by a significant decline in check staff with the transfer of Clevelands check processing function to Atlanta, the implementation of a more efficient check processing platform, and continued volume declines. From 2003 to 2010, total staffing levels declined by 20 percent, primarily the result of the multiyear restructuring efforts in the check-processing function. Subsequent increases reflect hiring, mainly in supervision, initially to address the financial crisis and Dodd-Frank Act implementation as well as portfolio growth. Other areas contributing to the growth include IT, Treasury services, and monetary policy.
2012 Budget Performance
Total 2012 expenses are estimated to be $3,476.2 million, which represents an increase of $30.1 million, or 0.9 percent, from the approved 2012 budget of $3,446.1 million. Total 2012 estimated staffing of 18,308 ANP represents an increase of 206 ANP from 2012 budgeted levels of 18,102 ANP.
The 2012 budget overrun is primarily driven by supervision due to accelerated hiring to meet the responsibilities of the Dodd-Frank Act, additional resources required to support portfolio growth and increased workload, and the initiative to implement a new supervisory framework ($21.5 million).
Treasury services are over budget due to the Treasurys request to expand several existing programs such as Government-Wide Accounting and Do Not Pay and to support new programs such as the Post Payment System and the Financial Information Repository.7 These increases are partially offset by the completion of the Treasury Collateral Management and Monitoring application development project, decline in call volume associated with the Go Direct initiative, and shift in the timing of other initiatives ($9.0 million).8
The overrun in monetary policy is driven by increased support cost charges related to IT services, protection, and facilities. Offsetting these increases are lower personnel expenses resulting from hiring delays for staff with specialized skills.
Partially offsetting the overrun are decreased expenses in public programs resulting from shifts in project timing and the use of support services (-$4.6 million). In addition, the cash area has experienced an underrun due to the refinement of project costs and timing for the CashForward program, which is partially offset by lower-than-projected recoveries from depository institutions related to the recirculation policy.9
Total staffing is over budget by 206 ANP. As detailed in table 3, the overrun reflects staff additions in IT due primarily to an increase in business-line IT projects, support of information security enhancements, and the Reserve Banks server consolidation initiative. Additions in priced services are related to increased resource requirements necessary for the electronic Check 21 environment and for the FedACH Technology Transition project. The overrun in supervision is due to accelerated staffing to support Dodd-Frank Act responsibilities, portfolio growth, increased workload, and the implementation of a new supervisory framework. Offsetting these overruns are decreases in the Treasury services function due to changes in the scope, timing, and alignment of projects and in cash due to operational efficiencies.
Table 3
Significant Staffing (ANP) Changes
2012 Budget to 2012 Estimate
| 2012 Budget | 18,102 |
| Additions: | |
| IT | 199 |
| Priced Services (Check/ACH Projects) | 39 |
| Supervision | 39 |
| Reductions: | |
| Treasury Services | -48 |
| Cash | -19 |
| Other Refinements | -4 |
| 2012 Estimate | 18,308 |
Initiatives Affecting the 2013 Budget
The 2013 growth of $211.9 million, or 6.1 percent, in the Reserve Banks budgets reflects several initiatives, primarily in supervision and monetary policy to address resource needs, and in Treasury services and cash operations to fund modernization efforts. A majority of the growth is driven by costs associated with the projected staff increases to support these initiatives. The growth is slightly offset by reductions in check operations.
Central Bank Services
In the central bank services area, which includes supervision, services to financial institutions and the public, and monetary policy, total expenses are increasing $187.7 million, or 7.2 percent, compared to 2012 estimated expenses, and staffing levels are increasing 232 ANP, or 3.0 percent. The largest portion of the increase is in the supervision function, which is increasing $92.2 million, or 8.8 percent, with a corresponding projected staffing growth of 177 ANP. This expansion is in response to portfolio growth and expenses in support of infrastructure needs in a growing business function, as well as ongoing support of the Dodd-Frank Act. Cash operation expenses are increasing $44.0 million, or 8.2 percent, and 19 ANP driven primarily by continued work on the CashForward project as it enters a major development phase. Slightly offsetting the project growth are lower cash operation expenses due to continued operational efficiencies.
Monetary policy total budgeted expenses in 2013 are increasing $41.9 million, or 7.5 percent. Staffing is increasing 30 ANP as several Reserve Banks add resources to meet policy and research demands, as well as to meet expanded responsibilities related to financial stability. Also adding to the expense increase are investments in data and data analytical tools to support policy and research demands.
The increases in central bank services expenses are being partially offset by a decrease of $4.8 million, or 5.6 percent, in expenses related to the loans to depository institutions and others function, primarily in FRB New York, as a result of staffing reductions of 17 ANP and lower professional service fees following the ongoing wind down of the financial stability liquidity facilities created in response to the financial crisis.10
Treasury-Related Functions
The budgeted expenses for services to the Treasury, which are fully reimbursable, show an increase of $39.1 million, or 8.1 percent, in the 2013 budget as the result of large growth in work on several Treasury projects including the accelerated and expanded Invoice Processing Platform, the continuation of the Do Not Pay project, and the new Payment Information Repository and Financial Information Repository projects.11 Overall staffing for the Treasury function is budgeted to increase by 52 ANP in support of these initiatives.
Priced Services
Total priced services expenses are decreasing $14.9 million, or 3.7 percent, from the 2012 estimate. The major driver of the decrease is check operations, which are driving down expenses by $31.6 million, or 18 percent. This decline reflects lower costs primarily associated with the transfer of Clevelands check function to Atlanta and the implementation of the check processing platform modernization initiative. Check staffing levels have a corresponding decrease of 122 ANP, or 24.9 percent, in the 2013 budget. Partially offsetting this decrease are increases of $10.6 million for the Fedwire funds and securities services, primarily due to work for the Fedwire Modernization program.12 Full cost recovery is projected in the aggregate for the priced services in 2013
2013 Personnel Expenses
Reserve Bank officer and staff salaries and other personnel expenses for 2013 total $2,040.6 million, an increase of $139.8 million, or 7.4 percent, over 2012 estimated expenses. The increase reflects costs associated with additional staff and budgeted salary administration, including merit increases, equity adjustments, promotions, and funding for variable pay.
Congress has enacted legislation prohibiting statutory pay adjustments for most federal civilian employees, beginning in January 2011, and recently extended through March 27, 2013. Although not required to do so under the legislation, the Reserve Banks comply with the spirit of the civilian federal government salary freeze enacted by Congress and interpreted in subsequent Office of Personnel Management guidance, which permits increases for staff (but not officers) under performance-based compensation systems such as those used by the Reserve Banks. The 2013 Reserve Bank budgets reflect a 3.0 percent merit program, effective January 1 for eligible staff and April 1 for eligible officers and senior professionals ($44.6 million).13
The 2013 budgets also include funding for equity adjustments, promotions, and variable pay, which will be administered consistent with the salary-freeze legislation. Equity adjustments and promotions total $7.3 million for officers and senior professionals and $18.7 million for staff. Funding for variable pay programs for officers and staff totals $147.1 million, with incremental funding used to address targeted needs in certain areas.
Five-year trend in Reserve Bank expenses
Total expenses for the Reserve Banks have grown an average of 4.1 percent annually from 2008 to the 2013 budget.
Trends in central bank services total cost
The cost of central bank services has grown an average of 9.2 percent annually over the past five years. Supervision is driving a large portion of this expense increase, with an average of 12.3 percent expense growth per year over the past five years and a corresponding increase of 1,230 ANP since 2008. The additional resources and staffing were added over this period in response to the financial crisis and to implement the Dodd-Frank Act requirements. More recently contributing to the growth is the expansion of resources in response to portfolio growth and to support infrastructure needs. Supervision resource growth is expected to moderate and remain fairly stable going forward, barring any further significant changes in banking conditions. Monetary policy expenses have grown on average 9.1 percent annually. This growth largely follows increases in the open market function in FRB New York driven by the Systems response to the financial crisis, specifically mortgage-backed security fees, staffing resources, and operational and analytical tools to address the increased needs and responsibilities for financial stability monitoring. Increased resources dedicated to regional economic research are also reflected in the monetary policy growth.
Expenses in loans to depository institutions and others have grown at an average annual rate of 17.1 percent over the past five years due to increased resources to support the liquidity programs and other lending activities during the financial crisis. Expenses associated with these activities peaked in 2010 and have since declined. Expenses in the cash area have increased on average 6.1 percent annually, as a multiyear effort to modernize the cash processing and inventory-tracking infrastructure continues. These increases have been partially offset by efficiency improvements in cash operations.
Trends in Treasury services total cost
Treasury services expenses have grown on average 3.5 percent annually since 2008. Costs have increased to meet the Treasurys evolving needs, including continuing initiatives such as the Do Not Pay project, the Treasury Web Application Infrastructure, and other requested projects.14 The past two years have presented a larger increase due to requested projects and related expenses and staffing, including the expanded Invoice Processing Platform initiative and the new Payment Information Repository and Financial Information Repository projects. A portion of the growth has been offset by program changes initiated by the Treasury and reflect efficiency improvements.
Trends in priced services total cost
Priced services expenses are decreasing at an average of 13.4 percent annually. Check service expenses have declined at an average of 25.2 percent annually since 2008, with the continued decline of paper-check volume. These declines have been slightly offset by increases in Fedwire funds and securities expenses for continued work on the Fedwire Modernization program.
Risks in the 2013 budget
The most significant risks in the 2013 budget are related to staffing. Banks are concerned about the effects of the extended federal pay freeze on hiring and retention, particularly in locations where the employment market is improving. Most Reserve Banks have aggressive hiring plans, and some Banks may experience difficulty meeting schedules for hiring staff with specialized skills and experience, particularly in supervision and IT.
An additional area of budgetary risk involves large-scale automation programs, which are subject to changes in schedules that could cause significant expense variances in 2013. Treasury requests for additional work could also occur. Moreover, the Federal Reserve Bank of New York will likely be incurring costs in 2013 related to Treasurys planned issuance of floating-rate notes.
2013 Capital Plan
The 2013 capital budgets submitted by the Reserve Banks, FRIT, and OEB total $492.1 million, a $13.3 million, or 2.6 percent, decrease from the 2012 estimated levels and 21.8 percent above the 2012 budget. In January 2012, FRB New York incurred an unbudgeted capital outlay of $172.5 million to purchase the 33 Maiden Lane building. The building purchase caused the $101.2 million overrun in the 2012 estimate over the 2012 budget. The effect was partially reduced during the year by project delays in multiyear building and automation initiatives, which shifted the timing of outlays from 2012 to 2013. The capital budgets include funding for projects to support strategies that improve operational efficiencies, enhance services to Bank customers, and ensure a safe and productive work environment. In support of these strategies, the 2013 budgets include three categories of capital initiatives: Reserve Bank automation projects, building and infrastructure, and Treasury initiatives.
The Reserve Banks and FRIT included $236.4 million in funding for major IT initiatives and Reserve Bank automation projects. Multiyear projects currently underway to migrate major applications off the mainframe represent $43.7 million of the 2013 capital budget.15 Cash services initiatives represent $79.3 million of the total capital budgets, including $36.3 million for the CashForward project and $21.4 million for cash sensor upgrades. The Reserve Bank server consolidation effort and related network services account for an additional $9.2 million. The remaining budgets will fund other initiatives, such as data security, scheduled software and equipment upgrades, as well as telecommunications and LAN equipment for renovated or expanded office space.
Building and infrastructure projects represent $207.8 million of the proposed capital budgets. Over half of the total building capital ($135.8 million) is related to projects in the Federal Reserve Banks of Boston, New York, Chicago, and San Francisco, including new initiatives in FRB Chicago to increase security ($24.5 million) and in FRB Boston for reclamation of tenant space for the Banks use ($15.9 million). Other significant projects include the acquisition of emergency generators ($17.5 million) and uninterruptible power source equipment ($20.6 million) at several Banks. The remaining outlays in this category will fund other building renovation and refurbishment projects and various facility improvement projects.
The capital budgets also include $47.9 million for reimbursable Treasury initiatives, including support of Treasury Web Application Infrastructure ($13.7 million), Treasury E-Services ($4.9 million), Government-Wide Accounting ($3.5 million), Post Payment System ($3.5 million), and various other projects.
| Table A | Total Expenses of the Federal Reserve Banks, by District |
| Table B | Total Employment of the Federal Reserve Banks, by District |
| Table C | Total Expenses of the Federal Reserve Banks, by Functional Area |
| Table D | Total Employment of the Federal Reserve Banks, by Functional Area |
| Table E | Components of Compensation of the Federal Reserve Banks, by District |
| Table F | Capital Outlays of the Federal Reserve Banks, by District |
| Table G | Capital Outlays of the Federal Reserve Banks, by Category |
Notes:
In the following tables, Reserve Bank expenses include those budgeted by FRIT and OEB that are chargeable to the Reserve Banks.
Components may not add to totals because of rounding. Table-to-table comparisons may also differ due to rounding.
Table A
2013 Final Budget
Total Expenses of the Federal Reserve Banks
by District, 2012 and 2013
(dollars in thousands)
| District |
2012 Budget |
2012 Estimate |
2013 Budget |
Percent change | ||
|---|---|---|---|---|---|---|
| 12B vs. 12E | 12E vs. 13B | 12B vs. 13B | ||||
| Boston | 177,787 | 182,601 | 207,175 | 2.7% | 13.5% | 16.5% |
| New York | 848,775 | 864,787 | 896,777 | 1.9% | 3.7% | 5.7% |
| Philadelphia | 181,466 | 179,374 | 198,951 | -1.2% | 10.9% | 9.6% |
| Cleveland | 158,730 | 154,738 | 158,372 | -2.5% | 2.3% | -0.2% |
| Richmond | 342,474 | 353,053 | 372,699 | 3.1% | 5.6% | 8.8% |
| Atlanta | 314,935 | 316,589 | 318,710 | 0.5% | 0.7% | 1.2% |
| Chicago | 307,724 | 306,422 | 326,131 | -0.4% | 6.4% | 6.0% |
| St. Louis | 234,700 | 240,076 | 258,046 | 2.3% | 7.5% | 9.9% |
| Minneapolis | 172,645 | 174,373 | 189,561 | 1.0% | 8.7% | 9.8% |
| Kansas City | 195,327 | 197,176 | 214,515 | 0.9% | 8.8% | 9.8% |
| Dallas | 207,152 | 207,142 | 214,455 | 0.0% | 3.5% | 3.5% |
| San Francisco | 304,337 | 299,899 | 332,772 | -1.5% | 11.0% | 9.3% |
| Total | 3,446,053 | 3,476,231 | 3,688,165 | 0.9% | 6.1% | 7.0% |
Return to statistical supplement index.
Table B
2013 Final Budget
Total Employment of the Federal Reserve Banks
by District, 2012 and 2013
(average number of personnel)
| District |
2012 Budget |
2012 Estimate |
2013 Budget |
Change | ||
|---|---|---|---|---|---|---|
| 12B vs. 12E | 12E vs. 13B | 12B vs. 13B | ||||
| Boston | 968 | 980 | 1,080 | 12 | 100 | 112 |
| New York | 3,254 | 3,345 | 3,326 | 90 | -19 | 72 |
| Philadelphia | 917 | 900 | 944 | -17 | 44 | 27 |
| Cleveland | 973 | 979 | 908 | 6 | -71 | -65 |
| Richmond | 1,506 | 1,497 | 1,541 | -10 | 45 | 35 |
| Atlanta | 1,593 | 1,592 | 1,630 | -1 | 38 | 37 |
| Chicago | 1,425 | 1,449 | 1,490 | 24 | 42 | 65 |
| St. Louis | 1,006 | 1,014 | 1,066 | 8 | 52 | 60 |
| Minneapolis | 1,109 | 1,129 | 1,147 | 20 | 17 | 37 |
| Kansas City | 1,343 | 1,380 | 1,430 | 37 | 51 | 87 |
| Dallas | 1,340 | 1,241 | 1,239 | -99 | -2 | -101 |
| San Francisco | 1,568 | 1,573 | 1,599 | 4 | 26 | 30 |
| Subtotal | 17,003 | 17,078 | 17,400 | 75 | 323 | 397 |
| FRIT | 1,048 | 1,181 | 1,202 | 132 | 21 | 154 |
| OEB | 51 | 50 | 53 | -1 | 3 | 2 |
| Total | 18,102 | 18,308 | 18,656 | 206 | 347 | 554 |
Return to statistical supplement index
Table C
2013 Final Budget
Total Expenses of the Federal Reserve Banks
by Service Line
(dollars in thousands)
| Year | Total | Monetary and economic policy | Services to U.S. Treasury and gov't agencies | Services to financial institutions and the public | Supervision | Fee based services to financial institutions |
|---|---|---|---|---|---|---|
| 2008 | 3,020,762 | 389,219 | 440,669 | 758,595 | 642,238 | 790,042 |
| 2009 | 3,142,535 | 501,297 | 429,658 | 880,714 | 725,253 | 605,613 |
| 2010 | 3,183,011 | 497,719 | 433,417 | 982,559 | 801,910 | 467,404 |
| 2011 | 3,261,320 | 532,326 | 459,129 | 954,111 | 917,438 | 398,317 |
| 2012E | 3,476,231 | 560,444 | 483,616 | 979,508 | 1,054,017 | 398,647 |
| 2013B | 3,688,165 | 602,317 | 522,712 | 1,033,104 | 1,146,258 | 383,773 |
|
AAGR 2008-2013 |
4.1% | 9.1% | 3.5% | 6.4% | 12.3% | -13.4% |
Return to statistical supplement index
Table D
2013 Final Budget
Total Employment of the Federal Reserve Banks1
by Service Line
(average number of personnel)
| Year | Total | Monetary and economic policy | Services to U.S. Treasury and gov't agencies |
Services to financial institutions and the public |
Supervision | Fee based services to financial institutions | Local support and overhead |
Nationally provided support |
Centralized service providers |
|---|---|---|---|---|---|---|---|---|---|
| 2008 | 18,747 | 1,010 | 1,220 | 2,594 | 2,674 | 3,064 | 6,362 | 957 | 865 |
| 2009 | 17,880 | 1,081 | 1,147 | 2,727 | 2,863 | 1,772 | 6,461 | 969 | 861 |
| 2010 | 17,459 | 1,115 | 1,092 | 2,764 | 3,052 | 1,147 | 6,379 | 1,037 | 873 |
| 2011 | 17,653 | 1,179 | 1,114 | 2,646 | 3,339 | 910 | 6,303 | 1,157 | 1,003 |
| 2012E | 18,308 | 1,229 | 1,057 | 2,588 | 3,727 | 845 | 6,474 | 1,346 | 1,042 |
| 2013B | 18,656 | 1,259 | 1,108 | 2,605 | 3,904 | 720 | 6,534 | 1,426 | 1,098 |
|
AAGR 2008-2013 |
-0.1% | 4.5% | -1.9% | 0.1% | 7.9% | -25.1% | 0.5% | 8.3% | 4.9% |
Nationally Provided Support: Support services performed on behalf of multiple Districts under a regionalized or centralized function. In this table, select nationally provided support ANP have been included in the associated service lines.
Centralized Service Providers: Support services provided by FRIT and OEB.
Return to statistical supplement index
Table E
2013 Final Budget
Budgeted Changes to Cash Compensation Programs of the Federal Reserve Banks
Officers and Staff by District, 2013
(dollars in thousands)
| District |
Total 12/31/12 salary liability (a) |
Additions to salary base |
Incremental variable pay (e) |
Total | ||||
|---|---|---|---|---|---|---|---|---|
|
Merit (b) |
Equity & market adjustments (c) |
Promotions and reclasses (d) |
Percentage increase to total 12/31/12 salary liability (b+c+d) / (a) |
Dollars (b+c+d+e) |
Percentage increase to total 12/31/12 salary liability (b+c+d+e)/(a) |
|||
| Boston | 97,641 | 2,809 | 892 | 558 | 4.4% | 2,980 | 7,240 | 7.4% |
| New York | 397,614 | 10,977 | 2,555 | 6,519 | 5.0% | 6,569 | 26,620 | 6.7% |
| Philadelphia | 73,025 | 2,092 | 849 | 650 | 4.9% | 2,712 | 6,303 | 8.6% |
| Cleveland | 76,139 | 1,852 | 883 | 583 | 4.4% | 1,411 | 4,729 | 6.2% |
| Richmond | 125,580 | 3,625 | 450 | 788 | 3.9% | 1,468 | 6,330 | 5.0% |
| Atlanta | 126,786 | 2,935 | 440 | 907 | 3.4% | 4,171 | 8,454 | 6.7% |
| Chicago | 134,282 | 3,017 | 789 | 1,261 | 3.8% | 1,844 | 6,910 | 5.1% |
| St. Louis | 84,040 | 2,361 | 512 | 767 | 4.3% | 1,303 | 4,942 | 5.9% |
| Minneapolis | 84,376 | 2,456 | 400 | 422 | 3.9% | 2,058 | 5,336 | 6.3% |
| Kansas City | 99,586 | 2,880 | 216 | 1,228 | 4.3% | 1,448 | 5,771 | 5.8% |
| Dallas | 92,779 | 2,059 | 437 | 468 | 3.2% | 1,470 | 4,434 | 4.8% |
| San Francisco | 152,380 | 4,397 | 883 | 879 | 4.0% | 981 | 7,140 | 4.7% |
| FRIT | 113,452 | 2,968 | 1,067 | 370 | 3.9% | 2,747 | 7,153 | 6.3% |
| OEB | 6,535 | 166 | 76 | 125 | 5.6% | 272 | 639 | 9.8% |
| Total | 1,664,216 | 44,593 | 10,448 | 15,525 | 4.2% | 31,435 | 102,002 | 6.1% |
December 31, 2012 Salary Liability: the annualized salary expense based on the salaries in effect on December 31.
Merit: the amount of 2013 budgeted salary expense that reflects the cumulative effect of planned salary increases based on performance.
Equity Adjustments: the amount of 2013 budgeted salary expense to bring individual salaries to the minimum of a grade range or to better align salaries based on internal or external compensation pressures.
Promotions: the amount of 2013 budgeted salary expense that reflects salary increases for individuals as a result of promotions resulting from a significant increase in job responsibilities.
Variable Pay: The change in 2013 budgeted incentive payments (payment for the achievement of pre-determined goals) and cash awards (awards in recognition of exceptional achievements) compared to the 2012 estimate.
The table above provided in previous annual Reserve Bank budget memoranda showed the percentage that the budgeted compensation components were of total budgeted salary-related expenses. This table reflects the percentage these compensation components are of 2012 year-end salary liability.
Table F
2012 Final Budget
Capital Outlays of the Federal Reserve Banks
by District, 2012 and 2013
(dollars in thousands)
| District |
2012 Budget |
2012 Estimate |
2013 Budget |
Percent change | ||
|---|---|---|---|---|---|---|
| 12B vs. 12E | 12E vs. 13B | 12B vs. 13B | ||||
| Boston | 29,573 | 26,405 | 49,710 | -10.7% | 88.3% | 68.1% |
| New York | 122,319 | 244,061 | 122,460 | 99.5% | -49.8% | 0.1% |
| Philadelphia | 15,181 | 14,132 | 18,833 | -6.9% | 33.3% | 24.1% |
| Cleveland | 14,471 | 11,026 | 15,589 | -23.8% | 41.4% | 7.7% |
| Richmond | 21,797 | 19,066 | 32,146 | -12.5% | 68.6% | 47.5% |
| Atlanta | 19,081 | 18,187 | 21,874 | -4.7% | 20.3% | 14.6% |
| Chicago | 39,384 | 25,618 | 49,923 | -35.0% | 94.9% | 26.8% |
| St. Louis | 8,378 | 11,998 | 8,208 | 43.2% | -31.6% | -2.0% |
| Minneapolis | 15,401 | 22,087 | 15,624 | 43.4% | -29.3% | 1.5% |
| Kansas City | 7,160 | 5,848 | 8,458 | -18.3% | 44.6% | 18.1% |
| Dallas | 13,385 | 11,617 | 15,467 | -13.2% | 33.1% | 15.6% |
| San Francisco | 43,393 | 26,591 | 53,137 | -38.7% | 99.8% | 22.5% |
| Subtotal | 349,523 | 436,636 | 411,431 | 24.9% | -5.8% | 17.7% |
| FRIT | 53,727 | 68,488 | 80,510 | 27.5% | 17.6% | 49.9% |
| OEB | 950 | 289 | 200 | -69.6% | -30.7% | -78.9% |
| Total | 404,200 | 505,412 | 492,141 | 25.0% | -2.6% | 21.8% |
Return to statistical supplement index
Table G
2012 Final Budget
Capital Outlays of the Federal Reserve Banks1
by Category, 2012 and 2013
(dollars in thousands)
|
2012 Budget |
2012 Estimate |
2013 Budget |
Percent change | |||
|---|---|---|---|---|---|---|
| 12B vs. 12E | 12E vs. 13B | 12B vs. 13B | ||||
| Building / infrastructure projects | 177,446 | 288,008 | 207,816 | 62.3% | -27.8% | 17.1% |
| IT & System automation projects | 186,352 | 169,344 | 236,380 | -9.1% | 39.6% | 26.8% |
| Treasury initiatives | 40,401 | 48,061 | 47,945 | 19.0% | -0.2% | 18.7% |
| Total | 404,200 | 505,412 | 492,141 | 25.0% | -2.6% | 21.8% |
Return to statistical supplement index
Footnotes
1. These expenses include those budgeted by Federal Reserve Information Technology and the Office of Employee Benefits that are chargeable to the Reserve Banks. Expenses exclude assessments for the Board of Governors operating expenses, pension costs, the cost of currency, the Consumer Financial Protection Bureau, and the Office of Financial Research. Return to text.
2. The 2012 budget of $3,446.1 million includes equity funding of $4.8 million that was approved in May 2012 to be used in a targeted manner for staff only. Return to text.
3. ANP is the average number of employees in terms of full-time positions for the period. For instance, a full-time employee who works one-half of the year counts as 0.5 ANP for that calendar year; two half-time employees who work the full year count as 1 ANP. Return to text.
4. CashForward is a cash automation platform that will replace legacy software applications, automate business processes, and employ technologies to meet current and future needs for the cash function. Return to text.
5. Reimbursable claims include the costs of fiscal agency and depository services provided to the U.S. Treasury, other government agencies, and other fiscal principals. Reimbursable claims are slightly higher than Treasury service expenses shown in table 1 because the reimbursable claims also include costs associated with the government's use of the Reserve Banks' check, ACH, Fedwire Funds, and Fedwire Securities services; these costs are included in priced services expense in table 1. Return to text.
6. The Invoice Processing Platform is a secure, web-based system that manages the governments invoicing processes. Return to text.
7. The Government-Wide Accounting program will streamline and modernize the federal governments central accounting and reporting systems to enable better financial management across the government. The Do Not Pay program was established to reduce the number of improper payments made through major programs administered by the federal government. The Post Payment System will streamline post-payment processes and eliminate redundant functionality by consolidating several existing applications into a single, centralized system. The Financial Information Repository is a platform that will consolidate federal government financial information from its various business lines and provide summarized, aggregated, and detailed financial information. Return to text.
8. The Treasury Collateral Management and Monitoring application monitors collateral for the three Treasury Fiscal Service collateral programs: Payment of Federal Taxes and the Treasury Tax and Loan Program, Depositaries and Financial Agents of the Federal Government, and the Acceptance of Bonds Secured by Government Obligations in Lieu of Bonds with Sureties. Go Direct supports Treasurys all-electronic initiative requiring that all federal benefit payments be issued electronically by March 1, 2013. Return to text.
9. Under the recirculation policy, depository institutions are charged a fee if they deposit large amounts of fit $10 and $20 notes and order notes in the same denomination within the same week. Return to text.
10. Although most of the liquidity programs have ended, FRB New York continues to incur costs for several liquidity programs, including Maiden Lane, Maiden Lane II, Maiden Lane III, and Term Asset-Backed Securities Loan Facility. Return to text.
11. The Payment Information Repository is a central repository for all federal payment transaction data and will be used by Treasury and federal agencies. Return to text.
12. The Fedwire Modernization initiative is a large-scale multiyear IT project, the goal of which is to transition the applications that support the Fedwire Funds and Fedwire Securities businesses from the legacy mainframe environment to a distributed platform. Return to text.
13. Consistent with the spirit of the salary-freeze legislation, the 2013 Reserve Bank salary administration budgets reflect no merit or equity funding for officers and senior professionals (and no base salary changes for presidents) during the first quarter of the year. Return to text.
14. The Treasury Web Application Infrastructure is a dedicated, distributed computing environment that houses several Treasury applications. Return to text.
15. The Reserve Bank migration strategy involves moving a majority of applications from the mainframe to alternate processing environments. Projects included in the 2013 budget include the migration of the Fedwire, FedACH, accounting, and statistics/reserves systems. Return to text.
