 Print
Print
Freedom of Information Office
2016 Reserve Bank Budgets
Contents
Action
On December 16, 2015, the Board approved the 2016 Reserve Bank operating budgets totaling $4,116.6 million, an increase of $219.9 million, or 5.6 percent, from the 2015 estimated expenses and $147.9 million, or 3.7 percent, from the approved 2015 budget.1 The Board also approved the Reserve Bank, Federal Reserve Information Technology (FRIT), and the Office of Employee Benefits (OEB) capital budgets, which total $696.7, of which $403.8 million is budgeted in 2016.2
The Board approved the Reserve Banks' single and multiyear capital budgets. In previous years, the Board approved a single-year capital budget that included only the current portion of multiyear expenditures and the single-year initiatives. The chair of the Bank Affairs Committee designated certain projects as strategic or sensitive; the Reserve Banks are required to provide further information about these projects and obtain approval from the director of RBOPS prior to committing funds.3
Total Expense and Employment Summary
Table 1
Reserve Bank Expenses and Staffing
(dollars in millions)
| 2015 Budget | 2015 Estimate | 15E to 15B | 2016 Budget | 16B to 15E | 16B to 15B | ||||
|---|---|---|---|---|---|---|---|---|---|
| Amount | Percent | Amount | Percent | Amount | Percent | ||||
| Central Bank Services | $2,970.5 | $2,945.1 | -$25.4 | -0.9% | $3,087.7 | $142.6 | 4.8% | $117.2 | 3.9% |
| Monetary Policy | 443.7 | 444.8 | 1.1 | 0.3% | 460.9 | 16.1 | 3.6% | 17.2 | 3.9% |
| Open Market | 193.1 | 189.3 | -3.8 | -1.9% | 202.9 | 13.6 | 7.2% | 9.8 | 5.1% |
| Public Programs | 207.8 | 209.9 | 2.1 | 1.0% | 217.5 | 7.6 | 3.6% | 9.7 | 4.7% |
| Supervision | 1,260.2 | 1,253.6 | -6.5 | -0.5% | 1,311.6 | 58.0 | 4.6% | 51.5 | 4.1% |
| Cash | 593.6 | 585.0 | -8.7 | -1.5% | 619.7 | 34.8 | 5.9% | 26.1 | 4.4% |
| Loans to Depository Institutions | 78.1 | 76.5 | -1.6 | -2.0% | 76.6 | 0.0 | 0.1% | -1.5 | -1.9% |
| All Other Central Bank Services1 | 194.1 | 186.0 | -8.1 | -4.2% | 198.6 | 12.6 | 6.8% | 4.5 | 2.3% |
| Treasury Services | 579.9 | 556.6 | -23.3 | -4.0% | 605.6 | 49.0 | 8.8% | 25.7 | 4.4% |
| Fee-Based Services2 | 418.2 | 395.0 | -23.2 | -5.6% | 423.3 | 28.2 | 7.1% | 5.0 | 1.2% |
| Total Expense | $3,968.7 | $3,896.7 | -$72.0 | -1.8% | $4,116.6 | $219.9 | 5.6% | $147.9 | 3.7% |
|
Total ANP |
19,295 |
19,022 |
-273 |
-1.4% |
19,424 |
401 |
2.1% |
128 |
0.7% |
|
1 Includes Reserve Accounts and Risk Administration and Services to Other Central Banks. Return to table. 2 Fee-based services are all expenses associated with the Priced Services, including the check service, the FedACH Service, the Fedwire Funds and National Settlement Services, and Fedwire Securities Service. Return to table. |
|||||||||
Discussion
2015 Budget Performance
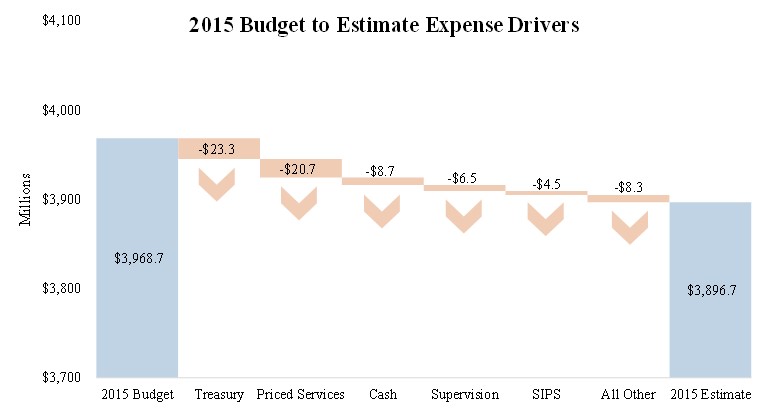
Total 2015 operating expenses for the Reserve Banks are estimated to be $3,896.7 million, which is $72.0 million, or 1.8 percent, less than the approved 2015 budget of $3,968.7 million. Estimated ANP is less than the 2015 budget, largely because of changes in project plans, turnover, and hiring delays.4
The 2015 budget underrun is primarily driven by program changes for several multiyear initiatives, including those related to the Treasury Web Application Infrastructure (TWAI), the fiscal agent consolidation, Fedwire modernization, and the CashForward project.5, 6, 7 Expenses associated with the Federal Reserve's initiatives included in the January 2015 Strategies for Improving the U.S. Payment System (SIPS) project are somewhat lower than budgeted for the year as onboarding of staff and other support took longer than planned.8
System expenses are also lower as a result of continued efficiencies gained from the check server platform migration, the FedLine application conversion, and the implementation of the cash evolving operations initiative. In addition, check and cash services experienced greater volume declines than anticipated. Higher-than-expected recoveries for currency cross-shipping also contribute to the underrun. Other expenses are expected to decline primarily due to the deferral of development efforts for the Fedwire Scan application.
Total 2015 estimated employment for the Reserve Banks, FRIT, and OEB is 19,022 ANP, an underrun of 273 ANP, or 1.4 percent, from 2015 budgeted staff levels. The underruns are primarily in Treasury, cash, and support services. In the Treasury function, resource reductions are in response to revised program plans and accelerated attrition related to the fiscal agent consolidation. The cash resource reductions reflect the implementation of the evolving operations efficiency initiative. Support services and all other areas reflect turnover and hiring delays.
2016 Budgeted Operating Expenses
The 2016 operating budgets of the Reserve Banks total $4,116.6 million, which is $219.9 million, or 5.6 percent, higher than the 2015 estimate. The increase is primarily to fill staffing needs in supervision, Treasury, and monetary policy and for large development projects that support cash and the priced services. The largest increase is in the supervision function, which represents approximately one-third of total expenses budgeted in 2016. The growth in supervision continues to be driven by expanded supervisory responsibilities, primarily for large financial institutions, and national supervision initiatives.
Budgeted expenses for services to the Treasury, which are fully reimbursable, are increasing primarily to support the TWAI ($8.5 million), the full implementation of NavyCash ($10.5 million), the assumption of the Collections Information Repository (CIR) ($5.3 million), the expansion of the Financial Information Repository (FIR) to accommodate the requirements of the Digital Accountability and Transparency (DATA) Act ($3.3 million), and the myRA and Retail Program Review initiatives ($3.5 million). Additional growth budgeted in 2016 related to application development and technology modernization for several Treasury initiatives is partially offset by anticipated operational efficiencies.
In the monetary policy and public programs areas, several Reserve Banks are filling research, policy, and outreach staff positions. Expenses for open market trading, largely for automation efforts, and the allocated costs for law enforcement are also projected to increase.
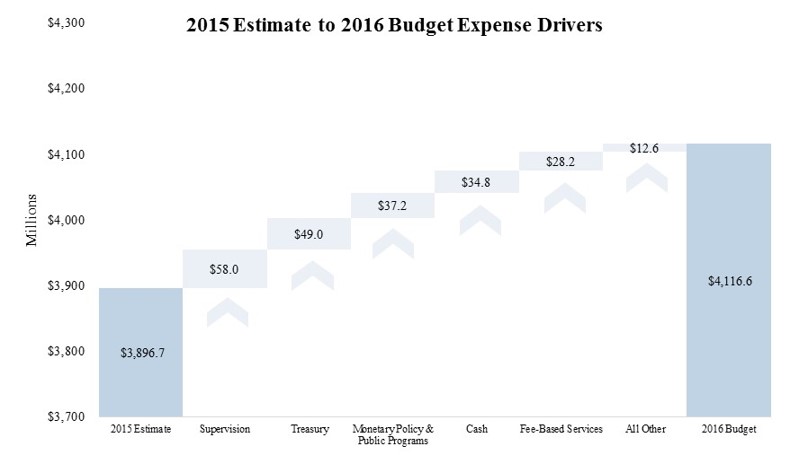
Increases in cash expenses are related to the implementation of the CashForward project and the roll-out of next-generation currency processing machines, as well as the allocated law enforcement and facilities support.
Priced services expenses are expected to increase for the ACH platform modernization project and investments in development efforts for Fedwire; including application architecture upgrades, amortization for completed development, and post-modernization initiatives.
Other increases include the System's continued investment in the SIPS program and liaison and outreach for international institutions.
2016 Personnel Expenses and Staffing
Total 2016 budgeted employment for the Reserve Banks, FRIT, and OEB is 19,424 ANP, an increase of 401 ANP, or 2.1 percent, from 2015 estimated staff levels. The increase is primarily driven by the Treasury, supervision, and support and overhead functions. In the Treasury function, ANP increases are due to the assumption of new business lines from commercial banks and updated requirements for ongoing projects. Supervision ANP is increasing as resources are added for expanded responsibilities and associated new supervisory programs for the largest supervisory portfolios and for national supervision initiatives.
Support and overhead increases include additional resources for information technology (IT), facilities, internal audit, and corporate planning. Additional ANP are also planned to support the SIPS program.
Reserve Bank officer and staff salaries and other personnel expenses for 2016 total $2,354.5 million, an increase of $127.6 million, or 5.7 percent, from 2015 estimated expenses. The increase reflects expenses associated with additional staff and budgeted salary adjustments, including merit increases, equity adjustments, promotions, and funding for variable pay.
2016 Operating expenses, net of revenue and reimbursements
More than 25 percent of Reserve Bank expenses in the 2016 budget are offset by either priced service revenues (10.4 percent) or reimbursable claims for services provided to the Treasury and other agencies (15.9 percent).9 Budgeted 2016 operating expenses, net of revenue and reimbursements, are expected to increase $207.0 million, or 7.3 percent, from 2015 estimated expenses.10
Based on their final budgets, the Reserve Banks have lowered their projected 2016 priced services cost-recovery rate from 101.9 percent to 101.4 percent.11 Although the Reserve Banks project that the check service will fully recover its costs, they project slight underrecovery of costs (including imputed return on equity) for the remaining priced services because of investment costs associated with multiyear technology initiatives to modernize their processing platforms and investments in Fedwire resiliency. Budgeted 2016 priced services revenue is 0.1 percent lower than the 2015 estimated level.
Table 2
Change in Net Expenses
(dollars in millions)
|
2015 Budget |
2015 Estimate |
2016 Budget |
Percent Change | ||
|---|---|---|---|---|---|
| 15E vs. 15B | 16B vs. 15E | ||||
| Total Expense | $3,968.7 | $3,896.7 | $4,116.6 | -1.8% | 5.6% |
| Less: | |||||
| Priced Services Revenue* | 414.4 | 427.0 | 426.8 | 3.0% | -0.1% |
| Reimbursable Claims | 626.1 | 639.4 | 652.6 | 2.1% | 2.1% |
| Net Expenses | $2,928.2 | $2,830.2 | $3,037.3 | -3.3% | 7.3% |
| * Full cost recovery is projected in the aggregate for priced services in 2016. Return to table. | |||||
Reimbursable claims are expected to increase 2.1 percent in 2016, reflecting increased activity for new or expanded Treasury services and increased costs for ACH and Securities services.
2016 Capital Budgets
The 2016 capital budgets submitted by the Reserve Banks, FRIT, and OEB total $403.8 million. The increase in the 2016 capital budget is $37.7 million, or 10.3 percent, above the 2015 estimated levels of $366.2 million, largely reflecting ongoing multiyear building and information technology projects. New initiatives in the 2016 capital budget support the ACH modernization efforts, application upgrades and releases, and security enhancements. The committee chair designated a portion of these budgets, $125.3 million in 2016, as strategic or sensitive, requiring additional review and approval by the RBOPS director. The remainder of the budgets was approved in two categories: 1) approval for significant capital expenditures for 2016 and the remaining term of these projects ($305.0 million), and 2) single-year approval for all other capital expenditures by asset class ($111.8 million).
Capital expenditures designated as strategic or sensitive
The chair of the Committee on Federal Reserve Bank Affairs designated as strategic or sensitive budgeted 2016 expenditures of $125.3 million and total multiyear budgeted expenditures of $279.9 million for 2016 and future years. The expenditures designated as strategic and sensitive include projects to migrate major applications off the mainframe with budgeted 2016 expenditures of $18.4 million and total multiyear budgeted expenditures of $32.5 million for 2016 and future years.12 Cash automation initiatives include $23.6 million for the CashForward project. Other expenditures include large-scale building projects to optimize office space, renovate conference center and cafeteria space, and mechanical and electrical infrastructure upgrades.
Table 3
2016 Capital Budget
(dollars in millions)
| 2016 Capital | 2017 and Beyond Capital | Total | |
|---|---|---|---|
| Capital expenditures designated as strategic or sensitive1 | $125.3 | $154.7 | $279.9 |
| Projects previously designated | 100.4 | 95.9 | 196.3 |
| New strategic or sensitive projects | 24.9 | 58.8 | 83.7 |
| Other significant capital expenditures | 166.8 | 138.2 | 305.0 |
| Other capital expenditures | 111.8 | 111.8 | |
| Art | 0.2 | 0.2 | |
| Building | 18.0 | 18.0 | |
| Building, Machinery, & Equipment | 14.1 | 14.1 | |
| Equipment | 46.7 | 46.7 | |
| Furniture, Furnishings, & Fixtures | 6.4 | 6.4 | |
| Land Improvements | 0.6 | 0.6 | |
| Software | 25.9 | 25.9 | |
| Total Capital Budget2 | $403.8 | $292.9 | $696.7 |
|
1 Previously designated projects may include amounts that have already been approved by the Director of RBOPS that are not reflected on this chart. Return to table. 2Excludes $1.0 million for the cancelled End-to-End Billing project at FRB Dallas. Return to table. |
|||
Other significant capital expenditures
Significant capital expenditures (expenditures exceeding $1 million) that have not been designated strategic or sensitive comprise budgeted 2016 expenditures of $166.8 million and total multiyear budgeted expenditures of $305.0 million for 2016 and future years. Projects in this category include investments in analytical, technological, and operational tools for monetary policy, support for supervisory responsibilities, and IT support for Treasury initiatives. Building expenditures include office space renovations, security enhancements, and elevator upgrades.
Other capital expenditures
The 2016 capital budgets include $111.8 million for other capital expenditures. These projects are typically single-year smaller building maintenance expenditures, equipment and furniture replacements, and scheduled software and equipment upgrades.
Five-Year Trend in Reserve Bank Expenses
Total expenses for the Reserve Banks have grown an average of 4.8 percent annually from 2011 actual through the 2016 budget.
Table 4
Total Expenses of the Federal Reserve Banks, by Functional Area
(dollars in millions)
|
2011 Actual |
2012 Actual |
2013 Actual |
2014 Actual |
2015 Estimate |
2016 Budget |
CAGR* 2011-2016 |
|
|---|---|---|---|---|---|---|---|
| Monetary and Economic Policy | $532.3 | $563.3 | $596.5 | $609.2 | $634.1 | $663.8 | 4.5% |
| Services to U.S. Treasury and Gov't Agencies | 459.1 | 477.3 | 500.5 | 531.7 | 556.6 | 605.6 | 5.7% |
| Services to Financial Institutions and the Public | 954.1 | 977.5 | 1,003.4 | 1,032.7 | 1,057.4 | 1,112.3 | 3.1% |
| Supervision | 917.4 | 1,056.6 | 1,118.8 | 1,168.5 | 1,253.6 | 1,311.6 | 7.4% |
| Fee-Based Services to Financial Institutions | 398.3 | 387.5 | 372.4 | 410.3 | 395.0 | 423.3 | 1.2% |
| Total | $3,261.3 | $3,462.1 | $3,591.6 | $3,752.3 | $3,896.7 | $4,116.6 | 4.8% |
|
*Compound Annual Growth Rate Return to table. |
|||||||
Trends in Central Bank Total Expense
Expenses for central bank functions, which comprises monetary and economic policy, services to financial institutions and the public, and supervision, have grown an average of 5.1 percent annually over the past five years. Supervision is driving a large portion of this expense increase, with an average of 7.4 percent expense growth per year over the past five years and a corresponding increase of 748 ANP since 2011. The additional resources and staffing were added over this period in response to the financial crisis and to implement the Dodd-Frank Act requirements. Growth in investments enhance supervision's capabilities to fulfill its expanded responsibilities. The direct cost growth rate is beginning to moderate as conditions of supervised financial institutions improve.
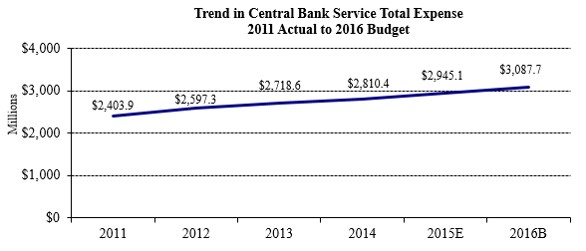
Monetary policy expenses have grown on average 4.5 percent annually. This growth is largely driven by increases at the Federal Reserve Bank of New York. Rapid growth during the financial crisis has been followed by a focus on improving operational capabilities and restructuring analytical, technological, and operational activities to address the increased needs and responsibilities for financial stability monitoring. The Bank is also developing a sustainable technology platform to support post-crisis policy efforts. Growth in monetary policy expenses also reflects increased resources dedicated to regional economic research.
Expenses in the cash area have increased on average 3.8 percent annually, as a multiyear effort to modernize the cash processing and inventory-tracking infrastructure nears completion. These increases have been partially offset by lower costs due to efficiency improvements in cash operations.
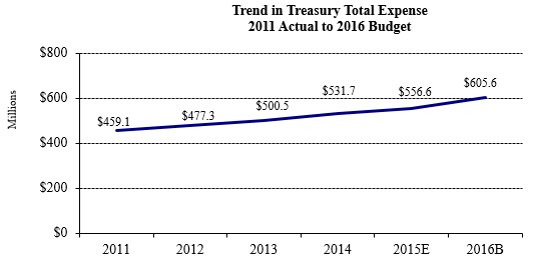
Trends in Treasury Services Expense
Treasury services expenses are projected to grow on average 5.7 percent annually since 2011. Expenses have increased to meet Treasury's evolving needs, including the automation of Treasury's collection and payment services, the addition of Treasury applications to the TWAI, and other requested projects. Growth in recent years is largely attributable to CIR, expansion of FIR to accommodate requirements of the DATA Act, and the addition of NavyCash to the Stored Value Card initiatives. A portion of this growth has been offset by staffing reductions and program changes initiated by the Treasury, including the Treasury Retail Securities consolidation effort.
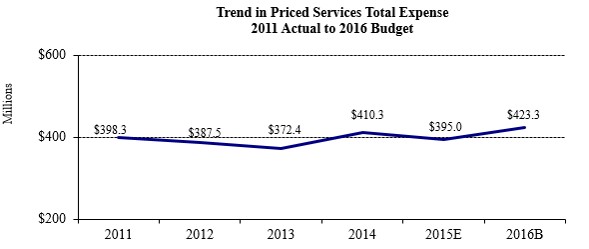
Trends in Priced Services Total Expense
Priced services expenses have increased at an average of 1.2 percent annually. Cost increases are primarily for investments associated with multiyear technology initiatives to modernize processing platforms for Fedwire and ACH. These investments are expected to enhance efficiency, the overall quality of operations, and the Reserve Banks' ability to offer additional services to depository institutions. Partially offsetting these investments are check services expenses, which have declined an average of 7.7 percent annually since 2011, due to the decline of paper-check volume and the efficiencies associated with electronic check processing.
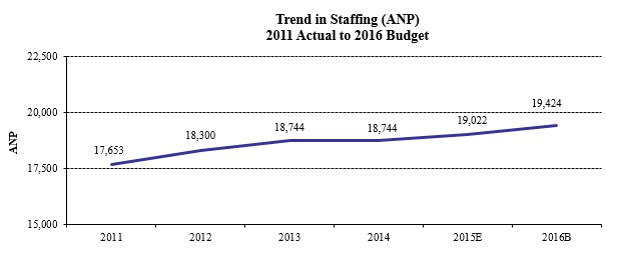
Trends in Staffing
Total staffing levels are increasing at an average of 1.9 percent annually since 2011. The primary driver is in local and national IT to support large application development projects, information security efforts, and the central computing environment. Supervision resource levels were augmented to address supervision's capabilities to fulfill its responsibilities, including those added by both the Dodd-Frank Act implementation and portfolio growth. New and ongoing Treasury-directed initiatives account for staffing increases in Treasury services. Monetary policy areas have grown modestly to support financial stability monitoring and operational activities. These increases are offset, in part, by decreased staffing in priced services and cash functions.
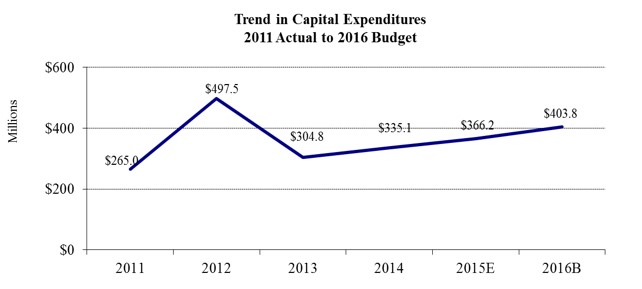
Trends in Capital
Total capital spending is increasing at an average of 8.8% annually since 2011. The sharp increase in 2012 is due to FRB New York's purchase of the 33 Maiden Lane building.
Risks in the 2016 Budget
The most significant risks in the 2016 budget are related to personnel. Changes in benefit assumptions related to the discount rate and updated demographic information would affect the personnel expenses that are reflected in Reserve Bank budgets. Additionally, Banks are concerned about their ability to retain, hire, and replace staff. A number of Reserve Banks have aggressive hiring plans, and some Banks may experience difficulty meeting schedules for hiring staff with specialized skills and experience, particularly in supervision and IT. The primary operating risks in supervision relate to the implementation of key supervisory responsibilities under the Dodd-Frank Act that still require final rulemaking and changing supervisory programs. Increased focus on cybersecurity and application modernization may affect IT spending decisions. The Treasury's fiscal agent consolidation effort will continue to affect projects in 2016 and over a longer term planning horizon, as project decision requirements are refined.
Appendix
Statistical Supplement
| Table A | Total Expenses of the Federal Reserve Banks, by District |
| Table B | Total Employment of the Federal Reserve Banks, by District |
| Table C | Total Employment of the Federal Reserve Banks, by Functional Area |
| Table D | Budgeted Changes to the Cash Compensation Components of the Federal Reserve Banks, Officers and Staff, by District |
| Table E | Capital Outlays of the Federal Reserve Banks, by District |
Notes:
In the following tables, Reserve Bank expenses include those budgeted by FRIT and OEB that are chargeable to the Reserve Banks.
Components may not add to totals because of rounding. Table-to-table comparisons may also differ due to rounding.
Table A
Total Expenses of the Federal Reserve Banks
by District, 2015 and 2016
(dollars in thousands)
| District |
2015 Budget |
2015 Estimate |
2016 Budget |
Variance | ||
|---|---|---|---|---|---|---|
| 15E vs. 15B | 16B vs. 15E | 16B vs. 15B | ||||
| Boston | 231,598 | 226,913 | 236,482 | -2.0% | 4.2% | 2.1% |
| New York | 938,292 | 919,799 | 969,209 | -2.0% | 5.4% | 3.3% |
| Philadelphia | 200,805 | 196,595 | 194,010 | -2.1% | -1.3% | -3.4% |
| Cleveland | 173,463 | 169,927 | 183,907 | -2.0% | 8.2% | 6.0% |
| Richmond | 359,688 | 367,426 | 352,315 | 2.2% | -4.1% | -2.0% |
| Atlanta | 323,023 | 317,349 | 335,808 | -1.8% | 5.8% | 4.0% |
| Chicago | 356,634 | 354,179 | 369,547 | -0.7% | 4.3% | 3.6% |
| St. Louis | 335,373 | 325,729 | 374,243 | -2.9% | 14.9% | 11.6% |
| Minneapolis | 214,535 | 201,797 | 214,060 | -5.9% | 6.1% | -0.2% |
| Kansas City | 255,317 | 245,064 | 277,339 | -4.0% | 13.2% | 8.6% |
| Dallas | 223,263 | 220,219 | 231,059 | -1.4% | 4.9% | 3.5% |
| San Francisco | 356,686 | 351,719 | 378,598 | -1.4% | 7.6 | 6.1% |
| Total | 3,968,677 | 3,896,718 | 4,116,578 | -1.8% | 5.6% | 3.7% |
Return to statistical supplement index
Table B
Total Employment of the Federal Reserve Banks
by District, 2015 and 2016
(average number of personnel)
| District |
2015 Budget |
2015 Estimate |
2016 Budget |
Variance | ||
|---|---|---|---|---|---|---|
| 15E vs. 15B | 16B vs. 15E | 16B vs. 15B | ||||
| Boston | 1,109 | 1,082 | 1,130 | -28 | 49 | 21 |
| New York | 3,294 | 3,235 | 3,311 | -60 | 77 | 17 |
| Philadelphia | 921 | 900 | 892 | -20 | -8 | -29 |
| Cleveland | 990 | 963 | 1,010 | -26 | 47 | 21 |
| Richmond | 1,546 | 1,549 | 1,475 | 3 | -74 | -71 |
| Atlanta | 1,594 | 1,573 | 1,573 | -21 | 0 | -21 |
| Chicago | 1,529 | 1,516 | 1,551 | -13 | 35 | 22 |
| St. Louis | 1,246 | 1,247 | 1,356 | 2 | 109 | 110 |
| Minneapolis | 1,114 | 1,072 | 1,105 | -42 | 33 | -9 |
| Kansas City | 1,688 | 1,608 | 1,722 | -80 | 114 | 34 |
| Dallas | 1,267 | 1,250 | 1,280 | -18 | 30 | 12 |
| San Francisco | 1,700 | 1,696 | 1,695 | -4 | -1 | -5 |
| Subtotal | 17,998 | 17,691 | 18,101 | -307 | 410 | 103 |
| FRIT | 1,244 | 1,279 | 1,268 | 35 | -11 | 23 |
| OEB | 53 | 53 | 55 | 0 | 2 | 2 |
| Total | 19,295 | 19,022 | 19,424 | -273 | 401 | 128 |
Return to statistical supplement index
Table C
Total Employment of the Federal Reserve Banks1
by Functional Area
(average number of personnel)
| 2011 | 2012 | 2013 | 2014 | 2015E | 2016B |
CAGR
2011-2016 |
|
|---|---|---|---|---|---|---|---|
| Monetary and Economic Policy | 1,179 | 1,223 | 1,237 | 1,247 | 1,265 | 1,285 | 1.7% |
| Services to U.S. Treasury and Gov't Agencies | 1,114 | 1,071 | 1,138 | 1,049 | 1,106 | 1,241 | 2.2% |
| Services to Financial Institutions and the Public | 2,719 | 2,659 | 2,670 | 2,648 | 2,624 | 2,622 | -0.7% |
| Supervision | 3,341 | 3,725 | 3,860 | 3,886 | 4,002 | 4,087 | 4.1% |
| Fee Based Services to Financial Institutions | 910 | 840 | 717 | 683 | 680 | 714 | -4.8% |
| Local Support and Overhead | 6,303 | 6,457 | 6,635 | 6,698 | 6,749 | 6,832 | 1.6% |
| Nationally Provided Support | 1,084 | 1,274 | 1,305 | 1,328 | 1,323 | 1,378 | 4.9% |
| Centralized Service Providers | 1,003 | 1,051 | 1,182 | 1,204 | 1,274 | 1,265 | 4.8% |
| Total | 17,654 | 18,300 | 18,744 | 18,744 | 19,022 | 19,424 | 1.9% |
|
1Includes average number of personnel (ANP) at FRIT and OEB. Return to table. Nationally Provided Support: Support services performed on behalf of multiple Districts under a regionalized or centralized function. In this table, select nationally provided support ANP have been included in the associated functional areas. The table has been recategorized from previous years for consistency in reporting. Centralized Service Providers: Support services provided by FRIT and OEB. |
|||||||
Return to statistical supplement index
Table D
Budgeted Changes to Cash Compensation Programs of the Federal Reserve Banks
Officers and Staff by District, 2016
(dollars in thousands)
| District |
Total 12/31/15 estimated salary liability (a) |
Additions to salary base |
Incremental variable pay (e) |
Total | ||||
|---|---|---|---|---|---|---|---|---|
|
Merit (b) |
Equity & market adjustments (c) |
Promotions and reclasses (d) |
Percentage increase to total 12/31/15 salary liability (b+c+d) / (a) |
Dollars (b+c+d+e) |
Percentage increase to total 12/31/15 salary liability (b+c+d+e)/(a) |
|||
| Boston | 119,706 | 3,591 | 697 | 1,186 | 4.6% | 644 | 6,118 | 5.1% |
| New York | 446,384 | 11,606 | 2,232 | 5,756 | 4.4% | 2,695 | 22,289 | 5.0% |
| Philadelphia | 82,377 | 2,471 | 657 | 824 | 4.8% | 160 | 4,111 | 5.0% |
| Cleveland | 86,770 | 2,603 | 572 | 868 | 4.7% | 681 | 4,723 | 5.4% |
| Richmond | 140,646 | 4,192 | 696 | 436 | 3.8% | 1,994 | 7,318 | 5.2% |
| Atlanta | 143,903 | 4,317 | 436 | 986 | 4.0% | 750 | 6,490 | 4.5% |
| Chicago | 158,292 | 4,681 | 798 | 1,175 | 4.2% | 1,664 | 8,318 | 5.3% |
| St. Louis | 112,263 | 3,334 | 567 | 1,138 | 4.5% | 1,360 | 6,399 | 5.7% |
| Minneapolis | 95,394 | 2,862 | 546 | 477 | 4.1% | 323 | 4,208 | 4.4% |
| Kansas City | 130,618 | 3,919 | 827 | 1,620 | 4.9% | 1,504 | 7,869 | 6.0% |
| Dallas | 104,131 | 3,045 | 736 | 1,041 | 4.6% | 397 | 5,220 | 5.0% |
| San Francisco | 186,262 | 5,550 | 885 | 1,903 | 4.5% | 1,598 | 9,935 | 5.3% |
| FRIT | 140,632 | 4,281 | 714 | 1,427 | 4.6% | 362 | 6,783 | 4.8% |
| OEB | 8,002 | 240 | 42 | 82 | 4.6% | 53 | 417 | 5.2% |
| Total | 1,955,380 | 56,692 | 10,403 | 18,919 | 4.4% | 14,185 | 100,199 | 5.1% |
|
The table above shows the cash compensation components that add to base salary (merit, equity, and promotion) and the 2016 incremental increase in variable pay expense compared to those estimated for 2015. December 31, 2015 Salary Liability: the annualized salary expense based on the salaries in effect on December 31. Merit: the amount of 2016 budgeted salary expense that reflects salary increases for individuals based on performance. Equity Adjustments: the amount of 2016 budgeted salary expense to bring individual salaries to the minimum of a grade range or to better align salaries based on internal or external compensation pressures. Promotions: the amount of 2016 budgeted salary expense that reflects salary increases for individuals as a result of promotions resulting from a significant increase in job responsibilities. Variable Pay: the change in 2016 budgeted incentive payments (payment for the achievement of pre-determined goals) and cash awards (awards in recognition of exceptional achievements) compared to the 2015 estimate. |
||||||||
Table E
Capital Outlays of the Federal Reserve Banks
by District, 2015 and 2016
(dollars in thousands)
| District |
2015 Budget |
2015 Estimate |
2016 Budget |
Variance | ||
|---|---|---|---|---|---|---|
| 15E vs. 15B | 16B vs. 15E | 16B vs. 15B | ||||
| Boston | 28,506 | 25,978 | 21,578 | -8.9% | -16.9% | -24.3% |
| New York | 115,869 | 87,784 | 81,134 | -24.2% | -7.6% | -30.0% |
| Philadelphia | 20,521 | 15,929 | 22,240 | -22.4% | 39.6% | 8.4% |
| Cleveland | 16,997 | 8,768 | 18,140 | -48.4% | 106.9% | 6.7% |
| Richmond | 15,204 | 11,524 | 15,620 | -24.2% | 35.5% | 2.7% |
| Atlanta | 16,137 | 12,206 | 33,826 | -24.4% | 177.1% | 109.6% |
| Chicago | 26,522 | 22,420 | 26,055 | -15.5% | 16.2% | -1.8% |
| St. Louis | 14,324 | 14,902 | 10,224 | 4.0% | -31.4% | -28.6% |
| Minneapolis | 4,657 | 2,570 | 4,365 | -44.8% | 69.9% | -6.3% |
| Kansas City | 25,811 | 25,336 | 29,719 | -1.8% | 17.3% | 15.1% |
| Dallas * | 17,340 | 13,909 | 18,051 | -19.8% | 29.8% | 4.1% |
| San Francisco | 60,463 | 53,844 | 57,493 | -10.9% | 6.8% | -4.9% |
| Subtotal | 362,351 | 295,169 | 338,445 | -18.5% | 14.7% | -6.6% |
| FRIT | 91,086 | 70,045 | 65,368 | -23.1% | -6.7% | -28.2% |
| OEB | 550 | 945 | 5 | 71.8% | -99.5% | -99.1% |
| Total | 453,986 | 366,159 | 403,819 | -19.3% | 10.3% | -11.1% |
| * Excludes $1.0 million from the 2016B for the cancelled End-to-End Billing project at FRB Dallas. Return to table. | ||||||
Return to statistical supplement index
Footnotes
1. These expenses include those budgeted by Federal Reserve Information Technology and the Office of Employee Benefits that are chargeable to the Reserve Banks. Operating expenses exclude pension costs and assessments by the Board of Governors for costs related to currency and the operations of the Board of Governors and the Consumer Financial Protection Bureau. Return to text.
2. See tables in the attachment for expense and capital amounts by Reserve Bank. Return to text.
3. The Board's Policies and Guidelines Concerning Reserve Bank Operations (FRAM 1-049) states that Reserve Bank management may commit funding for capital commitments included in the Bank's capital budget approved by the Board, unless the acquisition is designated as strategic or sensitive by the BAC chair. Generally, strategic capital initiatives substantially affect or influence future System direction, significant research and development efforts or building projects, and certain large-dollar initiatives. Sensitive acquisitions may include commitments that may be inconsistent with System direction or vary from previously negotiated purchasing agreements, or local initiatives that may duplicate national efforts. Return to text.
4. ANP is the average number of employees in terms of full-time positions for the period. For instance, a full-time employee who works one-half of the year counts as 0.5 ANP for that calendar year; two half-time employees who work the full year count as 1 ANP. Return to text.
5. In April 2014, the Treasury announced the consolidation of the fiscal agent services provided by the Federal Reserve Banks as part of its effort to increase operational efficiency and effectiveness. The Treasury anticipates long-term savings, once services are transitioned from ten sites to four consolidated sites. Select business lines began transitioning in 2014. Return to text.
6. The Fedwire Modernization initiative involves the transition of the Fedwire Funds and Fedwire Securities applications from the legacy mainframe environment to a distributed platform. Return to text.
7. The CashForward initiative will replace legacy software applications, automate business processes, and employ technologies to meet current and future needs for the cash function. Phase 1 was completed in 2010 and Phase 2 was completed in July 2012. The project's planned completion date is in 2017.Return to text.
8. The System's payment strategies call for a new U.S. payment infrastructure to support a safer, faster payment capability that promotes efficient commerce, facilitates innovation, reduces fraud, and improves public confidence; and accelerated development and adoption of enhanced payment security standards. Return to text.
9. Reimbursable claims include the expenses of fiscal agency and depository services provided to the U.S. Treasury, other government agencies, and other fiscal principals. Reimbursable claims are slightly higher than Treasury service expenses shown in the Change in Net Expenses table because the reimbursable claims also include expenses associated with the government's use of the Reserve Banks' check, ACH, Fedwire Funds, and Fedwire Securities services; these expenses are included in the Change in Net Expenses table. Return to text.
10. Reimbursable claims exclude annual assessments for the supervision of large financial companies pursuant to Regulation TT, which are not recognized as revenue or used to fund System expenses. The supervision assessment represents approximately one-third of total supervision expenses. Return to text.
11. See the Board's announcement of 2016 fees for priced services at 80 FR 70783, November 16, 2015. Return to text.
12. The Reserve Bank migration strategy involves moving a majority of applications from the mainframe to alternate processing environments. 2016 budgeted projects include the migration of the statistics and reserves (STAR) applications and the ACH processing platform. Return to text.
