
Report to the Congress on the Effect of Capital Rules on Mortgage Servicing Assets
 Print
Print- Preface
- Executive Summary
- Background
- Risks to Firms Holding Mortgage Servicing Assets
- Role of Mortgage Servicing Assets in Bank Failures
Risks to Firms Holding Mortgage Servicing Assets
MSAs pose two key risks to a firm: valuation risk and business risk. Valuation risk refers to risks inherent in a firm's ability to estimate accurately a value for its MSAs and is driven mainly by interest rate risk and default risk.14 MSA valuations are inherently subjective and subject to uncertainty, as they rely on assessments of future economic variables. This reliance can lead to variance in MSA valuations across firms. Moreover, adverse financial conditions may cause liquidity strains for firms seeking to sell or transfer their MSAs. Business risk refers to idiosyncratic risks related to a firm's actual mortgage servicing activities and can include legal, compliance, and reputational risk.
Valuation Risks
In this Section:
The fair value of an MSA is defined as the price that would be received to sell the MSA in an orderly transaction between market participants as of the measurement date.15 MSAs, however, do not trade in an active, open market with readily available and observable prices. Because the significant inputs and assumptions used to determine fair value are unobservable, the MSA fair values are Level 3 under U.S. generally accepted accounting principles (GAAP).16 The valuation difficulty is in part because a firm's MSA portfolio tends not to consist of homogenous assets, as each portfolio is typically associated with mortgages that differ by loan size, interest rates, servicing fees, maturity, credit quality, and the entity, if any, that provides a credit guarantee on the underlying loan, among other characteristics. Accordingly, a firm generally will not be able to value its MSAs based on comparable sales alone.
To compensate, a firm may use financial modelling to determine the fair value of its MSAs. To do so, a firm will estimate the present value of net future servicing cash flows and compare and benchmark its estimate with several market-based sources.17 The primary determinant of future cash flows is the prepayment rate on the associated mortgage loans, which is driven largely by expectations about the interest rate environment. Another key assumption is default risk, which is the risk that a borrower will default on the mortgage loan. Default risk is influenced by geographic and macroeconomic conditions, and by the credit quality of the underlying loans.
The valuation of MSAs is best performed at the loan level of the mortgages that underlie the MSA portfolio. This approach allows the risk characteristics of each loan to be captured in the MSA valuation. To reduce processing time, servicers may aggregate loan level data into groups with similar risk characteristics (e.g., by interest rate and geography). However, servicer decisions about how to aggregate are subjective, and higher levels of aggregation can lead to the loss of important risk characteristics and, consequently, reduced valuation precision.
Most importantly, because MSA valuations must rely on assessments of future economic variables, they are inherently subjective and subject to uncertainty. This reliance can lead to variance in MSA valuations across firms and could result in valuation or impairment charges as assumptions change.18 For example, some nonbank servicers recorded significant write downs related to the valuation of their MSAs in the first quarter of 2016, raising concerns about the valuation methods used by these firms.19 Consequently, MSA values may be difficult to realize or may not be realizable at all.
Generally, larger firms with more resources will build and maintain proprietary MSA valuation models, use complex modelling techniques, and actively hedge their MSAs. In contrast, smaller firms rely more heavily on third-party vendors for valuation services, are more likely to use less complex models, and do not actively hedge their MSAs.
Prepayment Risk
Prepayment rates on mortgage loans are driven largely by interest rate changes. Declining interest rates incentivize borrowers to refinance their mortgages, the act of which extinguishes the servicer's income stream associated with those loans. If interest rates decline more than expected, MSAs are likely to lose value because the loans associated with those MSAs are more likely to be paid off sooner. Conversely, in an increasing interest rate environment, borrowers are less likely to prepay their mortgages, thus extending the duration of the loan and in turn the servicer's income stream. In such an environment, MSA values are likely to rise.
Historically, the relationship between MSA values and interest rate changes is not uniform but rather exhibits negative convexity. That is, MSA values decrease at a faster rate in a declining interest rate environment but do not rise as quickly in an increasing interest rate environment. The impact of interest rate changes on MSA values therefore depends on both the direction and severity of interest rate movements.
An analysis of estimates from a sample of large bank holding companies (BHCs) of how their MSA valuations would change under a variety of stress scenarios demonstrates that MSA valuations are sensitive to changes in interest rates, and that they are relatively more sensitive to interest rate declines than to interest rate increases.20 These estimates are based on each BHC's servicing portfolio as of year-end 2015 and on each BHC's valuation model, which in some cases is its own proprietary model and in other cases is a vendor model. As figure 1 shows, on average, these BHCs forecast that a 100 basis point increase in the yield curve would increase their MSA values by almost 19 percent, while a 100 basis point decrease would reduce their MSA values by almost 27 percent.
Figure 1. Average percent change in BHC forecasts of their MSA valuations in interest-rate stress scenarios
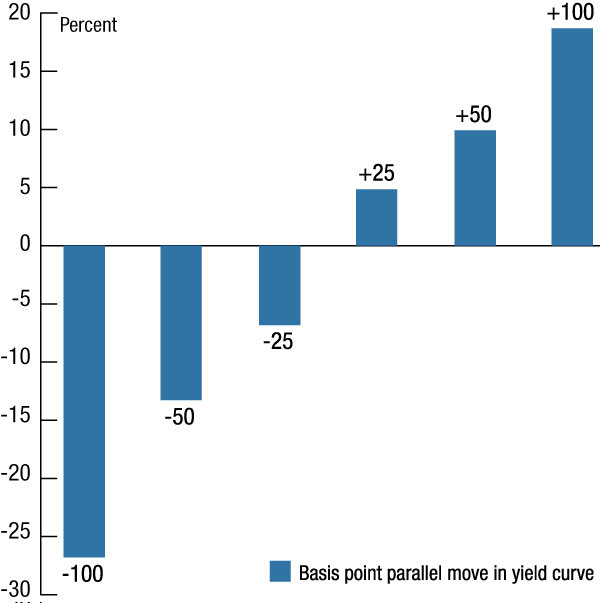
Note: The labels on the bars represent the size of the change in the yield curve in each of the stress scenarios.
Source: Staff calculations from FR Y-14 data.
The sample of large BHCs also indicates that MSA valuations are, on average, responsive to changes in forecasts of how fast borrowers will prepay their mortgages, also known as the conditional prepayment rate (CPR). As shown in figure 2, the BHCs forecast that their MSA values would decrease, on average, as the CPR increases. Specifically, a 1,000 basis point increase in the CPR is forecasted to decrease MSA valuations by about 29 percent.
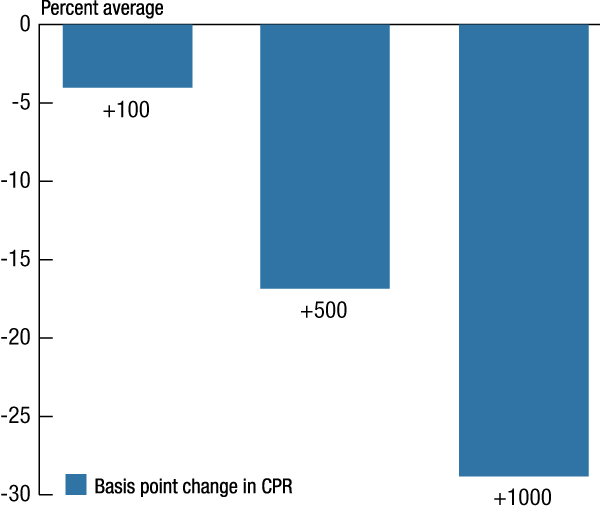
Note: The labels on the bars represent the size of the change in the conditional prepayment rate in each of the stress scenarios.
Source: Staff calculations from FR Y-14 data.
Default Risk
Default risk in the context of this report generally refers to the extent to which defaults exceed estimated levels. If defaults exceed estimated levels, MSAs could suffer an unexpected loss in value due to an unexpected loss of servicer fees and higher than expected costs related to servicing nonperforming loans.21 Default risk is directly related to the quality of loan underwriting (i.e., poorly underwritten loans exhibit higher rates of default), as well as to macroeconomic conditions and local economic conditions. Thus, default risk is most prevalent when the underwriting of the loans associated with the MSAs does not meet expected standards or when there is an adverse financial condition, causing a subsequent deterioration of the credit quality of mortgage loans and more borrowers to become delinquent and to default. Servicer expenses in the event of default can also be affected by the type of entity, if any, providing a credit guarantee on the underlying loan. For example, the BHC data indicate that defaults on loans guaranteed by the Federal Housing Administration (FHA) or the Veterans' Administration (VA) are generally more expensive to the servicer than those provided by the GSEs. Strategies to manage default risk include servicing diversified geographic areas and loan types, and having strict underwriting standards.
Analysis of the data from the BHC sample illustrates that these BHCs forecast that an increase in the default rate, also known as the conditional default rate (CDR), is expected, on average, to reduce MSA valuations. As shown in figure 3, a 1,000 basis point increase in the CDR is forecasted to decrease MSA valuations by about 56 percent.
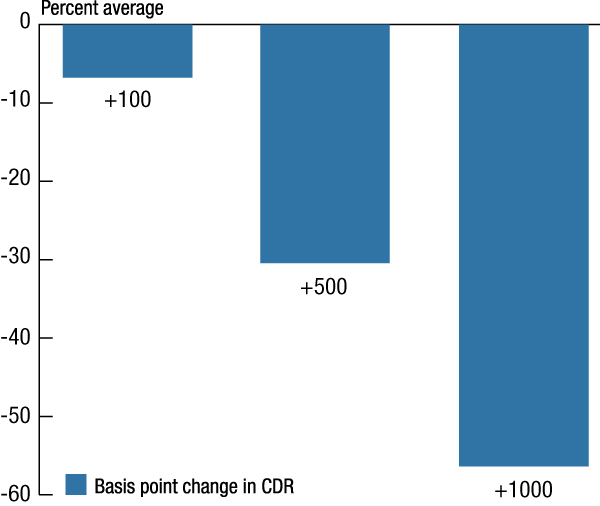
Note: The labels on the bars represent the size of the change in the conditional default rate in each of the stress scenarios.
Source: Staff calculations from FR Y-14 data.
Adverse Financial Conditions and Liquidity Risk
An adverse financial condition poses liquidity risks for MSAs, as well. For instance, during an adverse financial condition a firm could find it difficult to sell its MSAs as there may be fewer buyers interested in purchasing nonperforming loans due to their higher costs to service. In addition, the GSEs and Ginnie Mae have approval rights over the transfer of MSAs associated with securities that these entities guarantee. While this fact could dampen transfers to some degree during normal economic conditions, it becomes particularly important during adverse financial conditions, when the credit quality of potential transferees may also deteriorate, thus further limiting the number of firms that the GSEs and Ginnie Mae would approve to service. Moreover, investors have consent rights to servicing sales and transfers. As a condition to providing the consent, investors have historically required that the buyer of the MSAs assume direct recourse liability for origination and servicing defects, regardless of whether that buyer, as the new servicer, originated the loan or caused the servicing defect. This fact could further erode MSA values, particularly if the firm did not adequately consider the contingent recourse liability when initially valuing its MSAs. Consequently, during an adverse financial condition a servicer's ability to realize value from its MSAs may deteriorate at a time when the need to raise liquidity and capital and reduce risk is most acute.
Forecast Uncertainty
As noted, MSA valuations are heavily assumption-driven, and firms may differ in the models used to estimate valuations and in the assumed values of the variables that are inputs to those models. To illustrate this variation, figure 4 shows a box plot of the sample of BHCs' forecasts of the changes in their MSA valuations in four stress scenarios (a 100 basis point decrease in the yield curve, a 500 basis point increase in the CDR, a 1,000 basis point increase in the CPR, and a 2,000 basis point decrease in the national CoreLogic house price index (HPI)). The upper edge of each box represents the 75th percentile of the distribution of the stress scenario forecasts across firms; the middle line of the box represents the median; and the bottom edge of the box represents the 25th percentile. It is important to note that the variation across firms may represent differences in the characteristics of their servicing books as well as differences in their models and in the inputs to these models. Some firms may have servicing books that are more susceptible to prepayment in the event of an interest rate change, for example, and others may have servicing books weighted more heavily with loans that are costly to service in the event of default, such as those guaranteed by FHA or VA. Some caution therefore is warranted in interpreting these results as evidence of forecast uncertainty.
As shown in figure 4, the median forecast across firms for the change in their MSA valuations in the event of three scenarios--a 100 basis point decrease in the yield curve, a 500 basis point increase in the CDR, and a 1,000 basis point increase in the CPR--is a decrease in the range of 25 to 30 percent. However, the box around the median for the yield curve and CPR scenarios is quite narrow, indicating that most of the sample of BHCs' forecasts are fairly similar. In contrast, the box for the CDR scenario is quite wide (that is, the interquartile range is large), and spans nearly 30 percentage points, indicating greater variation across the BHCs' forecasts. Similarly, although the median forecast of the sample of BHCs in the event of a 2,000 basis point decrease in the HPI is for MSA valuations to be about unchanged, the box is quite wide, spanning 14 percentage points. The findings indicate that the BHC forecasts for the changes in their MSA valuations for prepayment scenarios are more in line with each other than their forecasts for default scenarios; it is not clear, however, whether this difference stems primarily from less of a consensus across BHCs as to how to model default or from differences in the characteristics of BHC servicing portfolios.
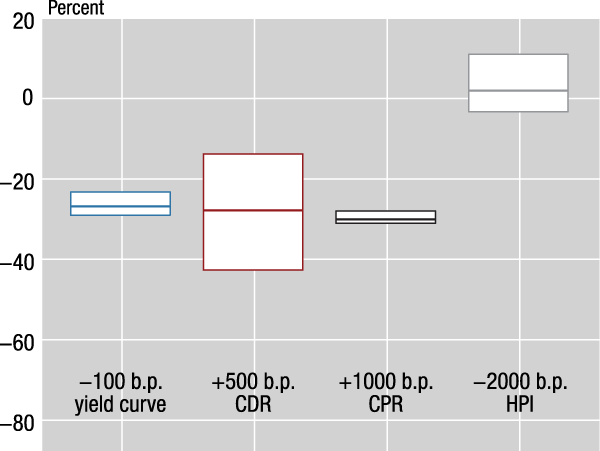
Note: The upper edge of each box represents the 75th percentile of the distribution of the changes in the BHC MSA valuations in the particular stress scenario; the middle line represents the median; and the bottom of the box represents the 25th percentile. B.p. = basis point.
Source: Staff calculations from FR Y-14 data.
Hedging
Firms may attempt to hedge prepayment risk either through new originations, often referred to as a "natural hedge," or through an active hedging strategy. Under a natural hedge, a firm will seek to originate new mortgage loans to replenish any servicing rights it lost due to prepayments. A natural hedge, however, has shortcomings. Whereas the change to MSA values due to interest rate shifts is immediate, new loan originations may lag behind interest rate changes, highlighting a timing weakness. In addition, new originations are not assured to keep pace with prepayments, as competitors may vie for the same business.
A firm may also choose to actively hedge its MSA portfolio against prepayment risk to protect against adverse changes in market values and to minimize earnings volatility. Active hedging strategies vary depending on the sophistication of the servicer but typically include the use of derivative instruments (e.g., mortgage "to-be-announced" securities, swaptions, and futures), though no financial instrument acts as a perfect hedge to changes in MSA values. Moreover, an active hedging strategy has its own set of challenges. It requires a specialized skill set, analytical tools, and regulatory and economic capital to use certain hedging instruments, 22 the latter of which could become more expensive during a market freeze or when liquidity is not available.23 An active hedging strategy can be difficult to implement successfully, given that MSAs are not traded in an observable market.24 Moreover, an active hedging strategy is economically viable only within a certain interest rate range, and substantial interest rate movements could result in a net loss for the firm.25
Some firms choose not to hedge their MSAs.26 Not actively hedging MSAs can, however, introduce significant volatility to earnings, potentially causing substantial losses.27
Business Risks
Mortgage servicing is governed by regulations and contracts that can pose significant legal and compliance risks. Various federal and state agencies' rules and regulations address mortgage servicing standards, including consumer protections. In addition, the GSEs and Ginnie Mae require servicers to comply with guidelines to service loans guaranteed by those entities, while separate contractual provisions govern the servicing of loans in private-label MBS. Mistakes or omissions by servicers can lead to lawsuits, fines, and loss of income. Use of subservicers or other contractors can compound this risk.28 In addition, when a servicer does not comply with the standards established by the GSEs or Ginnie Mae, these entities can confiscate the servicing, forcing the servicer to charge off the value of the MSA.
Moreover, negative publicity can lead to reputational harm, which can have adverse effects on other lines of business and on a firm's MSA portfolio itself. Potential borrowers may be less likely to originate a loan with a firm that has had servicing issues, and in some instances reputational harm may have led some banking institutions to leave or divest from their mortgage servicing activities.29
References
14. This study does not separate the total mortgage servicing market into GSE and non-GSE MSAs. Available data generally do not distinguish between GSE and non-GSE MSAs. We note, however, that non-GSE MSAs are structurally different than GSE MSAs, and are more susceptible to credit risk. Credit risk factors that do not exist in GSE servicing can affect non-GSE MSAs' ancillary income, cost structure, and hence valuations. Because non-GSE MSAs can rapidly transition to problem loan servicing, non-GSE MSAs cost structure can rapidly increase, limiting the number of investors interested in such assets, and thus requiring higher rates of return. As a result, non-GSE MSA valuation changes are not linear across the spectrum of valuation assumptions. Return to text
15. ASC 820, Fair Value Measurement. Return to text
16. See ASC 820-10-35. Return to text
17. Sources include trust interest-only securities, broker appraisals, bulk sales of MSAs, and peer group surveys. Return to text
18. Federal Housing Finance Agency, Alternative Mortgage Servicing Compensation Discussion Paper (Washington, DC: 2011), 9, www.fhfa.gov/PolicyProgramsResearch/Research/PaperDocuments/20110927_DP_AltMortgageServicing_508.pdf. Return to text
19. Kroll Bond Rating Agency, "Non-Bank Mortgage Companies Suffer from MSR Fair Value' Volatility," May 16, 2016. Return to text
20. To verify that these results are not unduly influenced by the estimates of any given bank, table A.1 in the appendix shows the average percent change in MSA valuation weighted by the unpaid balance of loans serviced and the median percent change in these scenarios. These robustness checks are consistent with the main results in the text of the report. Table A.1 also shows the changes in MSA valuations in response to changes in the foreclosure time frame, servicing costs, the unemployment rate, and housing prices. Various shocks to these variables would change MSA values by less than 4 percent. Return to text
21. When a foreclosure is completed, the servicer generally recoups a portion of its expenses from the foreclosure proceeds. The reimbursement percentage varies by investor. In addition, periods of high mortgage default tend to be periods when house prices decline significantly; although the increase in defaults reduces MSA values, the decline in house prices also tends to slow prepayment as borrowers who are current and would otherwise have refinanced (given lower interest rates) might be unable to refinance because their loan-to-value ratios have become too high. This factor can increase the MSA values. Return to text
22. Alternative Mortgage Servicing, 10. Return to text
23. Karan Kaul and Laurie Goodman, "Nonbank Servicer Regulation: New Capital and Liquidity Requirements Don't Offer Enough Loss Protection," Urban Institute, February 2016, 6, www.urban.org/sites/default/files/alfresco/publication-pdfs/2000633-Nonbank-Servicer-Regulation-New-Capital-and-Liquidity-Requirements-Don't-Offer-Enough-Loss-Protection.pdf  . Return to text
24. Mortgage Bankers Association and PricewaterhouseCoopers, "The Changing Dynamics of the Mortgage Servicing Landscape," June 2015, 7, www.mba.org/Documents/Policy/MBA_PWC_Servicing_White_Paper.pdf
. Return to text
25. Kaul and Goodman, Nonbank Servicer Regulation, 4-5. Return to text
26. Kroll, Non-Bank Mortgage Companies Suffer, 3. Return to text
27. Ibid. Return to text
28. Office of the Comptroller of the Currency, "Third-Party Relationships: Risk Management Guidance," October 30, 2013, www.occ.gov/news-issuances/bulletins/2013/bulletin-2013-29.html. Return to text
29. Pamela Lee, "Nonbank Specialty Servicers: What's the Big Deal?" Urban Institute, August 4, 2014, 3, www.urban.org/sites/default/files/alfresco/publication-pdfs/413198-Nonbank-Specialty-Servicers-What-s-the-Big-Deal-.PDF
. Return to text