

 Print
Print
Federal Reserve
BULLETIN
The Mortgage Market in 2010: Highlights from the Data Reported under the Home Mortgage Disclosure Act
Sections of this Page
- A Profile of the 2010 Mortgage Market
- Factors Influencing Refinancing Activity in 2010
- The Continuing Role of Government in the Mortgage Market
- Credit Circumstances in Neighborhood Stabilization Program Neighborhoods
- Differences in Lending Outcomes by Race, Ethnicity, and Sex of the Borrower
- Future Changes in HMDA
- APPENDIX A: REQUIREMENTS OF REGULATION C
The Home Mortgage Disclosure Act of 1975 (HMDA) is a consumer protection statute requiring most mortgage lending institutions with offices in metropolitan areas to publicly disclose detailed information about their home-lending activity each year. The Congress intended that HMDA achieve its legislative objectives primarily through the force of public disclosure.1 These objectives include helping members of the public determine whether financial institutions are serving the housing needs of their local communities and treating borrowers and loan applicants fairly, providing information that could facilitate the efforts of public entities to distribute funds to local communities for the purpose of attracting private investment, and helping households decide where they may want to deposit their savings. The data have also proven to be valuable in a variety of public policy and research endeavors to explore mortgage market activity; in this connection, the HMDA data have been especially valuable when combined with other types of information, such as the socioeconomic and demographic status of different populations and geographies.
The 2010 HMDA data consist of information reported by more than 7,900 home lenders, including all of the nation's largest mortgage originators. Together, the home-purchase, refinance, and home-improvement loans reported represent the majority of home lending nationwide and thus are broadly representative of all such lending in the United States.2 The HMDA data include the disposition of each application for mortgage credit; the type, purpose, and characteristics of each home mortgage that lenders originate or purchase during the calendar year; the census-tract designations of the properties related to those loans; loan pricing information; personal demographic and other information about loan applicants, including their race or ethnicity and income; and information about loan sales.3
Until recently, the Federal Reserve Board implemented the provisions of HMDA through its Regulation C.4 On July 21, 2011, rulemaking responsibility for HMDA was transferred from the Board to the newly established Consumer Financial Protection Bureau (CFPB) (discussed later in the section "Future Changes in HMDA").5 The Federal Financial Institutions Examination Council (FFIEC) has played, and will continue to play, a role in collecting the HMDA data from reporting institutions and facilitating public access to the information.6 In September each year, the FFIEC has released summary tables pertaining to lending activity from the previous calendar year for each reporting lender and aggregations of home-lending activity for each metropolitan statistical area (MSA) and for the nation as a whole.7 The FFIEC also has made available to the public a data file containing virtually all of the reported information for each lending institution.8
This article offers a summary of the 2010 HMDA data and provides basic tables created from these data and the HMDA data from earlier years.9 We then narrow the focus and present more-detailed findings from our initial review of the data. Our review highlights several prominent findings:
- Mortgage originations decreased between 2009 and 2010 in the HMDA data from just under 9 million loans to fewer than 8 million loans. Most significant was the decline in the number of refinance loans despite historically low baseline mortgage interest rates throughout the year. Home-purchase loans also dropped, but less so than the decline in refinance lending.
- While loans originated under the Federal Housing Administration (FHA) mortgage insurance program and the Department of Veterans Affairs (VA) loan guarantee program continue to account for a historically large proportion of loans, such lending fell more than did other types of lending.
- We draw on data from a national credit bureau to highlight the importance of house price declines and changes in underwriting relative to earlier in the decade for refinance activity during 2010. We estimate that, in the absence of home equity problems and underwriting changes, roughly 2.3 million first-lien owner-occupant refinance loans would have been made during 2010 on top of the 4.5 million such loans that were actually originated.
- A sharp drop in home-purchase lending activity occurred in the middle of 2010, right alongside the June closing deadline (although the deadline was retroactively extended to September) of the federal first-time homebuyer tax credit program. The ending of this program during 2010 may help explain the decline in the incidence of home-purchase lending to lower-income borrowers between the first and second halves of the year.
- Home-purchase lending in highly distressed census tracts identified by the Neighborhood Stabilization Program (NSP) was 75 percent lower in 2010 than it had been in these same tracts in 2005. This decline was notably larger than that experienced in other tracts and appears to primarily reflect a much sharper decrease in lending to higher-income borrowers in the highly distressed neighborhoods.
- The share of loans that originators hold in their portfolios rather than sell into the secondary market, especially among owner-occupant refinance loans, has risen since the beginning of 2009 but is still well below levels around the mid-2000s.
- National single-family home loan limits on both FHA loans and Freddie Mac and Fannie Mae purchases are scheduled to fall on October 1, 2011. Analysis of the 2010 HMDA data suggests that the number of loans affected by these limit changes is likely to be small. For example, about 1.3 percent of both the 2010 home-purchase and refinance loans fell into a size range affected by the proposed limit changes for Freddie Mac and Fannie Mae. Although the affected number of loans is small relative to the total number of loans, the analysis also shows that the number is large relative to the current jumbo loan market. How easily the private market would be able to absorb this potentially large increase in the market for jumbo loans is unclear.
- All loans reported in the 2010 HMDA data are covered under new rules governing whether a loan is classified as higher priced. The data show that the incidence of higher-priced lending across all products in 2010 was about 3.2 percent. As in the past, black and Hispanic-white borrowers were more likely in 2010, and Asian borrowers less likely, to obtain loans with prices above the HMDA price-reporting thresholds than were non-Hispanic white borrowers. These differences are significantly reduced, but not completely eliminated, after controlling for lender and borrower characteristics.
- Overall, loan denial rates remained about the same as in 2009. Analyses of the HMDA data in previous years have consistently found that denial rates vary across applicants grouped by race or ethnicity, which is also the case in 2010. However, the HMDA data do not include sufficient information to determine the extent to which these differences reflect illegal discrimination.
A Profile of the 2010 Mortgage Market
HMDA covers all of the nation's leading home lenders as well as a large number of others. Banking institutions--commercial banks, savings institutions (savings and loans and savings banks), and credit unions--account for most of the reporting entities, although many mortgage companies are covered as well. For 2010, 7,923 institutions reported on their home-lending activity under HMDA: 3,818 commercial banks; 856 savings institutions; 2,041 credit unions; and 1,208 mortgage companies, 839 of which were not affiliated with a banking institution (table 1).
| Year | Depository institution | Mortgage company | All institutions | |||||
|---|---|---|---|---|---|---|---|---|
| Commercial bank | Savings institution | Credit union | All | Independent | Affiliated 1 | All | ||
| 2000 | 3,609 | 1,112 | 1,691 | 6,412 | 981 | 332 | 1,313 | 7,725 |
| 2001 | 3,578 | 1,108 | 1,714 | 6,400 | 962 | 290 | 1,252 | 7,652 |
| 2002 | 3,628 | 1,070 | 1,799 | 6,497 | 986 | 310 | 1,296 | 7,793 |
| 2003 | 3,642 | 1,033 | 1,903 | 6,578 | 1,171 | 382 | 1,553 | 8,131 |
| 2004 | 3,945 | 1,017 | 2,030 | 6,992 | 1,317 | 544 | 1,861 | 8,853 |
| 2005 | 3,904 | 974 | 2,047 | 6,925 | 1,341 | 582 | 1,923 | 8,848 |
| 2006 | 3,900 | 946 | 2,037 | 6,883 | 1,334 | 685 | 2,019 | 8,902 |
| 2007 | 3,918 | 929 | 2,019 | 6,866 | 1,132 | 638 | 1,770 | 8,636 |
| 2008 | 3,942 | 913 | 2,026 | 6,881 | 957 | 550 | 1,507 | 8,388 |
| 2009 | 3,925 | 879 | 2,017 | 6,821 | 914 | 389 | 1,303 | 8,124 |
| 2010 | 3,818 | 856 | 2,041 | 6,715 | 839 | 369 | 1,208 | 7,923 |
Note: Here and in all subsequent tables, components may not sum to totals because of rounding.
1. Subsidiary of a depository institution or an affiliate of a bank holding company. Return to table
Source: Here and in subsequent tables and figures except as noted, Federal Financial Institutions Examination Council, data reported under the Home Mortgage Disclosure Act (www.ffiec.gov/hmda).
Return to textThe number of reporting institutions has fluctuated over the years. Some of the fluctuation is due to changes in reporting requirements, including increases in the minimum asset level used to determine coverage.10 Mergers, acquisitions, and failures also account for some of the year-over-year changes. Finally, periodic changes in the number and geographic footprints of metropolitan areas influence reporting over time, as HMDA's coverage is limited to institutions that have at least one office in an MSA.
For 2010, the number of reporting institutions fell 2 percent from 2009, continuing a downward trend since 2006, when HMDA coverage included nearly 8,900 lenders. Among the types of reporters, the number of mortgage companies fell the most from 2009, decreasing 7 percent; since 2006, the number of mortgage companies has declined about 40 percent.
Reporting institutions vary greatly by both asset size and volume of reported mortgage lending activity. Most reporters are small, and many extend relatively few loans. For 2010, 53 percent of the banking institutions covered by HMDA had assets under $250 million, and 74 percent of them reported information on fewer than 100 loans; only 0.6 percent of these smaller banking institutions reported on more than 1,000 loans (table 2). Among all depository institutions, about 54 percent reported on fewer than 100 loans. Across different types of lenders, mortgage companies tend to originate larger numbers of loans on a per-reporter basis than the other institutions (38 percent of the mortgage companies reported more than 1,000 loans, a share more than five times that of depository institutions).
| Type of lender, and subcategory (asset size in millions of dollars) | Less than 50 | 50-99 | 100-249 | 250-499 | 500-999 | 1,000 or more | All | |||||||
|---|---|---|---|---|---|---|---|---|---|---|---|---|---|---|
| Number | Percent of sub-category 1 | Number | Percent of sub-category1 | Number | Percent of sub-category1 | Number | Percent of sub-category1 | Number | Percent of sub-category1 | Number | Percent of sub-category1 | Number | Percent of sub-category1 | |
| Depository institution | ||||||||||||||
| Commercial bank | ||||||||||||||
| Less than 250 | 1,126 | 53.5 | 426 | 20.2 | 392 | 18.6 | 116 | 5.5 | 29 | 1.4 | 15 | .7 | 2,104 | 100 |
| 250-499 | 224 | 28.5 | 123 | 15.7 | 220 | 28.0 | 138 | 17.6 | 61 | 7.8 | 19 | 2.4 | 785 | 100 |
| 500-999 | 86 | 18.4 | 53 | 11.3 | 88 | 18.8 | 99 | 21.2 | 100 | 21.4 | 41 | 8.8 | 467 | 100 |
| 1,000 or more | 52 | 11.7 | 24 | 5.4 | 56 | 12.6 | 42 | 9.5 | 81 | 18.3 | 188 | 42.4 | 443 | 100 |
| All | 1,488 | 39.2 | 626 | 16.5 | 756 | 19.9 | 395 | 10.4 | 271 | 7.1 | 263 | 6.9 | 3,799 | 100 |
| Savings institution | ||||||||||||||
| Less than 250 | 140 | 36.6 | 93 | 24.3 | 91 | 23.8 | 41 | 10.7 | 11 | 2.9 | 7 | 1.8 | 383 | 100 |
| 250-499 | 16 | 8.6 | 19 | 10.2 | 68 | 36.6 | 57 | 30.6 | 16 | 8.6 | 10 | 5.4 | 186 | 100 |
| 500-999 | 12 | 8.4 | 11 | 7.7 | 31 | 21.7 | 41 | 28.7 | 30 | 21.0 | 18 | 12.6 | 143 | 100 |
| 1,000 or more | 5 | 3.5 | 7 | 5.0 | 13 | 9.2 | 22 | 15.6 | 31 | 22.0 | 63 | 44.7 | 141 | 100 |
| All | 173 | 20.3 | 130 | 15.2 | 203 | 23.8 | 161 | 18.9 | 88 | 10.3 | 98 | 11.5 | 853 | 100 |
| Credit union | ||||||||||||||
| Less than 250 | 766 | 55.8 | 300 | 21.9 | 256 | 18.7 | 41 | 3.0 | 8 | .6 | 1 | .1 | 1,372 | 100 |
| 250-499 | 51 | 16.7 | 34 | 11.1 | 104 | 34.0 | 80 | 26.1 | 30 | 9.8 | 7 | 2.3 | 306 | 100 |
| 500-999 | 14 | 7.1 | 10 | 5.1 | 43 | 21.8 | 55 | 27.9 | 49 | 24.9 | 26 | 13.2 | 197 | 100 |
| 1,000 or more | .0 | 1 | .6 | 13 | 8.3 | 25 | 16.0 | 41 | 26.3 | 76 | 48.7 | 156 | 100 | |
| All | 831 | 40.9 | 345 | 17.0 | 416 | 20.5 | 201 | 9.9 | 128 | 6.3 | 110 | 5.4 | 2,031 | 100 |
| All depository institutions | ||||||||||||||
| Less than 250 | 2,032 | 52.7 | 819 | 21.2 | 739 | 19.2 | 198 | 5.1 | 48 | 1.2 | 23 | .6 | 3,859 | 100 |
| 250-499 | 291 | 22.8 | 176 | 13.8 | 392 | 30.7 | 275 | 21.5 | 107 | 8.4 | 36 | 2.8 | 1,277 | 100 |
| 500-999 | 112 | 13.9 | 74 | 9.2 | 162 | 20.1 | 195 | 24.2 | 179 | 22.2 | 85 | 10.5 | 807 | 100 |
| 1,000 or more | 57 | 7.7 | 32 | 4.3 | 82 | 11.1 | 89 | 12.0 | 153 | 20.7 | 327 | 44.2 | 740 | 100 |
| All | 2,492 | 37.3 | 1,101 | 16.5 | 1,375 | 20.6 | 757 | 11.3 | 487 | 7.3 | 471 | 7.0 | 6,683 | 100 |
| Mortgage company 2 | ||||||||||||||
| All | 185 | 16.1 | 110 | 9.5 | 139 | 12.1 | 119 | 10.3 | 159 | 13.8 | 440 | 38.2 | 1,152 | 100 |
| All institutions | 2,677 | 34.2 | 1,211 | 15.5 | 1,514 | 19.3 | 876 | 11.2 | 646 | 8.2 | 911 | 11.6 | 7,835 | 100 |
1. Distribution sums horizontally. For example, the second column, first row shows that 53.5 percent of commercial banks with assets of less than $250 million originated less than 50 loans in 2010. Return to table
2. Independent mortgage company, subsidiary of a depository institution, or an affiliate of a bank holding company. Return to table
Return to textIn any given year, institution failures and closings can affect the volume of reported loans and applications because some of the lenders that fail or were closed extended loans but did not report. Seventy-nine institutions that reported HMDA data for 2009 ceased operations and did not report lending activity for 2010.11 Although it is not possible to know how many applications or loans these 79 institutions originated in 2010 before discontinuing operations, one can gauge their potential importance by measuring their lending activity in 2009. In the aggregate, these nonreporting companies accounted for only 0.2 percent of the 2009 loan or application records submitted under HMDA. Therefore, it seems highly unlikely that the 2010 data are affected in any meaningful way by the underreporting that may have occurred because these lenders did not report activity for the part of 2010 in which they may have made some loans.
Reporting institutions submitted information on 12.95 million applications for home loans of all types in 2010 (excluding requests for preapproval), down about 14 percent from 2009 and far below the 27.5 million applications processed in 2006, just before the housing market decline (data derived from table 3.A). The majority of loan applications are approved by lenders, and most of these approvals result in extensions of credit. In some cases, an application is approved, but the applicant decides not to take out the loan; for example, in 2010, about 5 percent of all applications were approved but not accepted by the applicant (data not shown in tables). Overall, about 61 percent of the applications submitted in 2010 resulted in an extension of credit (data derived from tables 3.A and 3.B), a share little changed from 2009.
| Year | Applications received for home loans, by type of property | Requests for preapproval 1 | Purchased loans | Total | |||
|---|---|---|---|---|---|---|---|
| 1-4 family | Multifamily | ||||||
| Home purchase | Refinance | Home improvement | |||||
| 2000 | 8,278,219 | 6,543,665 | 1,991,686 | 37,765 | n.a. | 2,398,292 | 19,249,627 |
| 2001 | 7,692,870 | 14,284,988 | 1,849,489 | 48,416 | n.a. | 3,767,331 | 27,643,094 |
| 2002 | 7,406,374 | 17,491,627 | 1,529,347 | 53,231 | n.a. | 4,829,706 | 31,310,285 |
| 2003 | 8,179,633 | 24,602,536 | 1,508,387 | 58,940 | n.a. | 7,229,635 | 41,579,131 |
| 2004 | 9,792,324 | 16,072,102 | 2,202,744 | 61,895 | 332,054 | 5,146,617 | 33,607,736 |
| 2005 | 11,672,852 | 15,898,346 | 2,539,158 | 57,668 | 396,686 | 5,874,447 | 36,439,157 |
| 2006 | 10,928,866 | 14,045,961 | 2,480,827 | 52,220 | 411,134 | 6,236,352 | 34,155,360 |
| 2007 | 7,609,143 | 11,566,182 | 2,218,224 | 54,230 | 432,883 | 4,821,430 | 26,702,092 |
| 2008 | 5,017,998 | 7,729,143 | 1,404,008 | 42,792 | 275,808 | 2,921,821 | 17,391,570 |
| 2009 | 4,201,057 | 9,935,678 | 826,916 | 26,257 | 209,055 | 4,294,528 | 19,493,491 |
| 2010 | 3,838,896 | 8,421,592 | 668,903 | 25,484 | 164,672 | 3,229,010 | 16,348,557 |
Note: Here and in subsequent tables, except as noted, data include first and junior liens, site-built and manufactured homes, and owner- and non-owner-occupant loans.
1. Consists of requests for preapproval that were denied by the lender or were accepted by the lender but not acted upon by the borrower. In this article, applications are defined as being for a loan on a specific property; they are thus distinct from requests for preapproval, which are not related to a specific property. Information on preapproval requests was not required to be reported before 2004. Return to table
n.a. Not available.
Return to text| Year | Loans, by type of property | Total | |||
|---|---|---|---|---|---|
| 1-4 family | Multifamily | ||||
| Home purchase | Refinance | Home improvement | |||
| 2000 | 4,787,356 | 2,435,420 | 892,587 | 27,305 | 8,142,668 |
| 2001 | 4,938,809 | 7,889,186 | 828,820 | 35,557 | 13,692,372 |
| 2002 | 5,124,767 | 10,309,971 | 712,123 | 41,480 | 16,188,341 |
| 2003 | 5,596,292 | 15,124,761 | 678,507 | 48,437 | 21,447,997 |
| 2004 | 6,429,988 | 7,583,928 | 966,484 | 48,150 | 15,028,550 |
| 2005 | 7,382,012 | 7,101,649 | 1,093,191 | 45,091 | 15,621,943 |
| 2006 | 6,740,322 | 6,091,242 | 1,139,731 | 39,967 | 14,011,262 |
| 2007 | 4,663,267 | 4,817,875 | 957,912 | 41,053 | 10,480,107 |
| 2008 | 3,119,692 | 3,457,774 | 568,287 | 31,509 | 7,177,262 |
| 2009 | 2,784,956 | 5,758,875 | 387,970 | 19,135 | 8,950,936 |
| 2010 | 2,541,791 | 4,961,814 | 340,604 | 19,128 | 7,863,337 |
The HMDA data also include information on loans purchased by reporting institutions during the reporting year, although the purchased loans may have been originated at any point in time. For 2010, lenders reported information on nearly 3.2 million loans that they had purchased from other institutions, a decline of nearly 25 percent from 2009. Finally, lenders reported on roughly 165,000 requests for preapproval of home-purchase loans that did not result in a loan origination (table 3.A); preapprovals that resulted in loans are included in the count of loan extensions cited earlier.
Lending for Home Purchase or Refinancing in 2010
Although relatively stable in the past two years, the volume of home-purchase lending has fallen sharply since 2006 (figure 1).12 In June 2006, the peak month for home-purchase lending that year, nearly 712,000 home-purchase loans were extended, compared with only 326,000 such loans in June 2010, the most active month that year. On a yearly basis, the number of home-purchase loans reported by lenders covered by HMDA in 2010 was down nearly 9 percent from 2009 and was 62 percent lower than in 2006 (data derived from table 3.B).
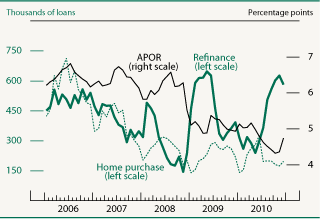
Note: The data are monthly. Loans are first- and second-lien mortgages excluding those for multifamily housing. The average prime offer rate (APOR) is published weekly by the Federal Financial Institutions Examination Council. It is an estimate of the annual percentage rate on loans being offered to high-quality prime borrowers based on the contract interest rates and discount points reported by Freddie Mac in its Primary Mortgage Market Survey (www.ffiec.gov/ratespread/newcalc.aspx).
Because of the extraordinary difficulties in the housing and mortgage markets, the federal government has taken several actions to support their recovery. One of the actions, the first-time homebuyer tax credit program, reduced the tax bill or increased the amount of refund for eligible homebuyers.13 The program was originally scheduled to end (or "sunset") on November 30, 2009, but was extended a few weeks to provide benefits to those eligible homebuyers who entered into binding contracts to purchase their homes by April 30, 2010, and closed the sales by June 30, 2010 (after the fact, the closing deadline was extended to September 30, 2010, but that extension affected only a small number of sales).
The first-time homebuyer tax credit program likely stimulated homebuying in 2009 as individuals sought to purchase their homes before the initial scheduled sunset date.14 The extension of the law until the end of June 2010 may help explain, in part, the increase in loan volume in the spring of 2010 and then the sharp falloff in the monthly flow of new home-purchase originations after that despite a decline in mortgage interest rates over the remainder of the year.15
To a greater degree than for home-purchase lending, the volume of refinance lending is aligned with changes in interest rates, expanding as mortgage rates fall and retrenching when rates rise. The interest rate environment in both 2009 and 2010 was generally quite favorable for well-qualified borrowers who sought to refinance, particularly in the second half of 2010, when the rate on 30-year fixed-rate mortgages fell to record lows. Nonetheless, compared with 2009, the number of reported refinancings was down about 14 percent (table 3.B). (Factors affecting the level of refinance activity in 2010 are explored in the later section "Factors Influencing Refinancing Activity in 2010.")
Non-Owner-Occupant Lending
Individuals buying homes either for investment purposes or as second or vacation homes are an important segment of the housing market in general, and in some areas of the country, they are particularly important. In the current period of high foreclosures and elevated levels of short sales, investor activity helps reduce the overhang of unsold and foreclosed properties. HMDA data help document the role of non-owner-occupant lending over time because the borrower's intended occupancy status is one of the reported items.16
As the boom in housing emerged in the first half of the past decade, the HMDA data showed a sharp increase in non-owner-occupant lending used to purchase one- to four-family homes (table 4). The volume of non-owner-occupant lending then fell sharply beginning in 2007 and remained at comparably low levels through 2010. In 2010, 76 percent fewer non-owner-occupant loans were extended than in 2005, the peak year for non-owner-occupant lending. The number of non-owner-occupant loans in 2010 was little changed from that in 2009.
| Year | Applications | Loans | ||||||
|---|---|---|---|---|---|---|---|---|
| Owner occupied | Non-owner occupied | Owner occupied | Non-owner occupied | |||||
| Conventional | Nonconventional 1 | Conventional | Nonconventional1 | Conventional | Nonconventional1 | Conventional | Nonconventional1 | |
| A. Home purchase | ||||||||
| 2000 | 6,350,643 | 1,311,101 | 604,919 | 12,524 | 3,411,887 | 963,345 | 404,133 | 8,378 |
| 2001 | 5,776,767 | 1,268,885 | 627,598 | 19,688 | 3,480,441 | 1,003,795 | 440,498 | 14,128 |
| 2002 | 5,511,048 | 1,133,770 | 747,758 | 13,923 | 3,967,834 | 870,599 | 547,963 | 8,474 |
| 2003 | 6,212,915 | 1,014,865 | 943,248 | 8,623 | 4,162,412 | 761,716 | 667,613 | 4,560 |
| 2004 | 7,651,113 | 799,131 | 1,335,241 | 6,839 | 4,946,423 | 574,841 | 906,014 | 2,710 |
| 2005 | 9,208,214 | 610,650 | 1,850,174 | 3,814 | 5,742,377 | 438,419 | 1,199,509 | 1,707 |
| 2006 | 8,695,877 | 576,043 | 1,653,154 | 3,792 | 5,281,485 | 416,744 | 1,040,668 | 1,425 |
| 2007 | 5,960,571 | 599,637 | 1,044,112 | 4,823 | 3,582,949 | 423,506 | 655,916 | 896 |
| 2008 | 2,940,059 | 1,424,483 | 647,340 | 6,116 | 1,727,692 | 972,605 | 415,930 | 3,465 |
| 2009 | 1,883,278 | 1,884,136 | 427,338 | 6,305 | 1,171,033 | 1,320,412 | 289,796 | 3,715 |
| 2010 | 1,728,715 | 1,689,471 | 415,315 | 5,395 | 1,088,855 | 1,166,477 | 284,625 | 1,834 |
| B. Refinance | ||||||||
| 2000 | 6,051,484 | 110,380 | 379,299 | 2,502 | 2,170,162 | 64,882 | 198,695 | 1,293 |
| 2001 | 12,737,863 | 705,784 | 823,748 | 17,592 | 6,836,106 | 524,228 | 516,616 | 12,181 |
| 2002 | 15,623,327 | 742,208 | 1,111,588 | 14,504 | 9,058,654 | 535,370 | 706,570 | 9,377 |
| 2003 | 21,779,329 | 1,236,467 | 1,563,430 | 23,310 | 13,205,472 | 895,735 | 1,007,674 | 15,871 |
| 2004 | 14,476,350 | 497,700 | 1,084,536 | 13,516 | 6,649,588 | 304,591 | 621,667 | 8,082 |
| 2005 | 14,494,441 | 262,438 | 1,135,929 | 5,538 | 6,336,004 | 158,474 | 603,914 | 3,257 |
| 2006 | 12,722,112 | 208,405 | 1,112,891 | 2,553 | 5,382,950 | 122,134 | 585,142 | 1,016 |
| 2007 | 10,173,282 | 375,860 | 1,012,827 | 4,213 | 4,123,507 | 196,897 | 496,577 | 894 |
| 2008 | 5,829,633 | 1,240,472 | 650,042 | 8,996 | 2,593,793 | 522,243 | 337,914 | 3,824 |
| 2009 | 7,251,066 | 2,051,766 | 617,707 | 15,139 | 4,404,215 | 998,585 | 348,599 | 7,476 |
| 2010 | 6,318,522 | 1,447,521 | 640,046 | 15,503 | 3,943,819 | 653,671 | 356,238 | 8,086 |
| C. Home improvement | ||||||||
| 2000 | 1,833,277 | 91,575 | 65,286 | 1,548 | 843,884 | 10,896 | 37,047 | 760 |
| 2001 | 1,771,472 | 16,276 | 60,598 | 1,143 | 788,560 | 6,722 | 32,990 | 548 |
| 2002 | 1,459,049 | 11,582 | 58,080 | 636 | 676,515 | 4,878 | 30,533 | 197 |
| 2003 | 1,430,380 | 13,876 | 63,806 | 325 | 642,065 | 5,226 | 31,113 | 103 |
| 2004 | 2,081,528 | 11,887 | 109,105 | 224 | 904,492 | 5,557 | 56,341 | 94 |
| 2005 | 2,401,030 | 10,053 | 127,857 | 218 | 1,026,340 | 4,483 | 62,298 | 70 |
| 2006 | 2,335,338 | 12,645 | 132,694 | 150 | 1,067,730 | 6,115 | 65,842 | 44 |
| 2007 | 2,072,688 | 16,717 | 128,700 | 119 | 887,123 | 9,409 | 61,321 | 59 |
| 2008 | 1,294,162 | 26,544 | 83,036 | 266 | 516,612 | 12,347 | 39,170 | 158 |
| 2009 | 740,061 | 28,437 | 58,171 | 247 | 348,409 | 11,212 | 28,183 | 166 |
| 2010 | 582,775 | 34,437 | 51,300 | 391 | 302,612 | 11,804 | 26,131 | 57 |
1. Loans insured by the Federal Housing Administration or backed by guarantees from the U.S. Department of Veterans Affairs, the Farm Service Agency, or the Rural Housing Service. Return to table
Return to textAs shown in table 4, the post-2007 decline in non-owner-occupant lending has been more severe than that in owner-occupant lending. Between 2000 and 2005, the share of non-owner-occupant lending used to purchase one- to four-family homes rose, increasing over this period from about 9 percent to 16 percent (data derived from table 4).17 Since 2005, the share has fallen, dropping to about 11 percent in both 2009 and 2010. Although diminished since the middle of this decade, in both the volume of lending and as a share of lending, non-owner-occupant lending continues to be an important aspect of the mortgage market.
As noted, the relative importance of non-owner-occupant lending varies from place to place. In some places, such as resort towns, non-owner-occupant lending reflects the activity of both investors and purchasers of second homes. In other areas, most of the non-owner-occupant homebuying is by investors seeking to buy units for year-round rental. The HMDA data provide an opportunity to explore the geographic variation in non-owner-occupant lending across geographies, although it is not possible to distinguish between investors and second-home buyers.
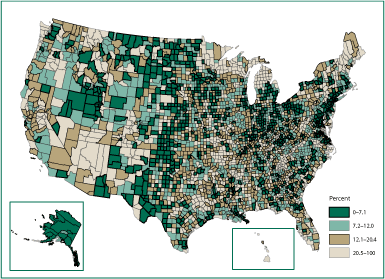
For the analysis here, we calculated the non-owner-occupant share of home-purchase lending in each county nationwide in 2010 (figure 2). Many of the counties with elevated non-owner-occupant lending rates are resort locations such as portions of northern New England, Michigan, Colorado, and some coastal areas.18 Other areas may have elevated non-owner-occupant activity due to investors purchasing homes in markets that have experienced significant declines in home values, such as the "sand states" of Arizona, California, Florida, and Nevada. The sharply reduced values of properties involved in short sales or foreclosures have afforded investors and others opportunities to purchase non-owner-occupied homes in these areas.
Nevertheless, the decline in the volume of non-owner-occupant lending that has been observed nationally has affected almost all geographic areas. In all but a handful of MSAs, the percentage decline in non-owner-occupant lending between 2005 and 2010 exceeded the decline in owner-occupant lending (figure 3). Non-owner-occupant lending has fallen the most in the MSAs that experienced the largest declines in owner-occupant lending.
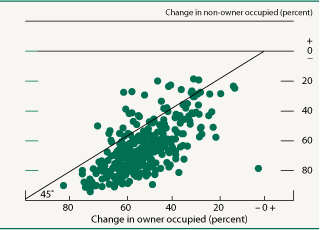
Note: First-lien home-purchase mortgages for site-built properties. For each data point, if the observations for owner occupied and for non-owner occupied are identical, the data point falls on the 45-degree line; if they are different, it falls away from the line.
Further analysis suggests that at least some of the decline in non-owner-occupant lending stems from the locations where such loans were concentrated rather than an overall change in the national market for such loans. We selected an analysis group of census tracts in the top 5 percent of the incidence of total one- to four-family non-owner-occupant lending in MSAs in the sand states (where non-owner-occupant lending has been cited as a particular problem) in 2005. We compared the decline in lending in these tracts between 2005 and 2010 with the lending changes in all other tracts in the sand state MSAs.
Overall, lending in the analysis group declined 74 percent between 2005 and 2010, although non-owner-occupant lending fell more in these tracts (78 percent) than owner-occupant lending (71 percent). In contrast, overall lending fell significantly less in tracts where non-owner-occupant lending had not been concentrated (59 percent), with non-owner-occupant lending again experiencing a relatively larger decline (70 percent) than owner-occupant lending (58 percent). It cannot be determined from these results whether characteristics of the tract neighborhoods or the high presence of non-owner-occupant lending led to the excessive decline.
Types of Loans
As noted, the total number of loans to purchase homes has fallen sharply since the height of the housing boom in 2005 and 2006, when lenders extended about 7 million loans in each of those years (table 3.B). Although the total number of home-purchase loans has fallen substantially since then, virtually all of the decline has involved conventional lending; the volume of nonconventional home-purchase loans (sometimes referred to as "government backed" loans)--including loans backed by insurance from the FHA or by guarantees from the VA, the Farm Service Agency (FSA), or the Rural Housing Service (RHS)--has increased markedly since the mid-2000s. From 2006 to 2009, the total number of reported conventional home-purchase loans fell 77 percent, while the number of nonconventional home-purchase loans more than tripled (table 4). Although the number of nonconventional home-purchase loans fell some from 2009 to 2010, such loans still accounted for 46 percent of the home-purchase loan market in 2010, down marginally from a 48 percent share in 2009 but still much greater than the 8 percent share in 2006.
Nonconventional loans are a major component of the overall home-purchase loan market, but they play a much smaller role in certain segments of the market. For example, nonconventional loans accounted for only about 1 percent of the loans extended to non-owner occupants for the purchase of a home in 2010. Also, nonconventional loans made up a relatively small share (about 25 percent) of the loans used to purchase manufactured homes (table 5).
| Year | Owner occupied | Non-owner occupied | ||
|---|---|---|---|---|
| Conventional | Nonconventional 1 | Conventional | Nonconventional1 | |
| A. Home purchase | ||||
| 2004 | 107,686 | 23,974 | 16,243 | 125 |
| 2005 | 101,539 | 27,229 | 17,927 | 56 |
| 2006 | 102,458 | 30,530 | 19,105 | 257 |
| 2007 | 95,584 | 28,554 | 13,963 | 92 |
| 2008 | 68,821 | 27,615 | 11,392 | 93 |
| 2009 | 43,253 | 20,558 | 7,895 | 29 |
| 2010 | 44,810 | 17,086 | 7,631 | 28 |
| B. Refinance | ||||
| 2004 | 79,838 | 6,922 | 6,507 | 57 |
| 2005 | 73,520 | 7,727 | 6,331 | 26 |
| 2006 | 64,969 | 11,750 | 6,240 | 68 |
| 2007 | 59,591 | 16,174 | 6,332 | 74 |
| 2008 | 44,342 | 21,926 | 6,817 | 177 |
| 2009 | 36,765 | 21,765 | 5,922 | 59 |
| 2010 | 26,304 | 9,748 | 5,013 | 69 |
| C. Home improvement | ||||
| 2004 | 17,119 | 128 | 1,269 | 5 |
| 2005 | 20,239 | 219 | 1,372 | 3 |
| 2006 | 20,886 | 490 | 1,425 | 2 |
| 2007 | 19,428 | 889 | 1,494 | 2 |
| 2008 | 12,621 | 681 | 1,324 | 36 |
| 2009 | 9,710 | 439 | 1,110 | 1 |
| 2010 | 7,963 | 427 | 991 | 2 |
1. See table 4, note 1. Return to table
Return to textAs in the home-purchase loan market, nonconventional lending has also garnered a larger share of the refinance market in the past few years, although the number of conventional loans used for refinancing still exceeds that of nonconventional loans by a wide margin (table 4). In 2006, conventional loans used for refinancing outnumbered nonconventional loans 48 to 1; in 2010, the proportion was about 6 to 1.
The increase in nonconventional home-purchase and refinance lending reflects several factors, such as increased loan-size limits allowed under the FHA and VA lending programs and reduced access (including more-stringent underwriting and higher prices) to conventional loans, particularly those that allow the borrower to finance more than 80 percent of the property value. (These factors and their role in 2010 lending are discussed in more detail in a later section, "The Continuing Role of Government in the Mortgage Market.")
The Private Mortgage Insurance Market
Historically, mortgage lenders have required a borrower to make a down payment before they would extend a loan to buy a home or refinance an existing mortgage. In the conventional loan market, lenders typically have required that a borrower make a down payment of at least 20 percent of a home's value unless the borrower received some type of third-party backing, such as mortgage insurance.
Private mortgage insurance (PMI) emerged in the 1950s alongside the longstanding FHA and VA loan programs to help bridge the gap between lenders reluctant to extend mortgages with high loan-to-value (LTV) ratios and consumers interested in borrowing more than 80 percent of the underlying home's value. For a borrower seeking a conventional loan with a low down payment, the lender can require that the borrower purchase mortgage insurance from PMI companies to protect the lender against default-related losses up to a contractually established percentage of the principal amount.
Over the years, PMI-backed loans became a significant part of the mortgage market. As a form of protection for lenders against losses from defaulting borrowers, PMI competes with FHA insurance and VA loan guarantees. Thus, the relative attractiveness of PMI at any point in time is closely related to FHA and VA underwriting and pricing decisions and the sizes of the loans these government agencies may back. PMI also competes against the willingness of lenders to bear the risk of loss through self-insurance by extending a first-lien mortgage with little or no down payment in conjunction with a junior-lien mortgage (often referred to as a "piggyback" loan). Historically, the annual volume of PMI issuance has varied in response to these competitive pressures and to the overall level of mortgage activity in any given year.
In 1993, the Mortgage Insurance Companies of America asked the FFIEC to process data from the largest PMI companies on applications for mortgage insurance and to produce disclosure statements for the public based on the data and timed to be released with the HMDA data.19 The PMI data largely mirror the types of information submitted by lenders covered by HMDA. However, because the PMI companies do not receive all of the information about a prospective loan from the lenders seeking insurance coverage, some items reported under HMDA are not included in the PMI data. In particular, loan pricing information and requests for preapproval are unavailable in the PMI data.
The seven companies that reported data for 2010 dominate the PMI industry.20 Thus, these data cover the vast majority of PMI written in the United States, allowing for meaningful analysis of these data alongside the HMDA data.21 For 2010, the seven PMI companies reported on nearly 370,000 applications for insurance leading to the issuance of 260,000 insurance policies, down from about 636,000 applications and 367,000 policies in 2009 (table 6). Both the 2009 and 2010 volumes were substantially smaller than the totals reached in 2002 and 2003, when PMI issuance was about 2 million policies a year. Overall, 61 percent of the PMI policies issued in 2010 covered home-purchase loans, and the remainder covered refinance mortgages (home-improvement loans are classified as refinance loans by the PMI reporters). Virtually all of the applications for PMI policies issued involved site-built properties; less than 0.04 percent of the policies involved manufactured homes. About 10 percent of PMI insurance applications were denied in 2010, down from about 12 percent in 2009 but still substantially higher than in 2006 and 2007, when only about 2 percent of the requests for insurance were turned down (data not shown in tables).22
| Year | Applications | Issuance | ||||||
|---|---|---|---|---|---|---|---|---|
| Owner occupied | Non-owner occupied | Owner occupied | Non-owner occupied | |||||
| Site-built | Manufactured housing 1 | Site-built | Manufactured housing1 | Site-built | Manufactured housing1 | Site-built | Manufactured housing1 | |
| A. Home purchase | ||||||||
| 2000 | 1,204,520 | n.a. | 95,549 | n.a. | 955,988 | n.a. | 75,473 | n.a. |
| 2001 | 1,266,440 | n.a. | 122,639 | n.a. | 1,002,385 | n.a. | 90,929 | n.a. |
| 2002 | 1,324,958 | n.a. | 153,277 | n.a. | 1,022,754 | n.a. | 115,573 | n.a. |
| 2003 | 1,315,221 | n.a. | 175,958 | n.a. | 1,021,476 | n.a. | 134,677 | n.a. |
| 2004 | 1,078,275 | 10,111 | 192,086 | 1,287 | 807,480 | 7,508 | 143,917 | 984 |
| 2005 | 886,749 | 10,470 | 174,174 | 1,480 | 676,758 | 7,512 | 130,945 | 1,171 |
| 2006 | 838,304 | 9,526 | 134,545 | 1,273 | 659,755 | 6,655 | 98,744 | 993 |
| 2007 | 1,260,666 | 7,928 | 148,057 | 1,113 | 1,015,240 | 5,531 | 109,772 | 774 |
| 2008 | 928,978 | 4,082 | 127,773 | 759 | 591,108 | 2,012 | 66,842 | 367 |
| 2009 | 341,311 | 535 | 14,372 | 92 | 206,878 | 125 | 5,208 | 29 |
| 2010 | 214,054 | 172 | 7,644 | 11 | 154,716 | 55 | 4,750 | |
| B. Refinance4 | ||||||||
| 2000 | 259,245 | n.a. | 14,771 | n.a. | 185,721 | n.a. | 10,859 | n.a. |
| 2001 | 856,112 | n.a. | 29,870 | n.a. | 663,465 | n.a. | 17,453 | n.a. |
| 2002 | 1,056,788 | n.a. | 40,771 | n.a. | 775,020 | n.a. | 23,035 | n.a. |
| 2003 | 1,372,551 | n.a. | 46,139 | n.a. | 1,014,558 | n.a. | 27,116 | n.a. |
| 2004 | 597,353 | 6,037 | 31,352 | 233 | 389,563 | 3,956 | 17,243 | 138 |
| 2005 | 438,019 | 3,702 | 23,217 | 136 | 309,821 | 2,384 | 13,239 | 88 |
| 2006 | 346,978 | 2,554 | 24,201 | 121 | 234,587 | 1,567 | 14,187 | 78 |
| 2007 | 507,137 | 2,108 | 36,508 | 104 | 362,961 | 1,313 | 22,533 | 58 |
| 2008 | 454,405 | 1,442 | 33,822 | 123 | 257,189 | 695 | 11,519 | 34 |
| 2009 | 275,541 | 429 | 3,611 | 15 | 153,633 | 126 | 1,121 | 4 |
| 2010 | 145,953 | 135 | 1,437 | 2 | 99,598 | 56 | 587 | 0 |
1. Before 2004, property type was not collected; totals for site-built and manufactured housing are shown in the "Site-built" column. Return to table
| Year | Memo | ||||||
|---|---|---|---|---|---|---|---|
| Conventional loans 2 | Ratio of loans with PMI to conventional loans | Nonconventional loans 3 | Ratio of loans with PMI plus nonconventional loans to total loans | Junior liens | Ratio of loans with PMI plus junior liens to conventional loans | Ratio of loans with PMI plus nonconventional loans and junior liens to total loans | |
| A. Home purchase | |||||||
| 2000 | n.a. | n.a. | n.a. | n.a. | n.a. | n.a. | n.a. |
| 2001 | n.a. | n.a. | n.a. | n.a. | n.a. | n.a. | n.a. |
| 2002 | n.a. | n.a. | n.a. | n.a. | n.a. | n.a. | n.a. |
| 2003 | n.a. | n.a. | n.a. | n.a. | n.a. | n.a. | n.a. |
| 2004 | 4,209,787 | 19.4 | 573,606 | 29.1 | 736,636 | 36.7 | 44.3 |
| 2005 | 4,520,378 | 15.2 | 437,552 | 22.7 | 1,221,999 | 42.0 | 47.1 |
| 2006 | 4,013,196 | 16.7 | 416,143 | 24.5 | 1,268,289 | 48.0 | 52.9 |
| 2007 | 3,031,606 | 33.8 | 422,450 | 41.9 | 551,343 | 51.7 | 57.6 |
| 2008 | 1,636,194 | 36.4 | 971,528 | 60.1 | 91,498 | 41.7 | 63.4 |
| 2009 | 1,128,950 | 18.4 | 1,318,940 | 62.4 | 42,083 | 22.1 | 64.1 |
| 2010 | 1,048,544 | 14.8 | 1,165,087 | 59.6 | 40,311 | 18.6 | 61.4 |
| B. Refinance 4 | |||||||
| 2000 | n.a. | n.a. | n.a. | n.a. | n.a. | n.a. | n.a. |
| 2001 | n.a. | n.a. | n.a. | n.a. | n.a. | n.a. | n.a. |
| 2002 | n.a. | n.a. | n.a. | n.a. | n.a. | n.a. | n.a. |
| 2003 | n.a. | n.a. | n.a. | n.a. | n.a. | n.a. | n.a. |
| 2004 | 6,543,036 | 6.0 | 306,995 | 10.3 | 859,752 | 19.1 | 22.7 |
| 2005 | 6,017,589 | 5.2 | 160,395 | 7.7 | 1,196,737 | 25.0 | 27.0 |
| 2006 | 4,707,669 | 5.0 | 125,718 | 7.5 | 1,588,754 | 38.7 | 40.3 |
| 2007 | 3,764,022 | 9.7 | 204,054 | 14.3 | 1,095,750 | 38.8 | 41.9 |
| 2008 | 2,554,287 | 10.1 | 532,340 | 25.6 | 400,414 | 25.7 | 38.6 |
| 2009 | 4,455,692 | 3.5 | 1,006,236 | 21.2 | 198,475 | 7.9 | 24.9 |
| 2010 | 3,990,017 | 2.5 | 661,650 | 16.4 | 162,755 | 6.6 | 19.9 |
2. First-lien mortgages for owner-occupied, one- to four-family, site-built properties; excludes business loans. Business-related loans are those for which the lender reported that the race, ethnicity, and sex of the applicant or co-applicant are "not applicable." Return to table
3. First-lien mortgages for owner-occupied, one- to four-family, site-built properties; excludes business loans. Business-related loans are those for which the lender reported that the race, ethnicity, and sex of the applicant or co-applicant are "not applicable." Loans insured by the Federal Housing Administration or backed by guarantees from the U.S. Department of Veterans Affairs, the Farm Service Agency, or the Rural Housing Service. Return to table
4. Includes home-improvement loans. Private mortgage insurance companies do not distinguish between refinance loans and home-improvement loans in reporting. Loan totals are the summation of refinance and home-improvement loans. Return to table
n.a. Not available.
PMI Private mortgage insurance.
Return to textThe large reduction in PMI activity reflects several factors, including reduced demand stemming from a sharp fall in homebuying activity and higher prices relative to alternatives, as well as tighter underwriting adopted by the PMI companies in response to elevated claims and losses experienced during the recent recession and the ongoing recovery.23 The roles of these various factors can be seen from the memo items in the last seven columns of table 6, which focus on owner-occupant site-built lending. Taken in isolation, PMI rose as a share of conventional lending from 2006 to 2007 and then fell back sharply in 2009 and further still in 2010. Some of this change reflects variation in the share of borrowers with high-LTV loans. However, as can be seen from the table, much of the change, particularly since 2008, reflects substitution among high-LTV credit enhancement alternatives, including nonconventional FHA and VA loans and junior-lien piggyback loans. Indeed, since 2008, the share of total home-purchase loans covered by one of these enhancements has remained quite stable (last column of table 6). Thus, the record low number of PMI policies issued in 2010 likely paints a very misleading picture regarding high-LTV lending. The steadily rising share of the loan market covered by some sort of credit enhancement evident in the last column of table 6 suggests that high-LTV loans, perhaps driven by a rising portion of the market that is composed of first-time homebuyers, may be at record high rather than record low levels.
Junior-Lien Lending
Junior-lien loans can be taken out either in conjunction with the primary mortgage (a piggyback loan) or independently of the first-lien loan. As noted in the previous section, piggyback loans can be used by borrowers to avoid having to pay for private or government mortgage insurance. Similarly, piggyback loans can also be used to reduce the size of the first-lien loan to be within the size limits required by Freddie Mac or Fannie Mae without requiring a larger down payment by the borrower. Junior-lien loans that are taken out independently can be used for any number of purposes, including to finance home-improvement projects or, in the case of open-ended home equity lines of credit (HELOCs), to provide a readily available and relatively cheap source of credit. Under the regulations that govern HMDA reporting, most of these stand-alone junior-lien loans are not reported.24 Most piggyback loans, however, must be reported. Thus, the volume of junior-lien lending reported under HMDA may be more indicative of the volume of piggyback lending than of junior-lien lending as a whole.
Before the financial crisis and the collapse in home values, when the use of piggyback loans was more common and the size limits on Fannie Mae and Freddie Mac purchases were lower, many more junior-lien loans were reported in the HMDA data. For example, in 2006, which represented the high-water mark for junior-lien lending, over 1.3 million conventional junior liens used for the purchase of owner-occupied properties were reported under HMDA, and another 1 million conventional junior-lien loans were taken out to refinance loans backed by owner-occupied properties (table 7). Virtually all such lending was conventional; fewer than 1,000 loans involved government-backed programs. As the elevated credit risk associated with high-LTV-ratio lending became apparent during the Great Recession and its aftermath, underwriting tightened and junior-lien loans became difficult to obtain or were no longer made available. The number of junior-lien loans for the purchase of owner-occupied homes reported under HMDA fell by more than one-half in 2007, dropped sharply again in each of the ensuing years, and decreased somewhat to about 40,000 such loans in 2010. The number of junior-lien loans used for refinancing also fell substantially starting in 2007 and continued to fall, reaching almost 88,000 in 2010. Substantial declines were also observed in the number of junior-lien loans backed by non-owner-occupied properties, whether the loans were for home purchase or refinancing.
| Year | Owner occupied | Non-owner occupied | ||||||||||
|---|---|---|---|---|---|---|---|---|---|---|---|---|
| Conventional | Nonconventional 1 | Conventional | Nonconventional1 | |||||||||
| First lien | Junior lien | Unsecured 2 | First lien | Junior lien | Unsecured2 | First lien | Junior lien | Unsecured2 | First lien | Junior lien | Unsecured2 | |
| A. Home purchase | ||||||||||||
| 2004 | 4,209,787 | 736,636 | . . . | 573,606 | 1,235 | . . . | 853,490 | 52,524 | . . . | 2,703 | 7 | . . . |
| 2005 | 4,520,378 | 1,221,999 | . . . | 437,552 | 867 | . . . | 1,049,555 | 149,954 | . . . | 1,685 | 22 | . . . |
| 2006 | 4,013,196 | 1,268,289 | . . . | 416,143 | 601 | . . . | 878,325 | 162,343 | . . . | 1,407 | 18 | . . . |
| 2007 | 3,031,606 | 551,343 | . . . | 422,450 | 1,056 | . . . | 605,714 | 50,202 | . . . | 888 | 8 | . . . |
| 2008 | 1,636,194 | 91,498 | . . . | 971,528 | 1,077 | . . . | 410,377 | 5,553 | . . . | 3,461 | 4 | . . . |
| 2009 | 1,128,950 | 42,083 | . . . | 1,318,940 | 1,472 | . . . | 287,760 | 2,036 | . . . | 3,706 | 9 | . . . |
| 2010 | 1,048,544 | 40,311 | . . . | 1,165,087 | 1,390 | . . . | 282,941 | 1,684 | . . . | 1,822 | 12 | . . . |
| B. Refinance | ||||||||||||
| 2004 | 6,185,418 | 464,170 | . . . | 304,298 | 293 | . . . | 608,956 | 12,711 | . . . | 8,069 | 13 | . . . |
| 2005 | 5,607,642 | 728,362 | . . . | 158,198 | 276 | . . . | 578,491 | 25,423 | . . . | 3,236 | 21 | . . . |
| 2006 | 4,347,348 | 1,035,602 | . . . | 121,761 | 373 | . . . | 546,430 | 38,712 | . . . | 989 | 27 | . . . |
| 2007 | 3,462,944 | 660,563 | . . . | 196,544 | 353 | . . . | 473,336 | 23,241 | . . . | 879 | 15 | . . . |
| 2008 | 2,374,781 | 219,012 | . . . | 521,863 | 380 | . . . | 328,844 | 9,070 | . . . | 3,814 | 10 | . . . |
| 2009 | 4,290,072 | 114,143 | . . . | 998,089 | 496 | . . . | 341,852 | 6,747 | . . . | 7,460 | 16 | . . . |
| 2010 | 3,855,876 | 87,943 | . . . | 653,434 | 237 | . . . | 350,517 | 5,721 | . . . | 8,078 | 8 | . . . |
| C. Home improvement | ||||||||||||
| 2004 | 357,618 | 395,582 | 151,292 | 2,697 | 2,243 | 617 | 40,028 | 8,153 | 8,160 | 30 | 54 | 10 |
| 2005 | 409,947 | 468,375 | 148,018 | 2,197 | 1,873 | 413 | 42,544 | 10,756 | 8,998 | 17 | 49 | 4 |
| 2006 | 360,321 | 553,152 | 154,257 | 3,957 | 1,735 | 423 | 43,913 | 13,739 | 8,190 | 18 | 20 | 6 |
| 2007 | 301,078 | 435,187 | 150,858 | 7,510 | 1,579 | 320 | 41,670 | 11,508 | 8,143 | 35 | 18 | 6 |
| 2008 | 179,506 | 181,402 | 155,704 | 10,477 | 1,610 | 260 | 26,482 | 5,473 | 7,215 | 135 | 13 | 10 |
| 2009 | 165,620 | 84,332 | 98,457 | 8,147 | 2,416 | 649 | 19,598 | 3,174 | 5,411 | 101 | 29 | 36 |
| 2010 | 134,141 | 74,812 | 93,659 | 8,216 | 2,660 | 928 | 17,730 | 2,482 | 5,919 | 35 | 17 | 5 |
1. See table 4, note 1. Return to table
2. Unsecured loans are collected only for home-improvement loans under the Home Mortgage Disclosure Act. Return to table
... Not applicable.
Return to textThe category in which the number of junior-lien loans reported in the HMDA data has declined the least has been junior-lien loans for home-improvement purposes. In 2010, almost 80,000 junior-lien loans were used for home improvement. While this number was down 11 percent from 2009 and 86 percent from 2005, the decline was less steep than that observed for other types of junior-lien lending. As a result, junior-lien loans used for home improvement accounted for 37 percent of junior-lien loans reported under HMDA.
Loan Sales
Among the information included in the annual HMDA data is the type of purchaser for loans that are originated and sold during the year. For purposes of reporting, lenders are provided with nine types of purchasers that may be used to classify loan sale activity. Broadly, these purchaser types can be broken into those that are government related--Ginnie Mae, Fannie Mae, Freddie Mac, and Farmer Mac--and those that are not.25 Ginnie Mae and Farmer Mac focus on loans backed directly by government guarantees or insurance, primarily FHA-insured or VA-guaranteed loans. The government-sponsored enterprises (GSEs) Fannie Mae and Freddie Mac are focused on conventional loans that meet the underwriting standards established by those entities.
Overall, 80 percent of the first-lien home-purchase and refinance loans for one- to four-family properties originated in 2010 were reported as sold during the year (data not shown in tables). The share of originations that are sold varies some from year to year and by type and purpose of the loan (table 8).26 For example, about 70 percent of the conventional loans extended in 2010 for the purchase of owner-occupied one- to four-family dwellings were sold that year. In contrast, about 93 percent of the nonconventional loans used to purchase owner-occupied homes were reported as sold in 2010. The share of conventional loans made to non-owner occupants that are reported as sold is notably smaller than that of such loans made to owner occupants, as is the share of loans extended for the purchase of manufactured homes.
| Year | Owner occupied | Non-owner occupied | ||||||
|---|---|---|---|---|---|---|---|---|
| Conventional | Nonconventional 1 | Conventional | Nonconventional1 | |||||
| Share sold | Memo: Share sold to GSEs 2 | Share sold | Memo: Share sold to GSEs2 | Share sold | Memo: Share sold to GSEs2 | Share sold | Memo: Share sold to GSEs2 | |
| A. Home purchase | ||||||||
| 2000 | 64.8 | 31.3 | 89.1 | 46.0 | 53.7 | 29.3 | 81.4 | 22.9 |
| 2001 | 66.8 | 34.6 | 86.1 | 46.2 | 57.9 | 34.0 | 92.2 | 23.0 |
| 2002 | 71.0 | 36.7 | 88.7 | 43.7 | 62.5 | 36.4 | 87.9 | 29.7 |
| 2003 | 72.3 | 33.1 | 91.2 | 40.7 | 63.1 | 31.8 | 80.8 | 21.6 |
| 2004 | 74.2 | 25.5 | 92.2 | 40.5 | 63.5 | 23.6 | 63.7 | 11.5 |
| 2005 | 75.9 | 18.7 | 89.9 | 32.6 | 69.7 | 18.0 | 49.7 | 16.3 |
| 2006 | 74.8 | 19.0 | 88.6 | 31.7 | 69.3 | 19.0 | 61.3 | 15.0 |
| 2007 | 70.1 | 29.1 | 87.6 | 32.5 | 61.4 | 26.9 | 74.9 | 27.6 |
| 2008 | 71.6 | 40.1 | 90.0 | 36.5 | 60.3 | 36.3 | 95.1 | 21.6 |
| 2009 | 70.4 | 39.7 | 91.7 | 34.5 | 57.4 | 34.1 | 88.7 | 35.6 |
| 2010 | 69.8 | 37.1 | 92.7 | 30.0 | 60.3 | 34.9 | 91.7 | 24.0 |
| B. Refinance | ||||||||
| 2000 | 47.4 | 18.0 | 84.5 | 50.0 | 47.3 | 21.7 | 86.3 | 42.8 |
| 2001 | 61.3 | 37.2 | 85.0 | 51.5 | 61.2 | 38.4 | 92.1 | 33.2 |
| 2002 | 66.8 | 40.4 | 85.7 | 45.0 | 65.9 | 43.2 | 81.3 | 45.4 |
| 2003 | 74.2 | 44.8 | 93.8 | 48.0 | 69.8 | 40.4 | 87.4 | 50.7 |
| 2004 | 69.0 | 27.6 | 93.2 | 44.2 | 62.2 | 22.6 | 88.0 | 35.9 |
| 2005 | 69.9 | 19.7 | 89.3 | 33.5 | 64.7 | 16.6 | 85.7 | 40.1 |
| 2006 | 65.7 | 15.2 | 86.8 | 31.8 | 64.9 | 15.7 | 79.0 | 29.6 |
| 2007 | 61.7 | 21.9 | 85.1 | 34.5 | 61.1 | 23.9 | 86.9 | 23.9 |
| 2008 | 65.3 | 38.0 | 88.8 | 35.4 | 56.8 | 33.0 | 95.7 | 20.4 |
| 2009 | 79.8 | 51.7 | 90.4 | 36.4 | 61.8 | 39.6 | 93.8 | 35.9 |
| 2010 | 76.8 | 46.2 | 90.2 | 38.1 | 65.4 | 40.4 | 90.5 | 43.9 |
| C. Home improvement | ||||||||
| 2000 | 6.3 | 1.1 | 15.6 | 4.7 | 4.4 | .4 | 52.9 | .5 |
| 2001 | 6.4 | 1.5 | 22.3 | 7.6 | 3.9 | .8 | 73.7 | 1.1 |
| 2002 | 5.9 | 1.4 | 28.4 | 7.1 | 4.0 | .9 | 55.3 | 3.6 |
| 2003 | 10.5 | .8 | 43.8 | 6.7 | 6.5 | .7 | 35.0 | 3.9 |
| 2004 | 23.6 | 6.0 | 48.7 | 23.5 | 23.1 | 7.5 | 20.2 | 7.4 |
| 2005 | 27.2 | 7.0 | 46.2 | 25.3 | 30.2 | 8.8 | 27.1 | 8.6 |
| 2006 | 22.0 | 5.3 | 60.4 | 31.8 | 29.4 | 8.9 | 29.5 | 15.9 |
| 2007 | 19.1 | 6.4 | 70.6 | 30.8 | 26.4 | 12.1 | 39.0 | 11.9 |
| 2008 | 14.7 | 8.7 | 80.0 | 49.2 | 20.0 | 14.5 | 74.7 | 6.3 |
| 2009 | 25.0 | 17.4 | 63.8 | 37.3 | 18.2 | 13.3 | 55.4 | 9.6 |
| 2010 | 21.3 | 13.2 | 60.6 | 34.7 | 18.4 | 12.6 | 47.4 | 28.1 |
1. See table 4, note 1. Return to table
2. Loans sold to government-sponsored enterprises (GSEs) include those with a purchaser type of Fannie Mae, Freddie Mac, Ginnie Mae, or Farmer Mac. Return to table
Return to textAlthough one of the few sources of information on loan sales, the HMDA data tend to understate the importance of the secondary market. HMDA reporters are instructed to record loans sold in a calendar year different from the year originated as being held in portfolio, leading the reported loan sales to understate the proportion of each year's originations that are eventually sold. (We deal with this issue in more detail in the later section "The Continuing Role of Government in the Mortgage Market.")
Borrower Incomes and Loan Sizes
Under the provisions of HMDA, lenders report the loan amount applied for and the applicant income that the lender relied on in making the credit decision, if income was considered in the underwriting decision. The vast majority of loan applications and loans reported under HMDA include income information. For example, in 2010, income information was not reported for only about 1 percent of the borrowers purchasing a home with a nonconventional loan and for about 3 percent of those using a conventional loan (data not shown in tables). Income information is not reported more often for refinance loans, particularly those that are nonconventional (about one-third of the FHA loans and two-thirds of the VA loans), likely because of streamlined refinance programs that do not require current income to be considered in underwriting.
While the available information on amounts borrowed and income can be evaluated in many ways, here the focus is on patterns by loan product. For home-purchase or refinance lending, borrowers using FHA and VA loans have lower mean or median incomes than other loans despite the fact that the FHA (and VA) loan limits were increased substantially in 2008, allowing the program to be used much more widely than by the lower- and moderate-income households that have been the traditional focus of the program (table 9). For example, in 2007, the year before the increase in loan limits, about 7 percent of FHA borrowers had incomes of $100,000 or more, while in 2010, the share increased to 15 percent. Overall, in 2010, the median incomes for FHA, VA, and conventional loan borrowers were $55,000, $68,000, and $110,000, respectively (data for only 2010 shown in tables).
| Upper bound of borrower income (thousands of dollars) 1 | Home purchase | Refinance | ||||||||
|---|---|---|---|---|---|---|---|---|---|---|
| FHA | VA | Other 2 | Total | Memo: Higher priced 3 | FHA | VA | Other2 | Total | Memo: Higher priced3 | |
| 24 | 5.1 | .9 | 3.2 | 3.8 | 10.4 | 3.4 | 2.8 | 1.9 | 2.1 | 11.2 |
| 49 | 42.0 | 23.4 | 25.3 | 32.1 | 48.5 | 28.2 | 20.0 | 15.8 | 16.9 | 44.7 |
| 74 | 70.0 | 57.8 | 47.1 | 57.5 | 71.0 | 58.6 | 49.4 | 36.3 | 38.4 | 70.0 |
| 99 | 85.4 | 78.2 | 63.1 | 73.5 | 82.6 | 78.7 | 71.2 | 55.2 | 57.3 | 83.9 |
| 124 | 92.7 | 89.5 | 74.4 | 83.2 | 88.6 | 89.4 | 84.7 | 69.7 | 71.5 | 90.7 |
| 149 | 96.2 | 94.8 | 81.8 | 88.8 | 91.7 | 94.5 | 91.6 | 79.2 | 80.6 | 93.9 |
| 199 | 98.7 | 98.5 | 90.0 | 94.3 | 94.9 | 98.1 | 97.2 | 89.4 | 90.2 | 96.7 |
| 249 | 99.5 | 99.5 | 93.9 | 96.7 | 96.5 | 99.1 | 99.0 | 93.9 | 94.4 | 97.8 |
| 299 | 99.7 | 99.8 | 95.9 | 97.8 | 97.3 | 99.4 | 99.6 | 96.1 | 96.4 | 98.5 |
| More than 299 | 100 | 100 | 100 | 100 | 100 | 100 | 100 | 100 | 100 | 100 |
| Memo: Borrower income, by selected loan type (thousands of dollars)1 | ||||||||||
| Mean | 65.8 | 77.6 | 110.3 | 89.2 | 79.3 | 78.1 | 85.6 | 118.5 | 114.7 | 72.4 |
| Median | 55 | 68 | 78 | 66 | 51 | 67 | 75 | 92 | 89 | 54 |
Note: First-lien mortgages for owner-occupied, one- to four-family, site-built properties; excludes business loans. Business-related loans are those for which the lender reported that the race, ethnicity, and sex of the applicant or co-applicant are "not applicable." For loans with two or more applicants, lenders covered under the Home Mortgage Disclosure Act (HMDA) report data on only two. Income for two applicants is reported jointly.
1. Income amounts are reported under HMDA to the nearest $1,000. Return to table
2. Other loans include loans originated with a Farm Service Agency or Rural Housing Service guarantee and conventional loans. Return to table
3. Higher-priced loans are those with annual percentage rates 1.5 percentage points or more above the average prime offer rate for loans of a similar type published weekly by the Federal Financial Institutions Examination Council. Return to table
FHA Federal Housing Administration.
VA Department of Veterans Affairs.
Return to textLoan amounts also differ across loan types, with FHA or VA loans, on average, being smaller than "other" loans (table 10). However, an upward shift in the distribution of loan amounts for both FHA and VA home-purchase loans occurred in the past couple of years, continuing into 2010 (data for only 2010 shown in tables). The shift likely reflects the same forces that are changing the distribution of borrower incomes.
| Upper bound of loan amount (thousands of dollars) 1 | Home purchase | Refinance | ||||||||
|---|---|---|---|---|---|---|---|---|---|---|
| FHA | VA | Other 2 | Total | Memo: Higher priced 3 | FHA | VA | Other2 | Total | Memo: Higher priced3 | |
| 24 | .1 | .0 | .5 | .3 | 4.1 | .1 | .0 | .5 | .4 | 5.6 |
| 49 | 1.6 | .4 | 3.1 | 2.3 | 18.1 | 1.1 | .5 | 2.6 | 2.3 | 19.8 |
| 74 | 8.1 | 2.3 | 9.4 | 8.3 | 35.7 | 5.5 | 3.4 | 8.0 | 7.6 | 37.1 |
| 99 | 19.7 | 7.3 | 17.6 | 17.6 | 50.0 | 13.7 | 9.6 | 16.8 | 16.2 | 52.1 |
| 149 | 48.2 | 27.8 | 37.9 | 41.3 | 71.9 | 38.3 | 31.2 | 37.6 | 37.5 | 71.9 |
| 199 | 69.7 | 53.7 | 54.0 | 60.5 | 83.4 | 61.3 | 55.2 | 55.3 | 56.0 | 82.4 |
| 274 | 86.7 | 78.1 | 70.9 | 78.0 | 91.2 | 82.2 | 78.4 | 73.5 | 74.7 | 90.5 |
| 417 | 97.0 | 95.2 | 88.3 | 92.4 | 95.9 | 95.4 | 95.7 | 92.3 | 92.8 | 97.4 |
| 625 | 99.5 | 99.3 | 96.1 | 97.8 | 98.1 | 99.2 | 99.2 | 97.5 | 97.7 | 99.1 |
| 729 | 99.9 | 99.7 | 97.5 | 98.6 | 98.6 | 99.8 | 99.7 | 98.5 | 98.7 | 99.4 |
| More than 799 | 100 | 100 | 100 | 100 | 100 | 100 | 100 | 100 | 100 | 100 |
| Memo: Loan amount (thousands of dollars) | ||||||||||
| Mean | 176.7 | 215.3 | 236.6 | 210.2 | 140.4 | 197.6 | 211.0 | 222.6 | 219.4 | 131.8 |
| Median1 | 153 | 191 | 184 | 169 | 100 | 173 | 187 | 182 | 181 | 95 |
Note: First-lien mortgages for owner-occupied, one- to four-family, site-built properties; excludes business loans. Business-related loans are those for which the lender reported that the race, ethnicity, and sex of the applicant or co-applicant are "not applicable."
1. Loan amounts are reported under the Home Mortgage Disclosure Act to the nearest $1,000. Return to table
2. See table 9, note 2. Return to table
3. See table 9, note 3. Return to table
FHA Federal Housing Administration.
VA Department of Veterans Affairs.
Return to textApplication Disposition, Loan Pricing, and Status under the Home Ownership and Equity Protection Act
For purposes of analysis, loan applications, loans, and requests for preapproval reported under HMDA can be grouped in many ways. Every loan application and request for preapproval reported in 2010 can be categorized into 25 distinct product categories characterized by type of loan and property, purpose of the loan, and lien and owner-occupancy status (tables 11 and 12). Each product category contains information on the number of total and preapproval applications, application denials, originated loans, loans with prices above the reporting thresholds established by HMDA reporting rules for identifying higher-priced loans, loans covered by the Home Ownership and Equity Protection Act of 1994 (HOEPA), and the mean and median annual percentage rate (APR) spreads for loans reported as higher priced.
Disposition of Applications
As noted, the 2010 HMDA data include information on nearly 13 million loan applications, about 85 percent of which were acted upon by the lender (data derived from table 11). Patterns of denial rates are largely consistent with what has been observed in earlier years.27 Denial rates on applications for home-purchase loans are notably lower than those observed on applications for refinance or home-improvement loans. Denial rates on applications backed by manufactured housing are much higher than those on applications backed by site-built homes. For example, the denial rate for first-lien conventional home-purchase loan applications for owner-occupied site-built properties was 15.1 percent in 2010, compared with a denial rate of 55 percent for such applications for owner-occupied manufactured homes.
| Type of home and loan | Applications | Loans originated | ||||||||||||||
|---|---|---|---|---|---|---|---|---|---|---|---|---|---|---|---|---|
| Number submitted | Acted upon by lender | Number | Loans with APOR spread above the threshold1 | |||||||||||||
| Number | Percent | Distribution, by percentage points of APOR spread | APOR spread (percentage points) | Number of HOEPA-covered loans2 | ||||||||||||
| Number | Number denied | Percent denied | 1.5-1.99 | 2-2.49 | 2.5-2.99 | 3-3.99 | 4-4.99 | 5 or more | Mean | Median | ||||||
| 1-4 FAMILY NONBUSINESS RELATED3 | ||||||||||||||||
| Owner occupied | ||||||||||||||||
| Site built | ||||||||||||||||
| Home purchase | ||||||||||||||||
| Conventional | ||||||||||||||||
| First lien | 1,468,647 | 1,280,452 | 193,739 | 15.1 | 1,002,871 | 32,983 | 3.3 | 39.7 | 21.7 | 15.7 | 15.1 | 5.1 | 2.8 | 2.5 | 2.2 | . . . |
| Junior lien | 57,538 | 51,101 | 8,539 | 16.7 | 39,910 | 5,880 | 14.7 | . . . | . . . | . . . | 40.5 | 48.7 | 10.8 | 4.3 | 4.2 | . . . |
| Government backed | ||||||||||||||||
| First lien | 1,645,713 | 1,442,912 | 230,196 | 16.0 | 1,147,045 | 14,964 | 1.3 | 80.0 | 13.9 | 3.1 | 1.6 | .5 | .9 | 1.8 | 1.7 | . . . |
| Junior lien | 1,794 | 1,532 | 143 | 9.3 | 1,347 | 9 | .7 | . . . | . . . | . . . | 33.3 | 55.6 | 11.1 | 4.4 | 4.4 | . . . |
| Refinance | ||||||||||||||||
| Conventional | ||||||||||||||||
| First lien | 6,102,081 | 5,213,320 | 1,104,659 | 21.2 | 3,825,680 | 49,359 | 1.3 | 42.0 | 17.6 | 12.8 | 13.9 | 5.8 | 8.0 | 2.7 | 2.2 | 917 |
| Junior lien | 152,757 | 139,288 | 46,906 | 33.7 | 85,338 | 10,171 | 11.9 | . . . | . . . | . . . | 31.6 | 37.5 | 30.9 | 4.8 | 4.4 | 280 |
| Government backed | ||||||||||||||||
| First lien | 1,421,776 | 1,074,474 | 357,759 | 33.3 | 643,178 | 31,696 | 4.9 | 39.3 | 35.4 | 17.5 | 6.5 | 1.0 | .3 | 2.2 | 2.1 | 277 |
| Junior lien | 443 | 330 | 83 | 25.2 | 226 | 3 | 1.3 | . . . | . . . | . . . | 33.3 | 33.3 | 33.3 | 4.9 | 4.0 | 0 |
| Home improvement | ||||||||||||||||
| Conventional | ||||||||||||||||
| First lien | 217,286 | 194,078 | 53,581 | 27.6 | 130,514 | 13,160 | 10.1 | 29.3 | 18.2 | 14.2 | 17.0 | 7.7 | 13.7 | 3.2 | 2.6 | 533 |
| Junior lien | 161,820 | 146,322 | 65,692 | 44.9 | 73,908 | 8,222 | 11.1 | . . . | . . . | . . . | 31.2 | 36.3 | 32.6 | 4.8 | 4.4 | 238 |
| Government backed | ||||||||||||||||
| First lien | 19,308 | 13,603 | 4,889 | 35.9 | 7,830 | 1,254 | 16.0 | 23.3 | 32.1 | 23.6 | 12.7 | 5.7 | 2.7 | 2.6 | 2.4 | 15 |
| Junior lien | 10,845 | 8,551 | 5,437 | 63.6 | 2,644 | 2,185 | 82.6 | . . . | . . . | . . . | 2.0 | 18.2 | 79.9 | 6.5 | 6.7 | 0 |
| Unsecured (conventional or government backed) | 187,731 | 182,267 | 85,213 | 46.8 | 90,452 | . . . | . . . | . . . | . . . | . . . | . . . | . . . | . . . | . . . | . . . | . . . |
| Manufactured | ||||||||||||||||
| Conventional, first lien | ||||||||||||||||
| Home purchase | 200,165 | 191,498 | 105,052 | 54.9 | 44,436 | 35,574 | 80.1 | 4.7 | 5.6 | 7.1 | 19.4 | 17.8 | 45.4 | 5.2 | 4.7 | . . . |
| Refinance | 54,005 | 48,665 | 19,158 | 39.4 | 25,369 | 9,063 | 35.7 | 13.6 | 10.8 | 13.1 | 24.6 | 16.6 | 21.3 | 3.9 | 3.5 | 711 |
| Other | 86,655 | 77,187 | 32,703 | 42.4 | 36,449 | 6,827 | 18.7 | 25.3 | 16.8 | 11.8 | 18.0 | 11.4 | 16.7 | 3.4 | 2.8 | 330 |
| Non-owner occupied4 | ||||||||||||||||
| Conventional, first lien | ||||||||||||||||
| Home purchase | 384,535 | 338,090 | 58,566 | 17.3 | 256,857 | 12,627 | 4.9 | 39.3 | 18.4 | 14.1 | 15.8 | 5.9 | 6.6 | 2.7 | 2.3 | . . . |
| Refinance | 606,900 | 506,110 | 150,278 | 29.7 | 327,819 | 9,656 | 2.9 | 48.1 | 17.8 | 11.5 | 12.9 | 5.1 | 4.7 | 2.5 | 2.0 | 54 |
| Other | 78,723 | 69,113 | 27,184 | 39.3 | 38,962 | 2,692 | 6.9 | 17.9 | 14.1 | 10.1 | 22.8 | 17.5 | 17.6 | 3.6 | 3.5 | 35 |
| BUSINESS RELATED3 | ||||||||||||||||
| Conventional, first lien | ||||||||||||||||
| Home purchase | 29,771 | 28,920 | 973 | 3.4 | 27,321 | 953 | 3.5 | 22.7 | 29.7 | 22.3 | 21.5 | 2.8 | 1.1 | 2.6 | 2.4 | . . . |
| Refinance | 30,632 | 29,617 | 1,612 | 5.4 | 27,525 | 727 | 2.6 | 23.4 | 27.8 | 23.7 | 19.1 | 4.0 | 2.1 | 2.6 | 2.5 | . . . |
| Other | 10,266 | 9,684 | 960 | 9.9 | 8,528 | 151 | 1.8 | 16.6 | 17.9 | 14.6 | 28.5 | 12.6 | 9.9 | 3.2 | 3.0 | . . . |
| MULTIFAMILY5 | ||||||||||||||||
| Conventional, first lien | ||||||||||||||||
| Home purchase | 8,315 | 7,689 | 1,004 | 13.1 | 6,249 | 209 | 3.3 | 32.5 | 24.9 | 25.4 | 14.8 | .5 | 1.9 | 2.4 | 2.3 | . . . |
| Refinance | 12,769 | 11,883 | 1,815 | 15.3 | 9,620 | 285 | 3.0 | 31.6 | 24.6 | 22.5 | 16.8 | 2.8 | 1.8 | 2.5 | 2.4 | 1 |
| Other | 4,400 | 4,034 | 648 | 16.1 | 3,259 | 50 | 1.5 | 46.0 | 20.0 | 12.0 | 8.0 | 12.0 | 2.0 | 2.5 | 2.1 | 0 |
| Total | 12,954,875 | 11,070,720 | 2,556,789 | 23.1 | 7,863,337 | 248,700 | 3.2 | 31.3 | 16.5 | 11.2 | 15.8 | 10.6 | 14.6 | 3.2 | 2.6 | 3,391 |
1. Average prime offer rate (APOR) spread is the difference between the annual percentage rate on the loan and the APOR for loans of a similar type published weekly by the Federal Financial Institutions Examination Council. The threshold for first-lien loans is a spread of 1.5 percentage points; for junior-lien loans, it is a spread of 3.5 percentage points. Return to table
2. Loans covered by the Home Ownership and Equity Protection Act of 1994 (HOEPA), which does not apply to home-purchase loans. Return to table
3. Business-related applications and loans are those for which the lender reported that the race, ethnicity, and sex of the applicant or co-applicant are "not applicable"; all other applications and loans are nonbusiness related. Return to table
4. Includes applications and loans for which occupancy status was missing. Return to table
5. Includes business-related and nonbusiness-related applications and loans for owner-occupied and non-owner-occupied properties. Return to table
. . . Not applicable.
Return to textIn addition to the application data provided under HMDA, nearly 443,000 requests for preapproval were reported as acted on by the lender in 2010 (table 12). About 26 percent of these requests for preapproval were denied by the lender. Not surprisingly, the number of requests for preapproval is down substantially from the levels recorded at the height of the housing boom. In 2006, covered institutions reported that they received nearly 1.2 million requests for preapproval upon which they took action (data not shown in tables).
| Type of home | Requests for preapproval | Applications preceded by requests for preapproval 1 | Loan originations whose applications were preceded by requests for preapproval | ||||||||||||||
|---|---|---|---|---|---|---|---|---|---|---|---|---|---|---|---|---|---|
| Number acted upon by lender | Number denied | Percent denied | Number submitted | Acted upon by lender | Number | Loans with APOR spread above the threshold 2 | |||||||||||
| Number | Number denied | Number | Percent | Distribution, by percentage points of APOR spread | APOR spread (percentage points) | ||||||||||||
| 1.5-1.99 | 2-2.49 | 2.5-2.99 | 3-3.99 | 4-4.99 | 5 or more | Mean spread | Median spread | ||||||||||
| 1-4 family nonbusiness related 3 | |||||||||||||||||
| Owner occupied | |||||||||||||||||
| Site built | |||||||||||||||||
| Conventional | |||||||||||||||||
| First lien | 214,845 | 50,155 | 23 | 130,475 | 21,520 | 16,756 | 85,438 | 1,676 | 2.0 | 47.6 | 23.5 | 11.3 | 11.3 | 4.6 | 1.8 | 2.3 | 2.0 |
| Junior lien | 5,327 | 942 | 18 | 3,787 | 271 | 170 | 3,196 | 1,075 | 33.6 | . . . | . . . | . . . | 28.4 | 63.7 | 7.9 | 4.3 | 4.2 |
| Government backed | |||||||||||||||||
| First lien | 175,857 | 53,837 | 31 | 109,419 | 13,499 | 12,287 | 79,928 | 1,055 | 1.3 | 87.5 | 10.2 | 1.5 | .1 | .2 | .5 | 1.8 | 1.7 |
| Junior lien | 218 | 22 | 10 | 193 | 22 | 10 | 159 | .0 | . . . | . . . | . . . | . . . | . . . | . . . | . . . | . . . | |
| Manufactured | |||||||||||||||||
| Conventional, first lien | 13,777 | 1,288 | 9 | 12,241 | 1,483 | 4,436 | 4,283 | 2,364 | 55.2 | 16.3 | 5.1 | 6.0 | 9.1 | 10.1 | 53.4 | 5.6 | 5.3 |
| Other | 2,147 | 781 | 36 | 1,324 | 286 | 255 | 724 | 15 | 2.1 | 73.3 | 13.3 | 13.3 | . . . | . . . | . . . | 1.9 | 1.7 |
| Non-owner occupied 4 | |||||||||||||||||
| Conventional, first lien | 28,822 | 5,378 | 19 | 19,395 | 2,983 | 2,290 | 13,045 | 427 | 3.3 | 41.0 | 16.6 | 14.1 | 14.3 | 9.6 | 4.5 | 2.7 | 2.3 |
| Other | 1,195 | 450 | 38 | 724 | 258 | 295 | 154 | 10 | 6.5 | 20.0 | . . . | . . . | 40.0 | 10.0 | 30.0 | 4.3 | 3.7 |
| Business related3 | |||||||||||||||||
| Conventional, first lien | 398 | 19 | 5 | 372 | 41 | 17 | 309 | 15 | 4.9 | 13.3 | 26.7 | 46.7 | 6.7 | 6.7 | .0 | 2.7 | 2.8 |
| Other | 106 | 5 | 5 | 98 | 12 | 19 | 65 | 1 | 1.5 | . . . | . . . | . . . | 100.0 | . . . | . . . | 3.9 | 3.9 |
| Multifamily 5 | |||||||||||||||||
| Conventional, first lien | 96 | 4 | 4 | 88 | 9 | 10 | 67 | 3 | 4.5 | . . . | 33.3 | 66.7 | . . . | . . . | . . . | 2.4 | 2.6 |
| Other | 15 | 15 | 5 | 2 | 8 | 1 | 12.5 | 100.0 | . . . | . . . | . . . | . . . | . . . | 1.6 | 1.6 | ||
| Total | 442,803 | 112,881 | 25 | 278,131 | 40,389 | 36,547 | 187,376 | 6,642 | 3.5 | 34.6 | 10.6 | 6.3 | 11.7 | 15.8 | 21.2 | 3.8 | 2.9 |
1. These applications are included in the total reported in table 11. Return to table
2. See table 11, note 1. Return to table
3. See table 11, note 3. Return to table
4. See table 11, note 4. Return to table
5. See table 11, note 5. Return to table
... Not applicable.
Return to textRule Changes Related to Higher-Priced Lending
The rules governing whether a loan is classified as higher priced under HMDA were changed in 2008, with implementation affecting loan classifications for applications after October 1, 2009. All loans reported in the 2010 HMDA data, regardless of the date of application, are covered under the new rules. The purpose of the rule change was to address concerns that had arisen about the distortive effects of changes in the interest rate environment on the reporting of higher-priced lending under the original methodology.28 Under the original methodology, changes in underlying market rates of interest, particularly a steepening or flattening of the yield curve, could result in two loans of equivalent credit and prepayment risk being classified differently under HMDA as higher priced or not at different points in time, an outcome that was unintended.29
To address the distortions arising from the method used to classify loans as higher priced or not, the price-reporting rules under HMDA were modified. Lenders are now required to compare the APR on the loan with the "average prime offer rate" (APOR) for loans of a similar type (for example, a 30-year fixed-rate mortgage). The APOR, which is published weekly by the FFIEC, is an estimate of the APR on loans being offered to high-quality prime borrowers based on the contract interest rates and discount points reported by Freddie Mac in its Primary Mortgage Market Survey (PMMS).30 If the difference is more than 1.5 percentage points for a first-lien loan or more than 3.5 percentage points for a junior-lien loan, then the loan is classified as higher priced and the rate spread is reported. Since APORs move with changes in market rates and are product specific, it is anticipated that the distortions that existed under the old methodology will be overcome.
The Incidence of Higher-Priced Lending
The data show that the incidence of higher-priced lending across all products in 2010 was about 3.2 percent (table 11).31 The incidence varies across loan types, products, and purposes. First, in almost all cases, nonconventional loans have a lower incidence of higher-priced lending than do comparable conventional loan products, although the differences in incidence are much smaller than in the period when many conventional loans were subprime or near prime. In 2010, among first-lien home-purchase loans for site-built homes, 3.3 percent of conventional loans had APRs above the price-reporting threshold, versus 1.3 percent of nonconventional loans. Second, with few exceptions, first-lien loans have a lower incidence of higher-priced lending than do junior-lien loans for the same purposes. For example, in 2010, the incidence of higher-priced lending for conventional first-lien refinance loans was 1.3 percent, whereas for comparable junior-lien loans it was 11.9 percent. This relationship is found despite the fact that the threshold for reporting a junior-lien loan as higher priced is 2 percentage points higher than it is for so reporting a first-lien loan. Third, manufactured-home loans exhibit the greatest incidence of higher-priced lending across all loan categories, a result consistent with the elevated credit risk associated with such lending. For 2010, 80 percent of the conventional first-lien loans used to purchase manufactured homes were higher priced.
Rate Spreads for Higher-Priced Loans
Although there is considerable variation across loan products in the incidence of higher-priced lending, the variation across products in mean and median APOR spreads as reported in the HMDA data is much smaller. For example, for 2010, the mean APOR spread reported for higher-priced conventional first-lien loans for the purchase of an owner-occupied site-built home was about 2.5 percentage points, compared with about 1.8 percentage points for higher-priced first-lien nonconventional loans used for the same purpose (table 11).
It is worth noting that the vast majority of nonconventional loans reported as higher priced in 2010 exceeded the HMDA price-reporting thresholds by only a small amount: Specifically, 80 percent of the higher-priced nonconventional first-lien home-purchase loans had reported spreads within 50 basis points of the threshold. By comparison, only about 40 percent of the comparable conventional loans reported as higher priced had prices this close to the margin of reporting. In contrast, the share of higher-priced nonconventional refinancing loans with APORs close to the margin of reporting (39 percent) is a little less than the share of higher-priced conventional refinancing loans with such APORs (about 42 percent).
As expected, consistent with the higher reporting threshold of junior-lien lending, higher-priced junior-lien loan products have higher mean and median APOR spreads than do higher-priced first-lien loans. Higher-priced loans for manufactured homes differ from other loan products in that they generally have the highest mean spreads. In 2010, the typical higher-priced conventional first-lien loan to purchase a manufactured home had a reported spread of about 5.2 percentage points, compared with an average spread of roughly 2.5 percentage points for comparable higher-priced loans for site-built properties.
HOEPA Loans
The HMDA data indicate which loans are covered by the protections afforded by HOEPA. Under HOEPA, certain types of mortgage loans that have interest rates or fees above specified levels require additional disclosures to consumers and are subject to various restrictions on loan terms.32 For 2010, 655 lenders reported extending nearly 3,400 loans covered by HOEPA (table 11; data regarding lenders not shown in tables). In comparison, 1,153 lenders reported on about 6,500 loans covered by HOEPA in 2009. In the aggregate, HOEPA-related lending made up less than 0.1 percent of all of the originations of home-secured refinancings and home-improvement loans reported for 2010 (data derived from tables).33
Factors Influencing Refinancing Activity in 2010
As discussed earlier, the APOR for a 30-year fixed-rate mortgage fell sharply at the end of 2008 and into 2009, and then it fell to well under 5 percent in 2010 (figure 1). Moreover, these rate declines appear to have sparked elevated refinance activity in early 2009 and late 2010. Still, overall refinance activity in both 2009 and 2010 appears low compared with what might have been expected given the sharp decline in interest rates. For example, interest rates last fell sharply in the early 2000s, and refinance volume peaked in 2003 at over 15 million loans, more than the combined refinance volume in 2009 and 2010 (table 3.B).
One explanation for subdued refinance activity is that lenders may be less willing or less able to take risk than earlier in the decade. The Federal Reserve's quarterly Senior Loan Officer Opinion Survey on Bank Lending Practices indicates that lenders have tightened credit standards during the past few years.34 Lenders could also be adjusting prices in light of perceptions that borrowers with the same nominal characteristics (credit score, for example) pose more risk now than they did several years ago because of the substantially weaker and more uncertain conditions in employment and housing markets. Lenders may also be pricing risk more stringently because they are passing on certain fees from the GSEs. In 2008, both Fannie Mae and Freddie Mac started charging additional fees ("loan-level pricing adjustments") on loans to borrowers in credit score and LTV ranges in which they had not charged such fees before. In addition to these factors, the increased fees and tighter underwriting by PMI companies noted earlier and the increased presence of junior-lien loans--which must be closed, refinanced, or resubordinated--relative to the past may also be impeding refinance activity.
Subdued refinance activity may also stem from the fact that the financial standing of many borrowers has been undermined by sharp house price declines and the associated loss of home equity, especially for those residing in Arizona, California, Florida, Michigan, and Nevada, where home prices fell more than 20 percent from the end of 2006 to the end of 2009, according to the Federal Housing Finance Agency (FHFA) home price index.35 A borrower with little or no home equity may need to pay down his or her loan balance substantially before being able to qualify for a refinance, which could be difficult.
That said, a few programs have been introduced in recent years to help facilitate refinancing for those with little or no equity. Perhaps most notable is the Home Affordable Refinance Program. To be eligible, borrowers must be current on their payments, and their loans must have been originated before June 2009, be backed by the GSEs, and have balances that do not exceed 125 percent of the respective home values. Thus far, the program has had less of an effect than initially expected, perhaps because of some issues raised previously, such as getting junior-lien holders to agree to resubordinate their loans under the new refinance loan.36
To help describe refinance activity in more detail than is possible with the HMDA data, we draw on a relatively new data source--the FRBNY Consumer Credit Panel/Equifax. The panel is a nationally representative longitudinal database of individuals with detailed information, at a quarterly frequency beginning in 1999, on consumer and mortgage debt and loan performance drawn from the credit records collected and maintained by Equifax, one of the three national credit bureaus.37 The data include three key pieces of information with respect to this analysis: (1) details on each mortgage outstanding for a given consumer, including the year of origination and current balance; (2) each consumer's credit score as of the end of 2009; and (3) each consumer's geographic location at the level of the census block (a subunit of a census tract).38
Refinance mortgage loans are not explicitly identified in the credit bureau data, but because we can follow a given mortgage borrower over time, we can infer whether that borrower refinanced his or her mortgage during any particular period. Estimates of "refinance rates" (the shares of borrowers that refinanced their mortgages) during 2010 are provided by credit score, geography, and year of loan origination for those with mortgages outstanding as of the end of 2009 (table 13, top panel). To simplify the analysis, we focus on consumers who had exactly one closed-end mortgage with an outstanding balance of at least $50,000 as of the end of 2009 and stayed in the same census block over the course of 2010 (a proxy for not having changed residence; we simply want to omit from the analysis those who moved).39 We then look at their mortgage accounts at the end of 2010 and classify consumers as having refinanced during 2010 if they (1) opened at least one closed-end mortgage in 2010 and (2) no longer had a positive-balance mortgage with an origination date matching that of the mortgage that was outstanding at the end of 2009.
| Year of loan origination | Estimated refinance rates during 2010 | ||||||||||
|---|---|---|---|---|---|---|---|---|---|---|---|
| Credit score category 1 | Memo | ||||||||||
| Less than 680 | 680-719 | 720-819 | 820 or more | All | APOR difference 3 | Proportion of borrowers | |||||
| Steepest declines 2 | Other2 | Steepest declines2 | Other2 | Steepest declines2 | Other2 | Steepest declines2 | Other2 | ||||
| Before 2003 | .7 | 1.9 | 4.5 | 7.1 | 9.1 | 12.8 | 10.8 | 13.5 | 8.5 | n.a. | 10.3 |
| 2003 | 1.3 | 2.1 | 6.8 | 8.4 | 11.4 | 14.1 | 14.2 | 15.3 | 11.6 | 1.1 | 13.5 |
| 2004 | .8 | 1.8 | 5.0 | 8.2 | 11.2 | 14.7 | 15.8 | 18.1 | 10.5 | 1.2 | 8.4 |
| 2005 | .6 | 1.8 | 4.5 | 9.3 | 10.0 | 16.6 | 15.8 | 22.8 | 10.3 | 1.2 | 10.7 |
| 2006 | .5 | 2.4 | 3.9 | 10.8 | 9.4 | 19.4 | 17.0 | 23.1 | 9.2 | 1.7 | 10.9 |
| 2007 | 1.3 | 3.8 | 4.4 | 12.1 | 11.5 | 19.7 | 17.0 | 24.0 | 10.9 | 1.6 | 12.6 |
| 2008 | 5.6 | 6.1 | 12.3 | 14.7 | 20.1 | 22.7 | 27.2 | 28.9 | 16.8 | 1.3 | 13.0 |
| 2009 | 5.0 | 4.5 | 7.8 | 6.2 | 10.8 | 8.6 | 15.1 | 10.5 | 8.4 | .4 | 20.6 |
| Memo | |||||||||||
| All origination years | 1.7 | 3.2 | 6.4 | 9.7 | 11.8 | 14.8 | 15.6 | 17.4 | 10.7 | . . . | 100.0 |
| Proportion of borrowers | 7.0 | 22.0 | 2.0 | 7.6 | 11.1 | 37.7 | 3.7 | 8.8 | 100.0 | . . . | . . . |
| Estimated refinance rates during 2003 | |||||||||||
| Before 1996 | 21.6 | 18.3 | 30.2 | 28.9 | 33.6 | 34.9 | 31.1 | 29.1 | 29.3 | n.a. | 11.6 |
| 1996 | 24.0 | 18.6 | 30.4 | 36.7 | 43.2 | 40.4 | 30.8 | 37.9 | 32.1 | 2.1 | 2.7 |
| 1997 | 25.0 | 18.5 | 36.0 | 38.4 | 47.6 | 46.8 | 42.5 | 41.0 | 35.6 | 1.9 | 3.4 |
| 1998 | 24.1 | 20.8 | 41.3 | 39.3 | 49.8 | 45.5 | 51.3 | 44.2 | 39.4 | 1.2 | 12.0 |
| 1999 | 25.7 | 19.9 | 41.4 | 39.2 | 48.1 | 44.7 | 48.2 | 39.3 | 36.3 | 1.7 | 10.3 |
| 2000 | 27.6 | 21.6 | 48.1 | 43.9 | 48.1 | 47.1 | 36.8 | 45.3 | 34.2 | 2.3 | 5.9 |
| 2001 | 35.6 | 28.2 | 46.0 | 39.1 | 52.5 | 46.6 | 57.9 | 47.8 | 41.4 | 1.2 | 25.3 |
| 2002 | 29.1 | 24.3 | 34.9 | 29.7 | 38.2 | 32.8 | 47.1 | 33.6 | 31.4 | .7 | 28.8 |
| Memo | |||||||||||
| All origination years | 28.7 | 23.1 | 39.3 | 35.4 | 44.3 | 40.7 | 44.7 | 38.6 | 35.5 | . . . | 100.0 |
| Proportion of borrowers | 8.1 | 23.7 | 3.3 | 9.5 | 12.9 | 38.8 | 1.3 | 2.5 | 100.0 | . . . | . . . |
1. Credit scores for borrowers are measured as of the beginning of the year. Return to table
2. "Steepest declines" consists of the five states with the steepest declines in house prices from 2006 to 2009: Arizona, California, Florida, Michigan, and Nevada; "other" consists of all remaining states. Return to table
3. The average prime offer rate (APOR), which is published weekly by the Federal Financial Institutions Examination Council, is an estimate of the annual percentage rate on 30-year fixed-rate loans being offered to high-quality prime borrowers based on the contract interest rates and discount points reported by Freddie Mac in its Primary Mortgage Market Survey. The APOR difference is the difference in average annual APOR between the year of loan origination and the year of refinance. For 2010, the average annual APOR is 4.75 percent; for 2003, it is 5.885 percent. Return to table
n.a. Not available.
... Not applicable.
Source: Federal Reserve Bank of New York Consumer Credit Panel/Equifax.
Return to textEstimated refinance rates in 2010 were highest among consumers with pristine credit scores (820 or higher) whose loans were originated between 2006 and 2008--years with relatively high interest rates.40 Within these origination years, lower credit scores were associated with much lower refinance rates within both groups of states. For example, in "other" states--those states that did not experience the largest declines in home values--refinance rates for consumers with credit scores of 680 to 719 were less than half of those for consumers with the highest credit scores.
Estimated refinance rates are also generally lower for borrowers in the five states that experienced house price declines of 20 percent or more ("sharpest declines") within each score group, especially for loans originated between 2005 and 2007--the time that house prices peaked. Those who purchased homes without significant down payments or reduced their equity substantially through refinancing during this period would have been most affected by declining house prices. Also, the difference in refinance rates tends to rise as credit scores fall, suggesting that low equity seems to compound the problem of lower scores in efforts to refinance. For example, among those with loans originated in 2006, the estimated refinance rate for consumers with pristine credit scores is nearly 25 percent in the other states, compared with roughly 17 percent in the states with the sharpest declines, while for the group with the second-highest score (720-819), this difference becomes more pronounced--about 19 percent versus 9 percent.
In contrast, analogous estimates for 2003 in the bottom panel of table 13 indicate that refinance rates that year did not vary systematically across state groups and did not fall with credit scores until scores dropped below 680. In other words, the current pattern of refinance activity across state and credit score groups does not appear to be explained by historical precedent. The findings overall provide evidence consistent with the view that losses of home equity, weak economic conditions, and tighter underwriting (whether due to decreased appetite for risk or an increased assessment of risk) damped refinance activity in 2010.41
We can use the estimates in table 13 to make an inference about the share of mortgagors at the end of the 2009 who would have refinanced during 2010 if home equity was not an impediment and underwriting was similar to what it was in 2003 (that is, similar across credit score groups except for the group with scores below 680). Specifically, if we assume that refinance rates for each state-score-year group were identical to the refinance rates for those with pristine scores in other states and that, as in 2003, refinance rates for those with scores below 680 are about 60 percent of what they were for pristine score types, then the overall refinance rate in 2010 would have been just over 16 percent instead of just under 11 percent.42
This "counterfactual" refinance rate might be conservative since it abstracts away from the problems posed by the increased incidence of junior liens, noted earlier. However, we also estimated refinance rates for those with a positive-balance HELOC and found nearly identical refinance rates as those shown in table 13.43 The counterfactual rate might also be conservative because declining house prices affected borrowers in the other states at least to some extent, but, notably, we found refinance rates for those in the subset of states where prices have not declined since 2006 to be very similar to those for the other states as a whole (data not shown in tables). Overall, this exercise suggests that refinance rates could have been just over 5 percentage points, or just over 50 percent, higher in the absence of home equity problems and underwriting changes. Applying that number to the HMDA data implies that roughly an additional 2.3 million first-lien owner-occupant refinance loans would have been made during 2010 on top of the roughly 4.5 million such loans that were in fact originated (data derived from table 7).
The Continuing Role of Government in the Mortgage Market
The HMDA data for 2008 and 2009 showed that the share of new mortgage loans either explicitly or implicitly guaranteed by the federal government rose dramatically from 2006. This increased government role continued in 2010, with the share of loans that were originated through the FHA, VA, and, to a much lesser extent, FSA or RHS programs, or that were owned outright or in mortgage pools guaranteed by Fannie Mae or Freddie Mac, remaining about the same as it was in 2009. This section discusses the underlying causes of this trend. To facilitate our analysis, we employ a revised data set designed to correct for one of the limitations in the HMDA reporting system.
Under HMDA reporting rules, all loans originated under the FHA, VA, FSA, or RHS programs must be identified as such.44 However, loans placed in pools that are guaranteed by or sold to the GSEs Fannie Mae and Freddie Mac are identified only if they are sold directly to the GSEs or directly placed in a pool during the same year of the loan origination. The HMDA data therefore tend to undercount loans ultimately sold to the GSEs for two reasons. First, sales can take place in a year subsequent to origination, especially among loans originated during the fourth quarter. Second, lenders may not sell loans directly to the GSEs but instead may sell them to other financial institutions that form mortgage pools for which investors subsequently obtain GSE credit guarantees.
For the analysis in this section, we adjust the HMDA data to attempt to correct for the undercount of GSE loans. First, in addition to reporting their mortgage originations, financial institutions are also required to report their loan purchases and the types of purchasers if the loans are resold. Using information on loan size, location, date of origination, and date of purchase, we were able to match more than 50 percent of the loans that were originated from 2006 to 2010 and then sold to other financial institutions to the records for the same loans in the loan purchase files. From those matched loans, we were then able to obtain the ultimate loan dispositions from the filings of loan purchases. Of the portion we were unable to match, most were originated (and purchased) by one large organization, which supplied us with the aggregate disposition of the purchased loans. For those sold loans that we were still unable to match, we assumed that the distribution of the ultimate disposition matched that of similar loans that we could match.
Second, to address the undercount of GSE loans originated in October through December of each year, we used an imputation formula based on the allocation of loans originated in the preceding September and the following January to assign the ultimate disposition of conventional loans.45 The imputation was conducted separately for the largest mortgage originators and took account of the characteristics of the loan, including size and location.
Figure 4 illustrates the changing structure of the mortgage market between 2006 and 2010 using our adjusted data for the four major loan types reported under HMDA. It groups first-lien site-built mortgages into four distinct categories: (1) loans insured by the FHA, backed by the VA, or issued or guaranteed by the FSA or RHS ("nonconventional"); (2) conventional loans sold to Fannie Mae or Freddie Mac or placed in pools guaranteed by them ("GSE"); (3) conventional loans sold to an affiliate or held in the portfolio of the originating lender ("portfolio"); and (4) all other conventional loans, including those sold into the private securitization market or to unaffiliated institutions ("other"). Panels 4.A, 4.B, and 4.C show patterns for owner-occupant home-purchase, refinance, and home-improvement loans; panel 4.D shows patterns for all non-owner-occupant loans regardless of purpose.46
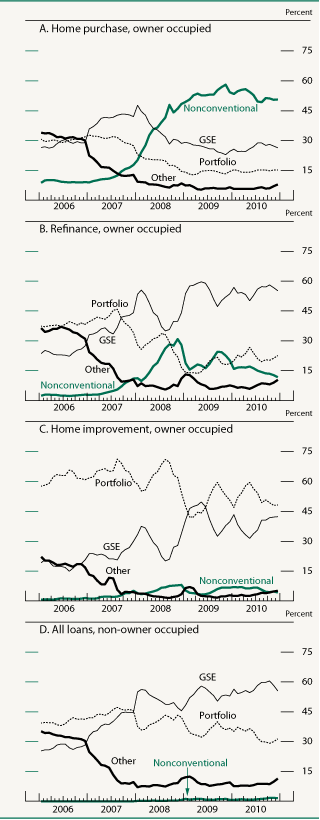
Note: The data are monthly. Loans are first liens on one- to four-family, site-built properties and exclude business loans. Business-related loans are those for which the lender reported that the race, ethnicity, and sex of the applicant or co-applicant are "not applicable." For definitions of loan types, see text.
Our adjusted data show a greater role for the GSEs than that implied by the raw HMDA data. The raw HMDA data reported by lenders show that 39.6 percent of owner-occupant refinance loans originated in 2010 were reported as sold directly to the GSEs or placed in a mortgage pool guaranteed by them (data derived from tables 7 and 8); our revised data imply that the "correct" figure is likely to be much higher (over 55 percent).
The data in figure 4 show that the subprime-based private securitization market declined at the end of 2006 and throughout 2007, while the GSEs gained market share. Portfolio and nonconventional market shares remained relatively constant until the end of 2007. The years 2008 through 2010 show a different dynamic, with nonconventional home-purchase market share rising dramatically and then remaining constant before dropping somewhat in 2010. The GSEs play a much more prominent role in the refinance market; their share rose dramatically at the beginning of 2008, fell through August, and then rose again into 2009 and 2010. Portfolio and other lending dropped precipitously from 2007 to 2009 before increasing somewhat in 2010, particularly in the refinance market.
These changing patterns reflect the actions of a number of players. Nonconventional lending has traditionally focused on the high-LTV market, offering investors mortgage insurance protection against borrower default. PMI companies also offer similar insurance for high-LTV conventional loans, with PMI (or some other credit enhancement) required by statute for loans with LTVs above 80 percent that are sold to the GSEs. Lenders can also choose to forgo PMI and (1) hold the loan directly or (2) issue a junior-lien piggyback loan for the portion of the loan above 80 percent and still sell the 80 percent loan to the GSEs. The choice among PMI, public mortgage insurance, or a piggyback loan is likely to be made by borrowers (and lenders) based on the relative pricing and underwriting standards of the PMI and the nonconventional loan products. Prices and underwriting established by purchasers in the secondary market also matter. Both GSEs charge fees for loans they purchase or guarantee, with the fees varying by LTV and credit quality and subject to change over time. The GSE, FHA, and VA programs are also subject to statutory limits on loan size, which can and have been changed. Finally, the willingness of financial institutions to hold mortgages in portfolio is likely to be sensitive to their cost of funds, their capital position, and other factors.
Many of these items have changed over the past five years and likely influenced lending outcomes, as described in previous articles. Relative to previous years, there was relatively little change in 2010. The most notable event, discussed earlier, was the expiration of the first-time homebuyer tax credit program. The program--which, in an earlier article, we estimated that one-half of the home-purchase loans in 2009 qualified for--expired in April 2010 for loans closing through June 2010. By targeting first-time homebuyers, the program likely stimulated demand for high-LTV home-purchase mortgages. An FHA loan may have had particular appeal for such borrowers because the FHA allowed the tax credit to be used in advance as part of the down payment. This factor may potentially explain the decline in nonconventional market share in the latter part of 2010. However, another factor may also have been in play. In April 2010, the FHA raised its upfront underwriting fee 0.5 percentage point.47 The share of nonconventional loans in the home-purchase market peaked in April--well before the end of the first-time homebuyer tax credit program--and fell about 4 percentage points, remaining at that level through the end of the year. Notably, the share of nonconventional loans in the refinance market, which was unaffected by the tax credit program, peaked in May and declined about 4 percentage points thereafter.
In the sections that follow, we discuss the differential implications that these changes may have had for particular groups and the potential effects that proposed changes in the GSE and FHA limits may have on the marketplace.
Demographic Patterns
As discussed earlier, 2008 and 2009 were characterized by the increased roles of the GSEs and of the FHA, VA, FSA, and RHS programs. Such government-related lending continued at roughly the same levels in 2010. This section examines how government-related lending played out differently across borrower groups. We differentiate among borrowers by race and ethnicity, relative income (for both the neighborhood and the borrower), location (state), type of lender, and indicators of low-quality lending.
Changes in the share and number of home-purchase and refinance loans from 2006 to 2010 for different groups are shown (tables 14.A and 14.B). These data indicate different patterns for home-purchase lending compared with refinance lending. For example, the shares of home-purchase loans to black and Hispanic-white borrowers decreased from 2006 to 2009, but the decrease in these groups' shares of the refinance market was more severe and continued in 2010. Also, the share of refinance loans to borrowers with low or moderate incomes (LMIs) fell significantly from 2006 to 2010, while the share of home-purchase loans to such borrowers increased significantly. Most of this growth took place in 2008 and 2009 but was sustained in 2010, when the first-time homebuyer tax credit program was still in place. Notably, the share of home-purchase lending to LMI borrowers fell significantly in the second half of 2010, after the homebuyer program expired (data not shown in tables).
| Characteristic | Nonconventional 1 | GSE 2 | Other 3 | Portfolio 4 | Overall incidence | Memo: Total loans |
|---|---|---|---|---|---|---|
| 2006 | ||||||
| Minority status of borrower 5 | ||||||
| Black or African American | 12.7 | 5.0 | 11.6 | 7.5 | 8.6 | 378,832 |
| Hispanic white | 9.7 | 7.4 | 16.8 | 12.0 | 12.0 | 530,196 |
| Asian | 1.0 | 4.7 | 4.7 | 4.8 | 4.4 | 193,106 |
| Non-Hispanic white | 67.4 | 72.4 | 53.7 | 63.2 | 63.2 | 2,788,537 |
| Other minority or missing 6 | 9.3 | 10.6 | 13.3 | 12.5 | 11.9 | 524,820 |
| LMI census tract or borrower 7 | ||||||
| Census tract | 16.6 | 12.1 | 18.7 | 15.7 | 15.7 | 694,040 |
| Borrower | 39.7 | 24.9 | 20.0 | 23.4 | 24.3 | 1,071,650 |
| Other 8 | 52.6 | 65.6 | 61.6 | 60.6 | 61.6 | 2,718,443 |
| Missing 9 | 1.0 | 2.8 | 6.4 | 7.0 | 5.0 | 221,735 |
| Loan characteristic or occupancy status | ||||||
| High payment-to-income ratio 10 | 10.1 | 11.4 | 23.5 | 17.0 | 16.9 | 744,714 |
| Non-owner occupant 11 | .1 | 16.4 | 15.7 | 19.3 | 15.8 | 828,530 |
| Property location 12 | ||||||
| Sand states | 7.6 | 15.4 | 31.6 | 23.9 | 22.4 | 989,164 |
| Rust states | 14.6 | 17.3 | 11.6 | 13.9 | 14.2 | 626,722 |
| Other | 77.8 | 67.3 | 56.8 | 62.2 | 63.4 | 2,799,605 |
| Type of lender | ||||||
| Depository | 34.6 | 45.4 | 24.6 | 59.8 | 42.1 | 1,857,480 |
| Affiliate of depository | 24.8 | 38.8 | 23.5 | 12.2 | 24.5 | 1,083,165 |
| Independent mortgage company | 40.6 | 15.8 | 52.0 | 28.0 | 33.4 | 1,474,846 |
| Memo | ||||||
| Share of loans 13 | 9.4 | 28.4 | 31.9 | 30.2 | 100.0 | . . . |
| Number of loans | 415,642 | 1,255,763 | 1,410,690 | 1,333,396 | 4,415,491 | 4,415,491 |
Note: See general note to table 10.
1. See table 4, note 1. Return to table
2. See table 8, note 2. Return to table
3. Other loans are conventional loans sold to non-government-related or non-affiliate institutions. Return to table
4. Portfolio loans are conventional loans held by the lender or sold to an affiliate institution. Return to table
5. Categories for race and ethnicity reflect revised standards established in 1997 by the Office of Management and Budget. Applicants are placed under only one category for race and ethnicity, generally according to the race and ethnicity of the person listed first on the application. However, under race, the application is designated as joint if one applicant reported the single designation of white and the other reported one or more minority races. If the application is not joint but more than one race is reported, the following designations are made: If at least two minority races are reported, the application is designated as two or more minority races; if the first person listed on an application reports two races, and one is white, the application is categorized under the minority race. For loans with two or more applicants, lenders covered under the Home Mortgage Disclosure Act report data on only two. Return to table
6. Other minority consists of American Indian or Alaskan Native, and Native Hawaiian or other Pacific Islander. "Missing" indicates that information for the characteristic was missing on the application. Return to table
7. Low- or moderate-income (LMI) borrowers have lower income, or the property is in a lower-income census tract. Borrower income is the total income relied upon by the lender in the loan underwriting. Income is expressed relative to the median family income of the metropolitan statistical area (MSA) or statewide non-MSA in which the property being purchased is located. "Lower" is less than 80 percent of the median. The income category of a census tract is the median family income of the tract relative to that of the MSA or statewide non-MSA in which the tract is located. "Lower" is less than 80 percent of the median. Return to table
8. Other consists of all non-lower- and non-missing-income borrowers who are not in a lower-income census tract. Return to table
9. Income was not relied upon in the underwriting of the loan. Return to table
10. High payment-to-income ratio is 30 percent or more. Return to table
11. Loan share is calculated as the percentage of non-owner-occupant loans to total first-lien mortgages for one- to four-family, site-built properties; excludes business loans. Return to table
12. "Sand states" consist of Arizona, California, Florida, and Nevada; "rust states" consist of Illinois, Indiana, Michigan, Ohio, and Wisconsin; "other" consists of all other states. Return to table
13. Loan share is calculated for all first-lien mortgages for owner-occupied, one- to four-family, site-built properties; excludes business loans in the appropriate year. Return to table
... Not applicable.
| Characteristic | Nonconventional1 | GSE2 | Other3 | Portfolio4 | Overall incidence | Memo: Total loans |
|---|---|---|---|---|---|---|
| 2007 | ||||||
| Minority status of borrower5 | ||||||
| Black or African American | 13.5 | 6.1 | 7.3 | 7.2 | 7.5 | 260,102 |
| Hispanic white | 10.0 | 8.2 | 9.4 | 10.8 | 9.4 | 324,813 |
| Asian | .9 | 4.6 | 4.7 | 5.3 | 4.4 | 151,796 |
| Non-Hispanic white | 65.7 | 69.9 | 66.6 | 64.6 | 67.2 | 2,319,963 |
| Other minority or missing6 | 9.9 | 11.1 | 12.0 | 12.0 | 11.4 | 393,252 |
| LMI census tract or borrower7 | ||||||
| Census tract | 16.5 | 13.3 | 13.7 | 15.4 | 14.4 | 496,923 |
| Borrower | 34.0 | 25.4 | 22.9 | 23.8 | 25.6 | 881,813 |
| Other8 | 56.8 | 64.9 | 64.6 | 62.7 | 63.2 | 2,179,254 |
| Missing9 | 1.4 | 2.2 | 4.5 | 4.5 | 3.2 | 110,259 |
| Loan characteristic or occupancy status | ||||||
| High payment-to-income ratio10 | 9.6 | 14.4 | 18.1 | 16.4 | 15.0 | 519,152 |
| Non-owner occupant11 | .1 | 14.2 | 13.5 | 18.2 | 13.9 | 557,248 |
| Property location12 | ||||||
| Sand states | 10.0 | 16.1 | 22.2 | 22.1 | 18.1 | 626,126 |
| Rust states | 13.4 | 15.8 | 11.3 | 13.6 | 14.1 | 486,601 |
| Other | 76.6 | 68.2 | 66.5 | 64.3 | 67.7 | 2,337,199 |
| Type of lender | ||||||
| Depository | 42.0 | 54.9 | 30.4 | 73.7 | 55.3 | 1,906,245 |
| Affiliate of depository | 20.5 | 30.0 | 21.4 | 10.8 | 21.5 | 742,984 |
| Independent mortgage company | 37.5 | 15.1 | 48.2 | 15.4 | 23.2 | 800,697 |
| Memo | ||||||
| Share of loans13 | 12.2 | 41.0 | 15.9 | 30.9 | 100.0 | . . . |
| Number of loans | 421,731 | 1,415,691 | 546,954 | 1,065,550 | 3,449,926 | 3,449,926 |
| Characteristic | Nonconventional1 | GSE2 | Other3 | Portfolio4 | Overall incidence | Memo: Total loans |
|---|---|---|---|---|---|---|
| 2008 | ||||||
| Minority status of borrower5 | ||||||
| Black or African American | 10.6 | 3.4 | 3.6 | 4.4 | 6.3 | 165,326 |
| Hispanic white | 11.4 | 6.7 | 5.0 | 7.1 | 8.4 | 221,125 |
| Asian | 1.7 | 7.6 | 5.4 | 5.0 | 4.7 | 124,028 |
| Non-Hispanic white | 65.7 | 70.2 | 76.3 | 71.7 | 69.3 | 1,817,967 |
| Other minority or missing6 | 10.6 | 12.1 | 9.6 | 11.7 | 11.3 | 295,369 |
| LMI census tract or borrower7 | ||||||
| Census tract | 15.8 | 11.3 | 10.6 | 12.4 | 13.2 | 345,114 |
| Borrower | 34.8 | 23.9 | 27.9 | 26.1 | 28.7 | 752,263 |
| Other8 | 56.2 | 68.1 | 65.1 | 62.3 | 62.3 | 1,634,396 |
| Missing9 | 1.8 | 1.3 | 1.5 | 5.1 | 2.2 | 58,967 |
| Loan characteristic or occupancy status | ||||||
| High payment-to-income ratio10 | 10.0 | 12.5 | 14.0 | 11.3 | 11.5 | 300,482 |
| Non-owner occupant11 | .1 | 17.3 | 13.7 | 20.8 | 12.1 | 362,514 |
| Property location12 | ||||||
| Sand states | 20.3 | 20.5 | 17.6 | 14.7 | 19.1 | 500,134 |
| Rust states | 13.2 | 13.7 | 12.4 | 14.7 | 13.6 | 357,154 |
| Other | 66.5 | 65.8 | 70.0 | 70.6 | 67.3 | 1,766,527 |
| Type of lender | ||||||
| Depository | 49.0 | 69.4 | 38.4 | 76.6 | 60.8 | 1,594,761 |
| Affiliate of depository | 12.2 | 16.0 | 9.9 | 7.1 | 12.4 | 324,708 |
| Independent mortgage company | 38.8 | 14.6 | 51.6 | 16.3 | 26.8 | 704,346 |
| Memo | ||||||
| Share of loans13 | 37.2 | 35.5 | 7.8 | 19.5 | 100.0 | . . . |
| Number of loans | 976,496 | 930,285 | 204,881 | 512,152 | 2,623,815 | 2,623,815 |
| Characteristic | Nonconventional1 | GSE2 | Other3 | Portfolio4 | Overall incidence | Memo: Total loans |
|---|---|---|---|---|---|---|
| 2009 | ||||||
| Minority status of borrower5 | ||||||
| Black or African American | 8.5 | 1.7 | 2.1 | 3.8 | 5.7 | 139,223 |
| Hispanic white | 11.6 | 4.3 | 4.8 | 5.8 | 8.5 | 207,398 |
| Asian | 2.5 | 9.8 | 7.6 | 6.0 | 5.2 | 127,383 |
| Non-Hispanic white | 66.7 | 72.7 | 75.4 | 73.7 | 69.8 | 1,705,278 |
| Other minority or missing6 | 10.6 | 11.4 | 10.0 | 10.7 | 10.8 | 264,419 |
| LMI census tract or borrower7 | ||||||
| Census tract | 14.8 | 8.9 | 9.9 | 11.8 | 12.6 | 307,507 |
| Borrower | 44.1 | 27.1 | 29.8 | 30.6 | 36.9 | 902,855 |
| Other8 | 48.6 | 66.3 | 63.9 | 59.0 | 55.6 | 1,357,856 |
| Missing9 | 1.9 | 1.8 | 1.6 | 4.9 | 2.3 | 56,110 |
| Loan characteristic or occupancy status | ||||||
| High payment-to-income ratio10 | 7.2 | 7.2 | 8.5 | 6.1 | 7.1 | 173,996 |
| Non-owner occupant11 | .1 | 17.0 | 15.7 | 21.4 | 9.4 | 252,616 |
| Property location12 | ||||||
| Sand states | 22.5 | 21.3 | 24.2 | 13.4 | 21.0 | 512,741 |
| Rust states | 12.5 | 14.8 | 9.7 | 15.1 | 13.3 | 324,397 |
| Other | 65.1 | 63.9 | 66.1 | 71.5 | 65.7 | 1,606,563 |
| Type of lender | ||||||
| Depository | 47.7 | 67.9 | 36.2 | 80.2 | 56.8 | 1,388,372 |
| Affiliate of depository | 11.5 | 12.8 | 7.0 | 7.1 | 11.0 | 267,763 |
| Independent mortgage company | 40.7 | 19.3 | 56.8 | 12.8 | 32.2 | 787,566 |
| Memo | ||||||
| Share of loans13 | 53.9 | 25.9 | 6.2 | 14.1 | 100.0 | . . . |
| Number of loans | 1,316,296 | 632,774 | 150,303 | 344,328 | 2,443,701 | 2,443,701 |
| Characteristic | Nonconventional1 | GSE2 | Other3 | Portfolio4 | Overall incidence | Memo: Total loans |
|---|---|---|---|---|---|---|
| 2010 | ||||||
| Minority status of borrower5 | ||||||
| Black or African American | 9.3 | 1.7 | 2.1 | 3.9 | 6.0 | 133,479 |
| Hispanic white | 12.3 | 4.1 | 4.3 | 5.8 | 8.7 | 192,629 |
| Asian | 2.7 | 10.0 | 7.6 | 5.8 | 5.4 | 119,582 |
| Non-Hispanic white | 65.3 | 72.7 | 77.0 | 74.3 | 69.3 | 1,532,692 |
| Other minority or missing6 | 10.3 | 11.5 | 9.0 | 10.2 | 10.5 | 233,027 |
| LMI census tract or borrower7 | ||||||
| Census tract | 14.7 | 8.5 | 8.7 | 11.0 | 12.1 | 267,862 |
| Borrower | 44.4 | 25.0 | 26.5 | 29.5 | 36.0 | 795,853 |
| Other8 | 49.2 | 69.0 | 68.2 | 61.4 | 57.4 | 1,269,444 |
| Missing9 | 1.2 | 1.2 | .8 | 4.0 | 1.6 | 35,451 |
| Loan characteristic or occupancy status | ||||||
| High payment-to-income ratio10 | 6.3 | 4.5 | 4.6 | 4.1 | 5.4 | 118,567 |
| Non-owner occupant11 | .0 | 19.5 | 16.7 | 20.8 | 10.3 | 254,770 |
| Property location12 | ||||||
| Sand states | 23.0 | 22.5 | 21.2 | 13.1 | 21.3 | 471,150 |
| Rust states | 12.1 | 15.0 | 10.8 | 15.5 | 13.3 | 293,754 |
| Other | 64.9 | 62.5 | 68.0 | 71.3 | 65.4 | 1,446,505 |
| Type of lender | ||||||
| Depository | 44.9 | 64.3 | 33.6 | 76.2 | 54.0 | 1,194,152 |
| Affiliate of depository | 12.1 | 13.3 | 6.3 | 7.8 | 11.4 | 251,801 |
| Independent mortgage company | 43.0 | 22.4 | 60.1 | 16.0 | 34.6 | 765,456 |
| Memo | ||||||
| Share of loans13 | 52.6 | 26.5 | 6.1 | 14.8 | 100.0 | . . . |
| Number of loans | 1,164,102 | 585,550 | 135,216 | 326,540 | 2,211,409 | 2,211,409 |
We also show trends in two metrics of loan quality that can be derived from the HMDA data--the percentage of loans with estimated front-end debt-payment-to-income (PTI) ratios exceeding 30 percent (a warning level in underwriting) and the percentage of loans for non-owner-occupied properties.48 Both measures fell significantly over the sample period, although most of this decline had taken place before 2009. In 2010, patterns for these measures diverge as the incidence of high-PTI lending declines and that of non-owner-occupant lending increases for both home-purchase and refinance lending.
Some of the changes from 2006 to 2010 may reflect factors specific to certain geographic areas rather than factors specific to certain demographic groups. For instance, a decline in lending in California relative to the rest of the nation would tend to generate a relative decline in lending to Hispanic white borrowers because of the prevalence of this group in California. Indeed, the share of loans extended to residents of the sand states--Arizona, California, Florida, and Nevada--declined, particularly for refinance lending from 2006 to 2009, rebounding some in 2010. Nevertheless, even after controlling for differential trends in lending across markets--that is, removing overall market trends from the analysis--the racial and income trends described earlier mostly remain (data not shown in tables).
| Characteristic | Nonconventional1 | GSE2 | Other3 | Portfolio4 | Overall incidence | Memo: Total loans |
|---|---|---|---|---|---|---|
| 2006 | ||||||
| Minority status of borrower5 | ||||||
| Black or African American | 15.4 | 6.4 | 11.2 | 9.4 | 9.5 | 421,906 |
| Hispanic white | 7.9 | 8.1 | 12.7 | 10.1 | 10.5 | 465,534 |
| Asian | .6 | 2.8 | 3.0 | 3.0 | 2.9 | 129,561 |
| Non-Hispanic white | 65.0 | 68.8 | 54.4 | 63.5 | 61.7 | 2,745,229 |
| Other minority or missing6 | 11.2 | 13.9 | 18.7 | 13.9 | 15.5 | 690,582 |
| LMI census tract or borrower7 | ||||||
| Census tract | 19.9 | 14.3 | 20.3 | 17.9 | 17.9 | 796,633 |
| Borrower | 29.1 | 26.0 | 23.1 | 25.8 | 25.0 | 1,114,002 |
| Other8 | 41.5 | 61.6 | 59.9 | 59.7 | 59.8 | 2,660,680 |
| Missing9 | 22.4 | 4.7 | 5.3 | 4.6 | 5.4 | 238,240 |
| Loan characteristic or occupancy status | ||||||
| High payment-to-income ratio10 | 8.9 | 16.7 | 34.9 | 21.6 | 24.7 | 1,099,408 |
| Non-owner occupant11 | .5 | 10.1 | 10.5 | 10.9 | 10.3 | 512,617 |
| Property location12 | ||||||
| Sand states | 10.6 | 28.3 | 38.5 | 29.9 | 32.0 | 1,424,317 |
| Rust states | 22.1 | 16.6 | 11.8 | 14.6 | 14.3 | 638,511 |
| Other | 67.4 | 55.0 | 49.6 | 55.5 | 53.7 | 2,389,984 |
| Type of lender | ||||||
| Depository | 30.1 | 44.4 | 20.4 | 60.1 | 41.6 | 1,852,818 |
| Affiliate of depository | 21.3 | 42.4 | 24.6 | 17.6 | 26.2 | 1,165,423 |
| Independent mortgage company | 48.6 | 13.2 | 55.0 | 22.3 | 32.2 | 1,434,571 |
| Memo | ||||||
| Share of loans13 | 2.7 | 24.3 | 34.9 | 38.1 | 100.0 | . . . |
| Number of loans | 121,388 | 1,081,771 | 1,552,086 | 1,697,567 | 4,452,812 | 4,452,812 |
Note: See notes to table 14.A.
| Characteristic | Nonconventional1 | GSE2 | Other3 | Portfolio4 | Overall incidence | Memo: Total loans |
|---|---|---|---|---|---|---|
| 2007 | ||||||
| Minority status of borrower5 | ||||||
| Black or African American | 15.8 | 6.5 | 8.3 | 8.9 | 8.3 | 302,575 |
| Hispanic white | 7.2 | 8.3 | 9.7 | 9.7 | 9.1 | 331,243 |
| Asian | .6 | 2.9 | 3.2 | 3.4 | 3.0 | 110,107 |
| Non-Hispanic white | 63.8 | 67.9 | 60.8 | 63.5 | 64.7 | 2,363,168 |
| Other minority or missing6 | 12.7 | 14.4 | 18.0 | 14.4 | 14.9 | 545,126 |
| LMI census tract or borrower7 | ||||||
| Census tract | 19.4 | 14.4 | 16.3 | 17.0 | 16.0 | 585,951 |
| Borrower | 27.0 | 24.3 | 20.8 | 23.8 | 23.7 | 864,197 |
| Other8 | 48.0 | 64.0 | 64.9 | 61.9 | 62.4 | 2,278,791 |
| Missing9 | 16.6 | 3.7 | 4.7 | 4.5 | 4.9 | 179,165 |
| Loan characteristic or occupancy status | ||||||
| High payment-to-income ratio10 | 9.7 | 16.9 | 27.2 | 20.7 | 19.8 | 724,001 |
| Non-owner occupant11 | .3 | 10.9 | 10.8 | 11.8 | 10.8 | 439,923 |
| Property location12 | ||||||
| Sand states | 10.0 | 25.0 | 32.6 | 28.5 | 26.9 | 982,417 |
| Rust states | 22.1 | 16.5 | 11.4 | 14.6 | 15.2 | 555,083 |
| Other | 68.0 | 58.5 | 55.9 | 56.9 | 57.9 | 2,114,719 |
| Type of lender | ||||||
| Depository | 38.6 | 52.1 | 23.3 | 70.2 | 54.0 | 1,971,896 |
| Affiliate of depository | 15.9 | 32.9 | 28.4 | 18.0 | 25.2 | 918,701 |
| Independent mortgage company | 45.4 | 15.0 | 48.3 | 11.7 | 20.9 | 761,622 |
| Memo | ||||||
| Share of loans13 | 5.4 | 37.1 | 16.7 | 40.9 | 100.0 | . . . |
| Number of loans | 196,178 | 1,354,690 | 608,485 | 1,492,866 | 3,652,219 | 3,652,219 |
| Characteristic | Nonconventional1 | GSE2 | Other3 | Portfolio4 | Overall incidence | Memo: Total loans |
|---|---|---|---|---|---|---|
| 2008 | ||||||
| Minority status of borrower5 | ||||||
| Black or African American | 12.9 | 3.8 | 3.2 | 5.7 | 5.9 | 173,990 |
| Hispanic white | 6.6 | 5.7 | 4.1 | 5.6 | 5.7 | 166,460 |
| Asian | .8 | 4.0 | 3.5 | 2.9 | 3.1 | 90,200 |
| Non-Hispanic white | 66.2 | 73.0 | 78.0 | 74.6 | 72.6 | 2,125,675 |
| Other minority or missing6 | 13.6 | 13.4 | 11.2 | 11.2 | 12.7 | 371,098 |
| LMI census tract or borrower7 | ||||||
| Census tract | 16.4 | 10.4 | 9.1 | 12.5 | 11.9 | 349,779 |
| Borrower | 24.6 | 22.5 | 22.0 | 26.2 | 23.9 | 698,388 |
| Other8 | 48.2 | 68.2 | 71.1 | 64.3 | 63.7 | 1,865,918 |
| Missing9 | 20.5 | 3.5 | 1.7 | 2.9 | 6.3 | 183,152 |
| Loan characteristic or occupancy status | ||||||
| High payment-to-income ratio10 | 10.8 | 12.5 | 14.1 | 11.9 | 12.2 | 355,909 |
| Non-owner occupant11 | .3 | 9.7 | 8.8 | 12.4 | 8.9 | 285,676 |
| Property location12 | ||||||
| Sand states | 9.3 | 20.2 | 18.5 | 15.4 | 16.8 | 491,249 |
| Rust states | 18.9 | 17.4 | 16.4 | 17.4 | 17.6 | 515,072 |
| Other | 71.8 | 62.4 | 65.1 | 67.2 | 65.6 | 1,921,102 |
| Type of lender | ||||||
| Depository | 42.4 | 70.9 | 39.5 | 79.4 | 65.7 | 1,923,557 |
| Affiliate of depository | 12.3 | 16.9 | 12.7 | 12.1 | 14.4 | 422,510 |
| Independent mortgage company | 45.2 | 12.2 | 47.9 | 8.5 | 19.9 | 581,356 |
| Memo | ||||||
| Share of loans13 | 18.0 | 46.6 | 7.6 | 27.7 | 100.0 | . . . |
| Number of loans | 526,300 | 1,365,322 | 223,593 | 812,208 | 2,927,423 | 2,927,423 |
| Characteristic | Nonconventional1 | GSE2 | Other3 | Portfolio4 | Overall incidence | Memo: Total loans |
|---|---|---|---|---|---|---|
| 2009 | ||||||
| Minority status of borrower5 | ||||||
| Black or African American | 9.9 | 1.8 | 1.5 | 2.9 | 3.5 | 184,715 |
| Hispanic white | 6.7 | 2.8 | 2.7 | 3.7 | 3.7 | 194,931 |
| Asian | 1.2 | 5.1 | 4.5 | 3.4 | 4.1 | 214,526 |
| Non-Hispanic white | 69.0 | 77.9 | 81.4 | 77.3 | 76.4 | 4,036,066 |
| Other minority or missing6 | 13.2 | 12.4 | 10.0 | 12.6 | 12.3 | 651,511 |
| LMI census tract or borrower7 | ||||||
| Census tract | 12.9 | 6.1 | 5.8 | 8.6 | 7.8 | 410,913 |
| Borrower | 17.8 | 19.6 | 19.2 | 23.7 | 19.9 | 1,049,444 |
| Other8 | 30.6 | 72.6 | 75.5 | 68.7 | 64.3 | 3,396,044 |
| Missing9 | 48.8 | 4.2 | 1.8 | 2.9 | 12.2 | 642,540 |
| Loan characteristic or occupancy status | ||||||
| High payment-to-income ratio10 | 6.5 | 5.9 | 7.0 | 5.2 | 6.0 | 318,238 |
| Non-owner occupant11 | .5 | 5.6 | 5.3 | 10.1 | 5.4 | 304,291 |
| Property location12 | ||||||
| Sand states | 12.0 | 17.4 | 17.8 | 13.2 | 15.7 | 831,014 |
| Rust states | 16.3 | 19.2 | 15.1 | 18.1 | 18.1 | 956,928 |
| Other | 71.7 | 63.4 | 67.1 | 68.7 | 66.1 | 3,493,807 |
| Type of lender | ||||||
| Depository | 45.0 | 74.5 | 48.2 | 84.6 | 68.3 | 3,606,134 |
| Affiliate of depository | 9.4 | 11.6 | 5.7 | 6.3 | 9.8 | 516,553 |
| Independent mortgage company | 45.6 | 13.9 | 46.1 | 9.1 | 21.9 | 1,159,062 |
| Memo | ||||||
| Share of loans13 | 18.9 | 55.7 | 8.9 | 16.5 | 100.0 | . . . |
| Number of loans | 996,883 | 2,943,187 | 469,542 | 872,137 | 5,281,749 | 5,281,749 |
| Characteristic | Nonconventional1 | GSE2 | Other3 | Portfolio4 | Overall incidence | Memo: Total loans |
|---|---|---|---|---|---|---|
| 2010 | ||||||
| Minority status of borrower5 | ||||||
| Black or African American | 8.3 | 1.8 | 1.3 | 2.5 | 2.9 | 129,539 |
| Hispanic white | 6.5 | 3.0 | 2.5 | 3.5 | 3.5 | 159,529 |
| Asian | 1.7 | 6.3 | 6.3 | 4.1 | 5.1 | 231,709 |
| Non-Hispanic white | 72.0 | 76.2 | 80.1 | 77.1 | 76.1 | 3,427,377 |
| Other minority or missing6 | 11.6 | 12.7 | 9.8 | 12.8 | 12.3 | 555,817 |
| LMI census tract or borrower7 | ||||||
| Census tract | 11.5 | 6.1 | 5.5 | 7.7 | 7.2 | 323,864 |
| Borrower | 18.5 | 19.1 | 16.9 | 20.5 | 19.1 | 861,326 |
| Other8 | 38.9 | 76.0 | 78.6 | 64.1 | 68.3 | 3,074,326 |
| Missing9 | 39.3 | 1.1 | .9 | 11.5 | 8.9 | 400,435 |
| Loan characteristic or occupancy status | ||||||
| High payment-to-income ratio10 | 3.9 | 3.9 | 3.5 | 4.2 | 3.9 | 175,837 |
| Non-owner occupant11 | 1.1 | 7.3 | 6.5 | 9.3 | 6.8 | 329,180 |
| Property location12 | ||||||
| Sand states | 14.7 | 19.3 | 19.3 | 16.3 | 18.0 | 809,714 |
| Rust states | 14.1 | 19.5 | 14.0 | 20.2 | 18.4 | 830,582 |
| Other | 71.2 | 61.2 | 66.6 | 63.5 | 63.6 | 2,863,675 |
| Type of lender | ||||||
| Depository | 45.9 | 71.5 | 39.0 | 86.1 | 68.3 | 3,077,907 |
| Affiliate of depository | 8.3 | 12.0 | 5.0 | 5.6 | 9.5 | 428,287 |
| Independent mortgage company | 45.8 | 16.5 | 56.1 | 8.3 | 22.2 | 997,777 |
| Memo | ||||||
| Share of loans13 | 14.5 | 55.7 | 8.1 | 21.7 | 100.0 | . . . |
| Number of loans | 652,922 | 2,510,493 | 365,277 | 975,279 | 4,503,971 | 4,503,971 |
Borrowers of different demographic groups showed large differences in their propensity to use different types of loans, with significant changes from year to year. All groups showed substantial increases in their use of nonconventional loans from 2006 through 2009 (data derived from tables 14.A and 14.B).49 Black and Hispanic-white borrowers, however, relied particularly heavily on these government programs, a trend that continued in 2010. In 2010, more than 80 percent of home-purchase loans and more than 40 percent of refinance loans to black borrowers were nonconventional. For Hispanic white borrowers in 2010, nearly three-fourths of their home-purchase loans and 25 percent of their refinance loans were nonconventional. In 2006, over 40 percent of home-purchase and refinance loans to both black and Hispanic-white borrowers were sold into the private securities market or sold to a nongovernment purchaser. By 2007, these shares had dropped significantly, and the GSE and portfolio shares of loans among these groups had grown. In 2008 and 2009, the share of home-purchase loans to black and Hispanic-white borrowers that were sold to the GSEs fell, while the share of refinance loans to both groups that were sold to the GSEs rose from 2007 through 2009 and remained flat in 2010.
Patterns of loan-type incidence for LMI borrowers and borrowers living in LMI census tracts are similar to those for black and Hispanic-white borrowers but are more muted. Loans to these borrowers were less likely to be sold on the nongovernment secondary market in 2006, and the shift toward nonconventional loans in 2008 and 2009 was not as large. The share of borrowers with income missing from their loan applications fell from 2006 through 2009 (more than one-half of these loans were sold into the private secondary market in 2006). The incidence of missing income for refinance loans actually rose in 2008 and 2009, likely the result of "streamlined" refinance programs.
In 2006 and 2007, nonconventional loans as well as GSE loans were significantly less likely than portfolio or private secondary-market loans to be classified as low quality by our measures--high PTI or non-owner occupant. However, by 2008, this lower incidence for high-PTI loans had largely disappeared.
Loans originated in the sand states in 2006 and 2007 were much more likely to be sold into the private secondary market than loans originated in other states. By 2008, differences in the disposition patterns between the sand states and the rest of the country had largely disappeared in the home-purchase market, perhaps in part because of changes in the FHA and GSE loan limits. However, in the refinance market, loans originated in the sand states in 2008 and 2009 were more likely to be purchased by the GSEs and less likely to be part of the nonconventional loan programs than loans in other states.
Loan-Size Limits
Before 2008, the National Housing Act, as amended in 1998 Mortgagee Letter 1998-28, required that FHA mortgage limits for one- to four-family homes be set at 95 percent of the median house price prevailing in an area (either county or MSA), subject to an overall national minimum and maximum.50 Loans purchased by the GSEs were also subject to a limit, based on national median house prices, which was fixed at $417,000 for single-family homes in the continental United States from 2006 to 2008. The Congress authorized an increase in these limits as part of the Economic Stimulus Act, passed in February 2008; it did so again as part of the Housing and Economic Recovery Act (HERA), enacted in July 2008; and it did so once more as part of the American Recovery and Reinvestment Act, passed in February 2009.51
The new FHA and GSE limits have remained in place, with only modest variation, since early 2008. However, barring congressional action, national single-family home loan limits on both FHA and GSE lending are scheduled to fall from $729,750 to $625,500 on October 1, 2011. Both FHA and GSE loan limits in areas not subject to the national cap are scheduled to fall from the current 125 percent to 115 percent of the area's median house price, with GSE single-family loans still subject to a base limit of $417,000.
Analysis presented in a previous article concluded that the increased loan limits accounted for less than 10 percent of the growth in nonconventional lending in 2008 and an even smaller portion of the growth in GSE loan purchases.52 Here we examine what the effects of the limit changes scheduled for October 1, 2011, are likely to be, based on lending patterns observed in 2010.
Analysis released by the Department of Housing and Urban Development (HUD) suggests that 669 counties and county equivalents, predominantly located in high-cost areas on both coasts, will face changed FHA loan limits for one- to four-family homes as of October 1, 2011.53 Similar analysis by the FHFA suggests that 250 counties and county equivalents will face changes in GSE limits.54 These numbers are not fully set, and some disagreement remains as to what the final changes will be.55 Nevertheless, we use the projected limit changes forecast by HUD and FHFA to identify lending in 2010 in potentially affected areas.56
All of the counties facing changes in GSE limits are in high-cost areas where 2010 GSE and FHA limits are the same. For about one-half of these counties, the FHA and GSE limits are projected to be reduced by the same amount, and future borrowers seeking loans in size ranges affected by the limits would not be able to use either the FHA or GSE programs. In the remaining counties facing GSE limit changes, the FHA limits are projected to fall below the $417,000 GSE base limit for single-family homes. In these counties, borrowers with loan requests between $417,000 and the current limits will no longer have access to either the FHA or GSE programs. Borrowers who will no longer be eligible for FHA loans with requests below $417,000 in these counties and borrowers in counties facing only declines in their FHA limits will still meet GSE loan-size standards. Consequently, in our analysis, we divide 2010 loans into eight groups based on proposed GSE and FHA limit changes: loans in counties with projected GSE limit changes with loan sizes (1) below both the 2010 GSE/FHA and proposed 2011 FHA limits, (2) above the 2011 FHA limit but below the proposed 2011 GSE limit, (3) below the 2010 GSE/FHA limit but above the proposed 2011 GSE limit, or (4) above both the 2010 and proposed 2011 GSE/FHA limits (jumbo loans); loans in counties with projected FHA but not GSE limit changes with loan sizes (5) below both the 2010 and proposed FHA 2011 limits, (6) below the 2010 FHA limit but above the proposed 2011 FHA limit, or (7) above both the 2010 and proposed 2011 FHA limits; and loans (8) in counties with no changes in either the GSE or FHA loan limits.
Totals for first-lien owner-occupant one- to four-family home-purchase and refinance 2010 lending based on these groupings are presented (tables 15.Aand 15.B). Lending totals are shown for the market as a whole and for various demographic and other loan characteristics. For comparison purposes, we also give overall figures for jumbo loans--those with loan sizes above the GSE (and FHA) loan limits for their areas in 2010.
| Characteristic | Counties with GSE/FHA limit change | Only FHA limit change | Unaffected market1 | Memo | ||||||
|---|---|---|---|---|---|---|---|---|---|---|
| Less than all limits 1 | Only FHA limit status changed1 | FHA and GSE limit status changed1 | Greater than all limits1 | Less than both FHA limits1 | FHA limit status changed1 | Greater than all FHA limits1 | 2010 overall incidence | 2010 jumbo loans | ||
| Minority status of borrower 2 | ||||||||||
| Black or African American | 6.3 | 2.4 | 1.6 | 1.4 | 6.6 | 2.9 | 2.4 | 6.1 | 6.0 | 3.4 |
| Hispanic white | 13.2 | 7.3 | 3.1 | 3.1 | 8.4 | 3.5 | 2.2 | 6.6 | 8.7 | 4.2 |
| Asian | 11.4 | 8.2 | 16.3 | 9.3 | 3.2 | 5.1 | 4.8 | 2.1 | 5.4 | 5.5 |
| Non-Hispanic white | 55.5 | 68.2 | 59.7 | 64.6 | 72.3 | 76.2 | 77.5 | 77.1 | 69.3 | 71.4 |
| Other minority or missing 3 | 13.6 | 13.9 | 19.3 | 21.6 | 9.5 | 12.3 | 13.0 | 8.1 | 10.5 | 15.6 |
| LMI census tract or borrower 4 | ||||||||||
| Census tract | 18.2 | 2.9 | 3.9 | 2.8 | 13.0 | 3.2 | 2.9 | 8.5 | 12.1 | 1.9 |
| Borrower | 34.3 | .2 | .1 | .1 | 46.2 | 1.2 | .3 | 35.8 | 36.0 | 1.9 |
| Other 5 | 56.6 | 96.1 | 95.0 | 95.3 | 48.6 | 94.6 | 95.7 | 58.0 | 57.4 | 68.7 |
| Missing 6 | .9 | .8 | 1.1 | 1.7 | .9 | 1.1 | 1.2 | 2.8 | 1.6 | 27.5 |
| Loan characteristic, type of loan, or occupancy status | ||||||||||
| High payment-to-income ratio 7 | 10.3 | 6.1 | 9.9 | 7.9 | 3.9 | 4.9 | 3.4 | 2.6 | 5.4 | 5.9 |
| Nonconventional 8 | 50.2 | 31.9 | 21.0 | 14.0 | 60.2 | 43.7 | 15.1 | 53.9 | 52.6 | 18.7 |
| GSE 9 | 31.8 | 42.9 | 53.4 | 1.8 | 23.1 | 35.0 | 41.8 | 23.1 | 26.5 | 5.8 |
| Other 10 | 7.0 | 13.0 | 8.9 | 3.1 | 5.6 | 8.5 | 9.9 | 5.4 | 6.1 | 3.4 |
| Portfolio 11 | 11.0 | 12.2 | 16.7 | 81.2 | 11.0 | 12.9 | 33.1 | 17.7 | 14.8 | 72.2 |
| Non-owner occupant 12 | 10.5 | 14.2 | 5.2 | 13.3 | 10.9 | 7.9 | 10.2 | 9.9 | 10.3 | 12.9 |
| Property location 13 | ||||||||||
| Sand states | 40.9 | 39.4 | 53.7 | 40.0 | 23.7 | 28.0 | 15.7 | 2.4 | 21.3 | 20.0 |
| Rust states | .0 | .0 | .0 | .0 | 23.5 | 17.7 | 22.9 | 15.5 | 13.3 | 8.4 |
| Other | 59.0 | 60.6 | 46.3 | 60.0 | 52.8 | 54.3 | 61.4 | 82.1 | 65.4 | 71.6 |
| Type of lender | ||||||||||
| Depository | 48.6 | 50.9 | 58.5 | 76.4 | 49.3 | 51.0 | 61.6 | 60.8 | 54.0 | 66.4 |
| Affiliate of depository | 9.6 | 8.3 | 11.2 | 13.0 | 11.4 | 11.5 | 14.4 | 12.5 | 11.4 | 9.4 |
| Independent mortgage company | 41.8 | 40.8 | 30.3 | 10.6 | 39.3 | 37.5 | 23.9 | 26.7 | 34.6 | 24.2 |
| Memo 14 | ||||||||||
| 2010 share of loans | 27.8 | .7 | 1.3 | 1.0 | 29.1 | 1.4 | 2.5 | 36.2 | 100.0 | 2.6 |
| 2009 share of loans | 27.4 | .7 | .8 | .8 | 29.8 | 1.3 | 2.1 | 37.1 | 100.0 | 3.1 |
| 2008 share of loans | 25.3 | 1.0 | .9 | 1.2 | 28.5 | 1.7 | 3.0 | 38.5 | 100.0 | 3.7 |
| 2007 share of loans | 23.3 | 1.1 | 1.0 | 2.3 | 28.6 | 1.9 | 3.5 | 38.3 | 100.0 | 8.9 |
| 2006 share of loans | 24.7 | 1.2 | 1.2 | 2.3 | 36.4 | 1.5 | 2.4 | 30.2 | 100.0 | 10.1 |
Note: See general note to table 10.
1. "Less than all limits" indicates loans made with loan size less than the old and newly proposed loan-size limit for both government-sponsored enterprise (GSE) and Federal Housing Administration (FHA) loans. "Only FHA limit status changed" indicates loans made with loan size between the old and newly proposed FHA loan limits but unaffected by the GSE limit changes. "FHA and GSE limit status changed" indicates loans made with loan size between both the old and newly proposed GSE and FHA loan limits. "Greater than all limits" indicates loans made with a loan size greater than both the old and newly proposed loan-size limits for GSE and FHA loans. "Less than both FHA limits" indicates loans made with loan size less than the old and newly proposed loan-size limit for FHA loans. "FHA limit status changed" indicates loans made with loan size between the old and newly proposed FHA loan limits. "Greater than all FHA limits" indicates loans made with a loan size greater than both the old and newly proposed loan-size limits for FHA loans. "Unaffected market" indicates loans made in counties that had no change in the GSE or FHA limits. Return to table
2. See table 14.A, note 5. Return to table
3. See table 14.A, note 6. Return to table
4. See table 14.A, note 7. Return to table
5. See table 14.A, note 8. Return to table
6. See table 14.A, note 9. Return to table
7. See table 14.A, note 10. Return to table
8. See table 4, note 1. Return to table
9. See table 8, note 2. Return to table
10. See table 14.A, note 3. Return to table
11. See table 14.A, note 4. Return to table
12. See table 14.A, note 11. Return to table
13. See table 14.A, note 12. Return to table
14. See table 14.A, note 13. Return to table
Return to text| Characteristic | Counties with GSE/FHA limit change | Only FHA limit change | Unaffected market1 | Memo | ||||||
|---|---|---|---|---|---|---|---|---|---|---|
| Less than all limits1 | Only FHA limit status changed1 | FHA and GSE limit status changed1 | Greater than all limits1 | Less than both FHA limits1 | FHA limit status changed1 | Greater than all FHA limits1 | 2010 overall incidence | 2010 jumbo loans | ||
| Minority status of borrower2 | ||||||||||
| Black or African American | 3.0 | 1.3 | .8 | .9 | 2.8 | 1.5 | 1.4 | 3.3 | 2.9 | 1.3 |
| Hispanic white | 5.1 | 4.0 | 2.0 | 1.8 | 3.0 | 1.9 | 1.4 | 2.8 | 3.5 | 1.9 |
| Asian | 10.3 | 6.0 | 15.4 | 7.1 | 2.9 | 5.1 | 4.0 | 1.6 | 5.1 | 4.9 |
| Non-Hispanic white | 65.1 | 72.9 | 62.6 | 69.3 | 80.4 | 79.2 | 81.6 | 83.4 | 76.1 | 77.1 |
| Other minority or missing3 | 16.5 | 15.7 | 19.2 | 20.9 | 10.9 | 12.2 | 11.7 | 8.9 | 12.3 | 14.9 |
| LMI census tract or borrower4 | ||||||||||
| Census tract | 9.2 | 2.4 | 2.3 | 1.9 | 7.6 | 3.0 | 2.3 | 5.9 | 7.2 | 1.7 |
| Borrower | 18.7 | 1.3 | .2 | .2 | 23.3 | 2.2 | .9 | 20.1 | 19.1 | 1.5 |
| Other5 | 68.1 | 89.2 | 93.5 | 94.5 | 63.3 | 86.3 | 92.5 | 67.4 | 68.3 | 74.9 |
| Missing6 | 8.4 | 7.4 | 4.2 | 3.5 | 9.9 | 8.9 | 4.4 | 9.2 | 8.9 | 22.0 |
| Loan characteristic, type of loan, or occupancy status | ||||||||||
| High payment-to-income ratio7 | 6.2 | 6.7 | 8.2 | 8.6 | 2.7 | 5.5 | 4.9 | 2.2 | 3.9 | 6.9 |
| Nonconventional8 | 11.3 | 11.1 | 10.0 | 6.4 | 16.2 | 15.2 | 5.2 | 17.4 | 14.5 | 8.8 |
| GSE9 | 59.9 | 61.0 | 59.6 | 1.9 | 56.2 | 58.8 | 54.0 | 52.4 | 55.7 | 8.7 |
| Other10 | 9.2 | 11.6 | 12.3 | 2.4 | 6.9 | 9.0 | 10.1 | 7.7 | 8.1 | 4.0 |
| Portfolio11 | 19.5 | 16.2 | 18.2 | 89.2 | 20.7 | 17.0 | 30.7 | 22.4 | 21.7 | 78.6 |
| Non-owner occupant12 | 7.2 | 9.3 | 3.8 | 9.7 | 6.2 | 4.9 | 7.0 | 7.1 | 6.8 | 9.6 |
| Property location13 | ||||||||||
| Sand states | 37.8 | 31.6 | 63.0 | 42.6 | 11.5 | 19.3 | 11.6 | 1.6 | 18.0 | 20.9 |
| Rust states | .0 | .0 | .0 | .0 | 33.9 | 30.0 | 29.5 | 23.2 | 18.4 | 13.4 |
| Other | 62.2 | 68.3 | 37.0 | 57.4 | 54.6 | 50.8 | 58.9 | 75.1 | 63.6 | 65.8 |
| Type of lender | ||||||||||
| Depository | 64.9 | 62.7 | 56.8 | 78.0 | 68.9 | 61.6 | 65.7 | 72.1 | 68.3 | 76.4 |
| Affiliate of depository | 8.3 | 8.2 | 10.8 | 14.6 | 9.8 | 10.1 | 12.8 | 9.9 | 9.5 | 11.5 |
| Independent mortgage company | 26.7 | 29.1 | 32.5 | 7.4 | 21.3 | 28.2 | 21.5 | 18.0 | 22.2 | 12.1 |
| Memo14 | ||||||||||
| 2010 share of loans | 31.9 | .7 | 1.3 | .9 | 28.3 | 1.7 | 2.9 | 32.3 | 100.0 | 2.1 |
| 2009 share of loans | 30.7 | .7 | .6 | .5 | 28.3 | 1.8 | 3.1 | 34.2 | 100.0 | 2.0 |
| 2008 share of loans | 27.8 | .8 | .6 | 1.0 | 28.7 | 1.8 | 3.2 | 36.1 | 100.0 | 2.8 |
| 2007 share of loans | 31.7 | 1.2 | 1.2 | 2.3 | 28.5 | 1.7 | 3.2 | 30.1 | 100.0 | 9.3 |
| 2006 share of loans | 28.5 | 1.3 | 2.0 | 3.3 | 28.8 | 1.7 | 2.9 | 31.5 | 100.0 | 10.5 |
Note: See notes to table 15.A.
Return to textOverall, only 1.3 percent of the 2010 home-purchase loans (and 1.3 percent of refinance loans) fell into a size range that is currently eligible for both the FHA and GSE programs but will not be eligible for either program under the proposed limits (column 3). An additional 2.1 percent of 2010 home-purchase loans (and 2.4 percent of refinance loans) would potentially have been affected by the FHA changes in markets where GSE limits are unchanged (column 6) or FHA limits fall more than GSE limits (column 2).
However, within these ranges, the proposed changes likely would have had a significant effect--53.4 percent of the home-purchase loans and 59.6 percent of the refinance loans originated in 2010 in size ranges that would have exceeded the proposed 2011 GSE size limits were sold to the GSEs. For FHA loans, the effect is somewhat smaller but still significant--43.7 percent of the home-purchase loans with sizes eligible under 2010 limits but ineligible under 2011 limits in counties with no GSE changes were FHA or VA loans. For refinance loans, only 15.2 percent of loans meeting these criteria were FHA or VA loans.
Borrowers affected by FHA limit changes but with loan sizes under the GSE limits would appear to be likely to have the GSEs as a viable option if the changes are implemented (although lending standards for FHA loans differ from those for loans eligible for purchase by the GSEs in ways other than just loan size). In 2010, 35.0 percent of home-purchase borrowers and 58.8 percent of refinance borrowers falling into a size range affected by the proposed FHA changes in areas where GSE limits are unchanged had their loans sold to the GSEs.
It is more difficult to know what options will be available for borrowers no longer eligible under either the GSE or FHA programs. On the one hand, the overall share of national lending for loans that would be affected by changes in the GSE limit was considerably higher in 2010 than in 2008 and 2009 (bottom of tables 15.A and 15.B). However, it is about the same as the share in 2006 and 2007, before the limits were raised. These figures suggest that factors other than GSE (and FHA) loan limits affected the relative amount of lending taking place within these bands.
On the other hand, if the loans affected by the GSE (and FHA) changes had been forced into the jumbo market in 2010, this move would have resulted in a 50 percent increase in the size of the national home-purchase jumbo market and a 63 percent increase in that of the national refinance jumbo market.57 Holding such loans on the portfolios of originating institutions would have meant an increase of over 20 percent in portfolioed loans for institutions serving the 250 counties where limits were changed. These numbers are substantial and suggest that at least some of these loans would not have been originated or would have been originated only at higher prices.
Examination of the demographic data shows that borrowers with loan sizes eligible under 2010 limits but ineligible under 2011 limits for both GSE and FHA limit changes were disproportionately Asian, lived outside LMI census tracts, had non-LMI incomes, and used independent mortgage banks, relative to the average borrower. More than one-half of such borrowers lived in the sand states, and none lived in the "rust states" of Illinois, Indiana, Michigan, Ohio, and Wisconsin (because none of the affected counties lie in the rust states). Such borrowers were also more likely than average to have a PTI ratio exceeding 30 percent.
Borrowers facing only FHA limit changes similarly were less likely than average to live in LMI census tracts or have LMI incomes, but unlike those affected by the GSE limits, such borrowers show geographic and racial distributions similar to the national averages.
Credit Circumstances in Neighborhood Stabilization Program Neighborhoods
Concerns about neighborhoods experiencing high levels of housing market distress have been a particular focus of public policy in recent years. This focus has been motivated by the belief that elevated levels of foreclosure and property abandonment can adversely affect not only those directly involved in the foreclosures, but also others in the surrounding neighborhood.58 Such negative externalities or spillover effects may arise as foreclosed and often vacant properties attract vandalism and crime, and these units may be poorly maintained, casting a pall over the neighboring properties and adversely affecting their market values.59 In the extreme, these spillover effects can help create a self-reinforcing downward spiral that can devastate the quality of life in an area.
To address the foreclosure problem, as part of the 2008 HERA, the Congress established and funded the Neighborhood Stabilization Program.60 The NSP provides emergency assistance to state and local governments seeking to support neighborhoods experiencing high levels of property abandonment and foreclosure. To help ensure that funds are appropriately targeted, the monies are directed to households or individuals with incomes less than 120 percent of the broader area median income.
To bolster congressional efforts, in December 2010, the federal bank and savings institution regulatory agencies revised the regulations that implement the Community Reinvestment Act (CRA) to support the stabilization of communities hard hit by elevated foreclosures.61 In particular, the revised regulations encourage covered institutions to support the NSP. Under the CRA rules, lenders are encouraged to make loans and investments and provide services to support NSP activities to individuals and neighborhoods beyond the traditional focus of the CRA (specifically, individuals and neighborhoods classified as lower income). Allowing banking institutions to receive CRA consideration for activities in NSP-targeted neighborhoods provides additional incentives for these institutions to leverage government funds targeted to these areas and populations.
Under the NSP program, funds may be used in different ways, including for the purchase or rehabilitation of abandoned or foreclosed properties, the demolition of blighted structures, and the redevelopment of demolished or vacant properties. NSP funds can also be used to help homebuyers purchase properties. The NSP is a nationwide program, but participation requirements may differ across states and cities.
In deciding which neighborhoods to target, HUD relies on a statistical model that estimates which neighborhoods are likely to be experiencing high rates of foreclosure and mortgage delinquencies. Based on the outputs of this model, each census tract is given an NSP score ranging from 1 to 20. Scores are scaled so that each score point is given to 5 percent of the census tracts. Census tracts with NSP scores in the top quintile ("high-NSP tracts"), those with scores of 17 to 20, are eligible for aid. "Lower-NSP tracts," those with scores below 17, are not generally eligible for aid unless they are in states that have very few tracts with NSP scores above 17, in which case the state is permitted to use a lower-threshold NSP score for identifying areas eligible for NSP funds.
An evaluation of the effectiveness of the NSP program is beyond the scope of this article. Some of the interventions, like the changes to the CRA, are too new to evaluate, and others require more data than HMDA provides. However, the HMDA data can be used to assess mortgage activity across all areas scored for the NSP program. Because the NSP program has been in existence for a few years, it is possible that recent loan flows may have been affected by the program to some degree. Nevertheless, this analysis can highlight some of the potential challenges involved in aiding these communities.
Substantial differences between high-NSP tracts and lower-NSP tracts existed long before the recent difficulties in mortgage and housing markets emerged. In the 2000 census, high-NSP tracts were characterized by higher minority concentrations and lower relative-income levels than lower-NSP tracts (table 16). Similarly, lending activity in these tracts before the subprime crisis was notably different. Using 2005 as a reference point, lending in the high-NSP tracts was characterized by elevated rates of loan denial; larger incidences of higher-priced loans, piggyback loans, and non-owner-occupant lending; and smaller shares of lending by lenders subject to the CRA. New home buyers in areas with high-NSP tracts also tended to have lower credit scores than buyers in other areas.
| Characteristic | NSP score 1 | |||||
|---|---|---|---|---|---|---|
| 1-4 | 5-8 | 9-12 | 13-16 | 17-20 | All | |
| 2005 | ||||||
| Borrower | ||||||
| Income ratio (percent of area median) 2 | ||||||
| Lower | 14.8 | 21.7 | 25.4 | 27.1 | 19.5 | 21.4 |
| Middle | 20.9 | 24.8 | 25.4 | 23.9 | 21.8 | 23.2 |
| High | 60.2 | 49.3 | 44.8 | 44.2 | 52.3 | 50.4 |
| Minority 3 | 18.8 | 17.1 | 21.3 | 29.8 | 45.5 | 27.1 |
| Memo: Mean credit score 4 | 728.0 | 708.0 | 697.0 | 688.0 | 675.0 | 701.0 |
| Loan or application characteristic or occupancy status | ||||||
| Higher priced 5 | 8.9 | 15.6 | 20.9 | 26.9 | 36.0 | 22.0 |
| Non-owner occupant 6 | 13.7 | 14.2 | 15.9 | 18.3 | 24.5 | 17.6 |
| Nonconventional 7 | 5.7 | 8.6 | 8.9 | 8.0 | 4.6 | 7.0 |
| Denial rate | 10.4 | 12.9 | 15.2 | 17.8 | 21.4 | 15.9 |
| Piggyback 8 | 12.4 | 15.3 | 16.9 | 19.5 | 25.1 | 18.1 |
| Census tract of property 9 | ||||||
| Minorities as a percent of population 10 | 24.0 | 18.1 | 23.8 | 36.3 | 55.9 | 31.6 |
| Income ratio (percent of area median) 11 | 127.6 | 111.4 | 101.2 | 93.3 | 83.2 | 103.3 |
| CRA assessment area 12 | 34.7 | 29.3 | 27.1 | 25.6 | 21.7 | 27.5 |
| Sand states 13 | 7.6 | 8.7 | 14.1 | 29.4 | 70.7 | 27.7 |
| Memo: Total loans | 1,167,022 | 1,157,129 | 1,093,234 | 1,025,695 | 1,358,619 | 5,801,699 |
Note: First-lien home-purchase mortgages for one- to four-family, site-built properties.
1. The Neighborhood Stabilization Program (NSP) score is based on the NSP3 score created by the Department of Housing and Urban Development. The NSP score classifies census tracts into 5 percent "buckets" on a range of 1 to 20, with 1 being the best tracts and 20 being the worst in terms of a variety of factors, such as foreclosure rates. NSP scores determine eligibility for NSP funding; census tracts with the highest scores are considered the tracts with the greatest need for support. See text for further details. Return to table
2. Borrower income is the total income relied upon by the lender in the loan underwriting. Income is expressed relative to the median family income of the metropolitan statistical area (MSA) or statewide non-MSA in which the property being purchased is located. "Lower" is less than 80 percent of the median; "middle" is 80 percent to 119 percent; and "high" is 120 percent or more. Return to table
3. See table 14.A, note 5. Minority borrowers are borrowers other than non-Hispanic whites. Return to table
4. Credit scores are for those individuals who moved into the census tract in 2005 or 2010, as appropriate, and took out a first mortgage during that year. Note that because of differences between reporting requirements under the Home Mortgage Disclosure Act (HMDA) and the information provided to the consumer credit reporting agencies, the credit scores presented may differ some from those of the borrowers included in the HMDA data. Credit score data from the Federal Reserve Bank of New York Consumer Credit Panel/Equifax. Return to table
5. See table 9, note 3. Return to table
6. Includes loans for which occupancy status was missing. Return to table
7. See table 4, note 1. Return to table
8. In piggyback lending, borrowers simultaneously receive a first-lien loan and a junior-lien (piggyback) loan to purchase a home from the same lender. Return to table
9. Census-tract data for minority and income characteristics are derived from tract-weighted means based on population. Minority and income data are based on the 2000 census and are calculated for tracts that originated at least one loan in the appropriate year. Return to table
10. See table 14.A, note 5. Those other than non-Hispanic whites are considered minorities. This characteristic reflects the average minority population of the census tracts in the NSP score group. Return to table
11. The income category of a census tract is the median family income of the tract relative to that of the MSA or statewide non-MSA in which the tract is located as derived from the 2000 census. "Lower" is less than 80 percent of the median; "middle" is 80 percent to 119 percent; and "high" is 120 percent or more. Return to table
12. The loan was made in a neighborhood that is in a Community Reinvestment Act (CRA) assessment area of the lender. Return to table
13. Sand states consist of Arizona, California, Florida, and Nevada. Return to table
Source: Department of Housing and Urban Development; Federal Financial Institutions Examination Council, data reported under the Home Mortgage Disclosure Act.
| Characteristic | NSP score1 | |||||
|---|---|---|---|---|---|---|
| 1-4 | 5-8 | 9-12 | 13-16 | 17-20 | All | |
| 2010 | ||||||
| Borrower | ||||||
| Income ratio (percent of area median)2 | ||||||
| Lower | 19.7 | 29.3 | 35.7 | 41.6 | 46.0 | 32.8 |
| Middle | 22.9 | 25.6 | 25.4 | 24.0 | 23.4 | 24.3 |
| High | 55.3 | 43.1 | 36.8 | 32.3 | 29.0 | 41.0 |
| Minority3 | 17.9 | 15.5 | 18.8 | 26.8 | 42.4 | 22.9 |
| Memo: Mean credit score4 | 754.0 | 738.0 | 729.0 | 720.0 | 710.0 | 734.0 |
| Loan or application characteristic or occupancy status | ||||||
| Higher priced5 | 1.5 | 2.1 | 2.8 | 3.1 | 3.0 | 2.4 |
| Non-owner occupant6 | 9.6 | 10.3 | 11.4 | 12.4 | 14.5 | 11.4 |
| Nonconventional7 | 32.4 | 44.7 | 50.7 | 55.6 | 63.0 | 47.4 |
| Denial rate | 11.0 | 12.9 | 15.0 | 17.4 | 20.9 | 15.0 |
| Piggyback8 | .6 | .4 | .3 | .3 | .2 | .4 |
| Census tract of property9 | ||||||
| Minorities as a percent of population10 | 23.8 | 17.9 | 23.7 | 35.9 | 55.0 | 31.1 |
| Income ratio (percent of area median)11 | 128.0 | 111.6 | 101.4 | 93.7 | 84.2 | 103.8 |
| CRA assessment area12 | 39.1 | 31.0 | 29.3 | 30.0 | 33.6 | 33.0 |
| Sand states13 | 7.6 | 8.3 | 13.4 | 29.7 | 71.6 | 22.7 |
| Memo: Total loans | 615,001 | 550,180 | 466,428 | 392,822 | 384,384 | 2,408,815 |
Since 2005, lending activity in high-NSP tracts has fallen faster than in lower-NSP tracts. In 2005, more home-purchase loans were extended in high-NSP tracts than in tracts in any of the other NSP score quintiles. Since 2005, declines in home-purchase lending volumes have been particularly steep in high-NSP neighborhoods. In 2010, home-purchase lending in high-NSP tracts was down 75 percent from 2005 levels. This decline was much more rapid than that experienced in the other NSP quintiles. As a result, in 2010, fewer loans were originated in the high-NSP tracts than in any of the other NSP quintiles, a reversal of the pattern observed in 2005.
One potential reason for the steeper decline in home-purchase lending in the high-NSP neighborhoods is offered by the role of the sand states. House price declines have been particularly steep in these states, and previous HMDA analyses have shown that mortgage lending has fallen more steeply in these states since the height of the housing boom. Because the high-NSP tracts are more likely to be located in the sand states than lower-NSP tracts--in 2005, the sand states accounted for 71 percent of loans to high-NSP neighborhoods, a share double that of any of the other NSP quintiles--we would expect the more-rapid lending declines experienced by the sand states to result in a faster decline in lending to high-NSP tracts. However, the HMDA data reveal that lending volumes in high-NSP tracts located outside of the sand states actually fell slightly more (73 percent) than in the sand states (71 percent). This result suggests that the declines in lending volumes that are observed for the high-NSP tracts do not simply reflect geographic differences.62
A second possible reason for the steeper declines in home-purchase lending in the high-NSP neighborhoods is the role of the non-owner-occupant lending in these neighborhoods. Again, using 2005 as the base year, the share of home-purchase lending backed by non-owner-occupied properties in high-NSP tracts (25 percent) was 6 percentage points higher than in any of the lower-NSP quintiles. Since non-owner-occupant lending has fallen more rapidly than lending for owner-occupied properties across the board (as noted earlier), this finding can help explain some of the more-rapid decline in the lending activity in high-NSP neighborhoods. Non-owner-occupant lending fell 83 percent in the high-NSP tracts between 2005 and 2010--a decline that was higher than that observed for overall home-purchase lending in the high-NSP tracts or in the lower-NSP quintiles over the same period. Nevertheless, when the analysis is limited to owner-occupant lending, home-purchase lending has still fallen substantially in high-NSP tracts (68 percent) and at a rate that is well above the declines in lower-NSP tracts.
This outcome suggests that the steeper decline in lending in high-NSP neighborhoods appears to be broadly based, in that it has not been limited to non-owner-occupant lending or lending in specific states or MSAs. Instead, the steeper decline appears to reflect a changing pattern of home-purchase activity by higher-income borrowers. Loans to lower-income borrowers declined less steeply between 2005 and 2010 in high-NSP tracts (31 percent) than in lower-NSP tracts (36 percent). This pattern is reversed for lending to higher-income borrowers. In high-NSP tracts, loans to higher-income borrowers were 84 percent lower than they had been in 2005. While lower-NSP tracts also experienced sharp contractions, the declines have been less severe. The percentage decline in the high-NSP tracts was 13 percentage points above the fourth NSP quintile and 35 percentage points higher than the declines in the first quintile. The patterns for loans to middle-income borrowers have also contracted more sharply in high-NSP tracts, though the sizes of the differences have not been as large.
This changing income pattern of homebuyers suggests a challenge that efforts like the NSP confront in attempting to stabilize neighborhoods. Not only has home-purchase lending declined more rapidly in the highly distressed neighborhoods identified, but also the composition of the borrowers taking out loans has shifted notably toward those with lower incomes. While the share of loans going to higher-income borrowers in the lower-NSP quintiles declined from 50 percent in 2005 to 43 percent in 2010, in high-NSP tracts the decline was much steeper, falling from 52 percent in 2005 to 29 percent in 2010. This outcome suggests that much of the decline in lending in the highly distressed tracts reflects reduced inflows from higher-income borrowers. The lower income levels of new borrowers in the high-NSP tracts may inhibit the stabilization of these communities.
Differences in Lending Outcomes by Race, Ethnicity, and Sex of the Borrower
One reason the Congress amended HMDA in 1989 was to enhance its value for fair lending enforcement by adding to the items reported the disposition of applications for loans and the race, ethnicity, and sex of applicants. A similar motivation underlay the decision to add pricing data for higher-priced loans in 2004. Over the years, analyses of HMDA data have consistently found substantial differences in the incidence of higher-priced lending and in application denial rates across racial and ethnic lines, differences that cannot be fully explained by factors included in the HMDA data.63 Analyses also have found that differences across groups in mean APR spreads paid by those with higher-priced loans were generally small.64 Here we examine the 2010 HMDA data to determine the extent to which these differences persist.
The analysis here presents aggregated lending outcomes across all reporting institutions. Patterns for any given financial institution may differ from those shown, and for any given financial institution, relationships may vary by loan product, geographic market, and loan purpose. Further, although the HMDA data include some detailed information about each mortgage transaction, many key factors that are considered by lenders in credit underwriting and pricing are not included. Accordingly, it is not possible to determine from HMDA data alone whether racial and ethnic pricing disparities reflect illegal discrimination. However, analysis using the HMDA data can account for some factors that are likely related to the lending process. Given that lenders offer a wide variety of loan products for which basic terms and underwriting criteria can differ substantially, the analysis here can only be viewed as suggestive.
Comparisons of average outcomes (both loan pricing and denials) for each racial, ethnic, or sex group are made both before and after accounting for differences in the borrower-related factors contained in the HMDA data (income; loan amount; location of the property, or MSA; and presence of a co-applicant) and for differences in borrower-related factors plus the specific lending institution used by the borrower.65 Comparisons for lending outcomes across groups are of three types: gross (or "unmodified"), modified to account for borrower-related factors (or "borrower modified"), and modified to account for borrower-related factors plus lender (or "lender modified").66 The analysis here distinguishes between conventional and nonconventional lending, reflecting the different underwriting standards and fees associated with these two broad loan product categories.67
Incidence of Higher-Priced Lending by Race, Ethnicity, and Sex
As noted earlier, 2010 is the first HMDA reporting year for which all of the loans subject to higher-priced loan reporting used the new Freddie Mac PMMS threshold (the PMMS threshold was also used for the last three months of 2009). Before October 1, 2009, a Treasury-based threshold was used. The change in threshold makes it problematic to compare the reported incidence of higher-priced lending in 2010 with the incidence reported for previous years. Nevertheless, in previous articles, we have employed a methodology that adjusted the Treasury-based spread to a spread over the 30-year fixed-rate mortgage APOR reported in the PMMS. For almost all of the period from 2006 to 2009, this methodology gave a good approximation of the incidence of loans with APOR spreads more than 1.75 percentage points above the PMMS (25 basis points higher than the cutoff for higher-priced reporting in 2010). Calculations using the "adjusted spread" showed that the estimated incidence of loans more than 1.75 percentage points above the PMMS is significantly reduced from 2006 to 2008 for all racial and ethnic groups, and that differences across groups are considerably smaller since 2008 than in the years prior.68 Data reported for the last three months of 2009 using the new threshold showed only modest differences across groups.
The overall reported incidence of higher-priced lending is slightly higher in 2010 than for the last three months of 2009. Group patterns are similar. The 2010 HMDA data indicate that black and Hispanic-white borrowers are more likely, and Asian borrowers less likely, to obtain conventional loans with prices above the HMDA price-reporting thresholds than are non-Hispanic white borrowers (table 17.A). These relationships hold both for home-purchase and refinance lending and for nonconventional loans (table 17.B). For example, for conventional home-purchase lending in 2010, the incidence of higher-priced lending was 6.0 percent for black borrowers, 7.1 percent for Hispanic white borrowers, and 1.0 percent for Asians, compared with 3.3 percent for non-Hispanic white borrowers.
| Race, ethnicity, and sex | Number of loans | Unmodified incidence | Modified incidence, by modification factor | Number of loans | Unmodified incidence | Modified incidence, by modification factor | ||
|---|---|---|---|---|---|---|---|---|
| Borrower-related | Borrower-related plus lender | Borrower-related | Borrower-related plus lender | |||||
| Home purchase | Refinance | |||||||
| Race other than white only 1 | ||||||||
| American Indian or Alaska Native | 3,066 | 6.62 | 5.43 | 3.82 | 8,915 | 2.93 | 1.84 | 1.65 |
| Asian | 87,321 | 1.02 | 2.87 | 3.39 | 219,886 | 0.22 | 0.97 | 1.31 |
| Black or African American | 21,982 | 6.00 | 5.44 | 3.98 | 74,144 | 3.96 | 2.88 | 1.92 |
| Native Hawaiian or other Pacific Islander | 2,357 | 2.04 | 3.37 | 3.57 | 7,428 | 0.85 | 1.61 | 1.35 |
| Two or more minority races | 364 | 1.92 | 2.98 | 3.07 | 1,378 | 0.73 | 1.44 | 1.25 |
| Joint | 14,776 | 2.37 | 3.41 | 3.43 | 56,000 | 0.80 | 1.51 | 1.53 |
| Missing | 88,728 | 1.04 | 1.77 | 3.38 | 403,288 | 0.59 | 0.83 | 1.34 |
| White, by ethnicity1 | ||||||||
| Hispanic white | 41,665 | 7.08 | 5.00 | 3.81 | 110,378 | 2.30 | 1.73 | 1.61 |
| Non-Hispanic white | 731,874 | 3.34 | 3.34 | 3.34 | 2,919,913 | 1.33 | 1.33 | 1.33 |
| Sex | ||||||||
| One male | 271,589 | 3.35 | 3.35 | 3.35 | 731,931 | 1.46 | 1.46 | 1.46 |
| One female | 196,692 | 2.94 | 2.79 | 3.12 | 576,115 | 1.73 | 1.37 | 1.40 |
| Two males 2 | 10,960 | 7.23 | 7.23 | 7.23 | 26,429 | 1.59 | 1.59 | 1.59 |
| Two females2 | 8,256 | 4.17 | 5.32 | 6.67 | 25,460 | 1.70 | 1.40 | 1.47 |
Note: First-lien mortgages for owner-occupied, one- to four-family, site-built properties; excludes business loans. Business-related loans are those for which the lender reported that the race, ethnicity, and sex of the applicant or co-applicant are "not applicable." For definition of higher-priced lending and explanation of modification factors, see text and table 9, note 3. Loans taken out jointly by a male and female are not tabulated here because they would not be directly comparable with loans taken out by one borrower or by two borrowers of the same sex.
1. See table 14.A, note 5. Return to table
2. Data reflect updates to the Home Mortgage Disclosure Act (HMDA) files received by the Federal Financial Institutions Examination Council since the public release of the files in September 2011. The updated data are primarily corrections of gender identification of applicants previously submitted by one large lender. All other data in the tables and figures presented in this article are unchanged and reflect the HMDA files as originally released to the public in September 2011. Return to table
n.a. Not available.
Return to text| Race, ethnicity, and sex | Number of loans | Unmodified incidence | Modified incidence, by modification factor | Number of loans | Unmodified incidence | Modified incidence, by modification factor | ||
|---|---|---|---|---|---|---|---|---|
| Borrower-related | Borrower-related plus lender | Borrower-related | Borrower-related plus lender | |||||
| Home purchase | Refinance | |||||||
| Race other than white only1 | ||||||||
| American Indian or Alaska Native | 7,047 | 1.35 | 1.34 | 1.08 | 2,636 | 4.74 | 3.58 | 2.09 |
| Asian | 31,550 | 0.76 | 0.81 | 0.88 | 10,898 | 3.14 | 3.26 | 3.13 |
| Black or African American | 106,782 | 2.39 | 1.91 | 1.56 | 53,487 | 9.88 | 5.48 | 4.20 |
| Native Hawaiian or other Pacific Islander | 5,133 | 1.05 | 1.25 | 1.15 | 2,400 | 4.25 | 3.51 | 3.40 |
| Two or more minority races | 750 | 0.67 | 1.73 | 1.62 | 349 | 1.72 | 2.79 | 2.93 |
| Joint | 16,561 | 0.62 | 1.18 | 0.91 | 11,048 | 1.96 | 3.35 | 3.49 |
| Missing | 88,344 | 1.37 | 1.06 | 1.03 | 57,523 | 2.50 | 2.63 | 2.27 |
| White, by ethnicity1 | ||||||||
| Hispanic white | 134,178 | 2.18 | 1.24 | 1.21 | 36,241 | 5.77 | 3.16 | 2.90 |
| Non-Hispanic white | 742,748 | 1.01 | 1.01 | 1.01 | 458,231 | 4.62 | 4.62 | 4.62 |
| Sex | ||||||||
| One male | 393,079 | 1.42 | 1.42 | 1.42 | 177,634 | 4.12 | 4.12 | 4.12 |
| One female | 275,264 | 1.81 | 1.32 | 1.34 | 118,046 | 9.28 | 5.50 | 5.05 |
| Two males2 | 17,524 | 1.39 | 1.39 | 1.39 | 5,706 | 1.63 | 1.63 | 1.63 |
| Two females2 | 13,442 | 1.55 | 1.39 | 1.59 | 4,983 | 3.65 | 3.48 | 2.55 |
Note: See notes to table 17.A.
Return to textThe gross differences in the incidence of higher-priced lending between non-Hispanic whites and blacks or Hispanic whites in 2010 are significantly reduced, but not completely eliminated, after controlling for lender and borrower characteristics. For example, the gross 2010 difference in the incidence of higher-priced conventional lending for home-purchase loans between Hispanic whites and non-Hispanic whites of 3.7 percent falls to only about 0.5 percentage point when the other factors available within the HMDA data are accounted for. For both conventional and nonconventional lending, the black-versus-non-Hispanic-white disparity is reduced to about 0.6 percentage point for both home-purchase and refinance loans. These disparities are significantly lower than the higher-priced incidence disparities observed from 2004 to 2007 using both the old Treasury-based threshold and our PMMS-based adjusted spread.
With regard to the sex of applicants, we report differences between one male and one female and between two males and two females. Here, no notable differences are evident for either conventional or nonconventional lending.
Rate Spreads by Race, Ethnicity, and Sex
The 2010 data indicate that among borrowers with higher-priced loans, the gross APOR spreads are similar across groups for both home-purchase and refinance lending. This result holds for both conventional (table 18.A) and nonconventional lending (table 18.B). For example, for conventional home-purchase loans, the gross mean APOR spread was 2.74 percentage points for black borrowers and 2.66 percentage points for Hispanic white borrowers, while it was 2.48 percentage points for non-Hispanic white borrowers and 2.45 percentage points for Asian borrowers. Accounting for borrower-related factors or the specific lender used by the borrowers reduces these differences.
| Race, ethnicity, and sex | Number of higher-priced loans 1 | Unmodified mean spread | Modified mean spread, by modification factor | Number of higher-priced loans1 | Unmodified mean spread | Modified mean spread, by modification factor | ||
|---|---|---|---|---|---|---|---|---|
| Borrower-related | Borrower-related plus lender | Borrower-related | Borrower-related plus lender | |||||
| Home purchase | Refinance | |||||||
| Race other than white only 2 | ||||||||
| American Indian or Alaska Native | 203 | 2.81 | 2.67 | 2.64 | 261 | 2.99 | 3.18 | 2.71 |
| Asian | 888 | 2.45 | 2.53 | 2.43 | 474 | 2.34 | 2.67 | 2.55 |
| Black or African American | 1,318 | 2.74 | 2.91 | 2.64 | 2,934 | 3.31 | 3.25 | 2.70 |
| Native Hawaiian or other Pacific Islander | 48 | 2.54 | 2.57 | 2.56 | 63 | 2.68 | 3.03 | 2.63 |
| Two or more minority races | 7 | 2.52 | 2.66 | 2.36 | 10 | 2.75 | 2.38 | 2.67 |
| Joint | 350 | 2.70 | 2.76 | 2.49 | 448 | 2.68 | 2.60 | 2.65 |
| Missing | 919 | 2.28 | 2.27 | 2.54 | 2,394 | 2.68 | 3.26 | 2.59 |
| White, by ethnicity2 | ||||||||
| Hispanic white | 2,949 | 2.66 | 2.52 | 2.53 | 2,537 | 3.00 | 2.74 | 2.66 |
| Non-Hispanic white | 24,458 | 2.48 | 2.48 | 2.48 | 38,698 | 2.63 | 2.63 | 2.63 |
| Sex | ||||||||
| One male | 9,095 | 2.54 | 2.54 | 2.54 | 10,677 | 2.72 | 2.72 | 2.72 |
| One female | 5,773 | 2.48 | 2.48 | 2.51 | 9,946 | 2.80 | 2.73 | 2.72 |
| Two males 3 | 792 | 2.56 | 2.56 | 2.56 | 419 | 2.75 | 2.75 | 2.75 |
| Two females3 | 344 | 2.55 | 2.48 | 2.98 | 434 | 2.91 | 2.52 | 2.95 |
Note: For definition of higher-priced lending and explanation of modification factors, see text. Loans taken out jointly by a male and female are not tabulated here because they would not be directly comparable with loans taken out by one borrower or by two borrowers of the same sex. For definition of average prime offer rate spread, see table 11, note 1.
1. See table 9, note 3. Return to table
2. See table 14.A, note 5. Return to table
3. Data reflect updates to the Home Mortgage Disclosure Act (HMDA) files received by the Federal Financial Institutions Examination Council since the public release of the files in September 2011. The updated data are primarily corrections of gender identification of applicants previously submitted by one large lender. All other data in the tables and figures presented in this article are unchanged and reflect the HMDA files as originally released to the public in September 2011. Return to table
n.a. Not available.
Return to text| Race, ethnicity, and sex | Number of higher-priced loans1 | Unmodified mean spread | Modified mean spread, by modification factor | Number of higher-priced loans1 | Unmodified mean spread | Modified mean spread, by modification factor | ||
|---|---|---|---|---|---|---|---|---|
| Borrower-related | Borrower-related plus lender | Borrower-related | Borrower-related plus lender | |||||
| Home purchase | Refinance | |||||||
| Race other than white only2 | ||||||||
| American Indian or Alaska Native | 95 | 1.84 | 1.81 | 1.78 | 125 | 2.20 | 2.12 | 2.12 |
| Asian | 239 | 1.83 | 1.81 | 1.83 | 342 | 2.10 | 2.12 | 2.15 |
| Black or African American | 2,556 | 1.83 | 1.85 | 1.89 | 5,286 | 2.39 | 2.31 | 2.26 |
| Native Hawaiian or other Pacific Islander | 54 | 1.99 | 1.78 | 1.89 | 102 | 2.09 | 2.07 | 2.09 |
| Two or more minority races | 5 | 1.62 | 1.79 | 1.95 | 6 | 2.10 | 2.01 | 2.09 |
| Joint | 103 | 1.93 | 1.96 | 1.66 | 217 | 2.08 | 2.15 | 2.20 |
| Missing | 1,213 | 1.83 | 1.84 | 1.80 | 1,437 | 2.03 | 2.22 | 2.07 |
| White, by ethnicity2 | ||||||||
| Hispanic white | 2,929 | 1.77 | 1.79 | 1.84 | 2,091 | 2.26 | 2.17 | 2.16 |
| Non-Hispanic white | 7,510 | 1.86 | 1.86 | 1.86 | 21,178 | 2.17 | 2.17 | 2.17 |
| Sex | ||||||||
| One male | 5,600 | 1.82 | 1.82 | 1.82 | 7,322 | 2.21 | 2.21 | 2.21 |
| One female | 4,984 | 1.83 | 1.82 | 1.81 | 10,955 | 2.29 | 2.22 | 2.22 |
| Two males3 | 243 | 1.77 | 1.77 | 1.77 | 93 | 2.03 | 2.03 | 2.03 |
| Two females3 | 208 | 1.77 | 1.73 | 1.74 | 182 | 2.03 | 2.24 | 2.03 |
Note: See notes to table 18.A.
Return to textDenial Rates by Race, Ethnicity, and Sex
Analyses of the HMDA data in previous years have consistently found that denial rates vary across applicants grouped by race or ethnicity. This is also the case in 2010. In 2010, as in past years, blacks and Hispanic whites had notably higher gross denial rates than non-Hispanic whites, while the differences between Asians and non-Hispanic whites generally were fairly small by comparison (tables 19.Aand 19.B). For example, in 2010, the denial rates for conventional home-purchase loans were 30.9 percent for blacks, 22.9 percent for Hispanic whites, 14.4 percent for Asians, and 12.3 percent for non-Hispanic whites. The pattern was about the same for nonconventional home-purchase lending, although the gap in gross denial rates between blacks or Hispanic whites and non-Hispanic whites was smaller than for conventional home-purchase loans; the gap between Asians and non-Hispanic whites was higher.
| Race, ethnicity, and sex | Number of applications acted upon by lender | Unmodified denial rate | Modified denial rate, by modification factor | Number of applications acted upon by lender | Unmodified denial rate | Modified denial rate, by modification factor | ||
|---|---|---|---|---|---|---|---|---|
| Borrower-related | Borrower-related plus lender | Borrower-related | Borrower-related plus lender | |||||
| Home purchase | Refinance | |||||||
| Race other than white only 1 | ||||||||
| American Indian or Alaska Native | 4,874 | 30.9 | 25.1 | 17.4 | 15,873 | 38.0 | 36.0 | 27.7 |
| Asian | 112,928 | 14.4 | 15.0 | 14.3 | 291,887 | 18.5 | 21.7 | 21.8 |
| Black or African American | 34,916 | 30.9 | 24.8 | 21.5 | 141,550 | 41.3 | 35.6 | 31.1 |
| Native Hawaiian or other Pacific Islander | 3,279 | 20.8 | 17.3 | 15.5 | 11,972 | 31.7 | 31.4 | 25.8 |
| Two or more minority races | 541 | 26.6 | 23.4 | 14.1 | 2,271 | 32.1 | 35.1 | 29.0 |
| Joint | 18,241 | 12.5 | 15.1 | 13.1 | 72,901 | 17.5 | 22.3 | 20.6 |
| Missing | 121,297 | 18.8 | 18.6 | 15.5 | 619,516 | 28.3 | 27.5 | 23.3 |
| White, by ethnicity1 | ||||||||
| Hispanic white | 59,719 | 22.9 | 17.3 | 16.5 | 178,990 | 31.9 | 27.0 | 25.0 |
| Non-Hispanic white | 894,301 | 12.3 | 12.3 | 12.3 | 3,844,364 | 19.0 | 19.0 | 19.0 |
| Sex | ||||||||
| One male | 352,879 | 16.5 | 16.5 | 16.5 | 1,073,760 | 25.6 | 25.6 | 25.6 |
| One female | 251,817 | 15.9 | 14.7 | 15.2 | 827,460 | 24.8 | 23.5 | 23.8 |
| Two males 2 | 14,497 | 18.1 | 18.1 | 18.1 | 68,883 | 58.4 | 58.4 | 58.4 |
| Two females2 | 10,901 | 18.3 | 16.6 | 15.9 | 40,212 | 32.0 | 32.8 | 36.1 |
Note: First-lien mortgages for owner-occupied, one- to four-family, site-built properties; excludes business loans. Business-related loans are those for which the lender reported that the race, ethnicity, and sex of the applicant or co-applicant are "not applicable." For explanation of modification factors, see text. Applications made jointly by a male and female are not tabulated here because they would not be directly comparable with applications made by one applicant or by two applicants of the same sex.
1. See table 14.A, note 5. Return to table
2. Data reflect updates to the Home Mortgage Disclosure Act (HMDA) files received by the Federal Financial Institutions Examination Council since the public release of the files in September 2011. The updated data are primarily corrections of gender identification of applicants previously submitted by one large lender. All other data in the tables and figures presented in this article are unchanged and reflect the HMDA files as originally released to the public in September 2011. Return to table
n.a. Not available.
Return to text| Race, ethnicity, and sex | Number of applications acted upon by lender | Unmodified denial rate | Modified denial rate, by modification factor | Number of applications acted upon by lender | Unmodified denial rate | Modified denial rate, by modification factor | ||
|---|---|---|---|---|---|---|---|---|
| Borrower-related | Borrower-related plus lender | Borrower-related | Borrower-related plus lender | |||||
| Home purchase | Refinance | |||||||
| Race other than white only1 | ||||||||
| American Indian or Alaska Native | 9,187 | 18.1 | 18.2 | 16.6 | 4,900 | 39.1 | 41.6 | 35.7 |
| Asian | 41,472 | 18.4 | 17.4 | 16.2 | 18,754 | 34.1 | 35.6 | 33.0 |
| Black or African American | 145,752 | 22.0 | 20.1 | 19.3 | 105,774 | 42.2 | 41.6 | 37.8 |
| Native Hawaiian or other Pacific Islander | 6,697 | 18.2 | 16.8 | 15.4 | 3,939 | 32.0 | 39.1 | 35.7 |
| Two or more minority races | 1,002 | 20.4 | 16.4 | 13.9 | 796 | 48.0 | 50.7 | 42.8 |
| Joint | 19,901 | 12.6 | 14.1 | 13.3 | 16,577 | 26.5 | 31.8 | 31.3 |
| Missing | 118,582 | 20.4 | 20.9 | 18.3 | 130,599 | 48.3 | 43.9 | 33.6 |
| White, by ethnicity1 | ||||||||
| Hispanic white | 179,737 | 19.9 | 16.4 | 16.3 | 62,190 | 33.2 | 35.2 | 34.7 |
| Non-Hispanic white | 892,067 | 12.7 | 12.7 | 12.7 | 715,795 | 29.5 | 29.5 | 29.5 |
| Sex | ||||||||
| One male | 496,319 | 16.4 | 16.4 | 16.4 | 306,236 | 35.0 | 35.0 | 35.0 |
| One female | 346,589 | 16.3 | 15.2 | 15.5 | 203,795 | 35.4 | 33.1 | 33.5 |
| Two males2 | 23,455 | 20.5 | 20.5 | 20.5 | 9,291 | 31.2 | 31.2 | 31.2 |
| Two females2 | 1,777 | 19.2 | 17.4 | 16.3 | 8,465 | 33.9 | 30.9 | 29.7 |
Note: See notes to table 19.A.
Return to textFor both conventional and nonconventional lending, controlling for borrower-related factors in the HMDA data generally reduces the differences among racial and ethnic groups. Accounting for the specific lender used by the applicant reduces differences further, although unexplained differences remain between non-Hispanic whites and other racial and ethnic groups.
Conventional lending denial rate disparities between groups, both gross and controlling for other factors, have narrowed somewhat in the past several years. For example, the conventional home-purchase denial rate disparity between blacks and non-Hispanic whites, controlling for all factors, narrowed from 10.8 percentage points in 2008 to 9.2 percentage points in 2010. This narrowing appears to stem more from changes in the composition of the applicant pool over time than from changes in the way lenders act on specific applications. For example, the gross overall denial rate for conventional home-purchase loans used in the analysis of this section fell about 0.3 percentage point from 2009 to 2010 (data not shown in tables). Yet if the analysis is restricted to a comparison of applicants of the same race, gender, income, location, and loan request, applying to the same lender, the denial rate rose about 0.2 percentage point. A similar analysis using 2008 and 2009 data shows that a gross decline in the denial rate of about 2.9 percentage points between the two years drops to almost zero when controlling for borrower characteristics and lender. An analysis of refinance loans shows similar patterns, although the differences between gross denial rate changes and changes controlling for borrower characteristics and lender are more muted. Patterns for nonconventional lending are similar but also more muted.
Some Limitations of the Data in Assessing Fair Lending Compliance
Both previous research and experience gained in the fair lending enforcement process show that unexplained differences in the incidence of higher-priced lending and in denial rates among racial or ethnic groups stem, at least in part, from credit-related factors not available in the HMDA data, such as measures of credit history (including credit scores) and LTV and differences in choice of loan products. Differential costs of loan origination and the competitive environment also may bear on the differences in pricing, as may differences across populations in credit-shopping activities.
Despite these limitations, the HMDA data play an important role in fair lending enforcement. The data are regularly used by bank examiners to facilitate the fair lending examination and enforcement processes. When examiners for the federal banking agencies evaluate an institution's fair lending risk, they analyze HMDA price data and loan application outcomes in conjunction with other information and risk factors that can be drawn directly from loan files or electronic records maintained by lenders, as directed by the Interagency Fair Lending Examination Procedures.69 The availability of broader information allows the examiners to draw firm conclusions about institution compliance with the fair lending laws.
It is important to keep in mind that the HMDA data, as currently constituted, can be used only to detect differences in pricing across groups for loans with APRs above the reporting threshold; pricing differences may exist among loans below the threshold. This gap in the loan pricing information will be addressed in coming years as the CFPB implements the expanded data reporting requirements set forth in the Dodd-Frank Wall Street Reform and Consumer Protection Act of 2010 (Dodd-Frank Act), including the provision requiring the reporting of rate spread information for all loans (see the next section).
Future Changes in HMDA
The Dodd-Frank Act includes many provisions that change the landscape of the financial services industry generally and that of the mortgage market in particular. Two provisions in the Dodd-Frank Act bear directly on the HMDA data. First, title X of the Dodd-Frank Act shifts the responsibility for writing rules to implement a host of consumer protection statutes, including HMDA, to the new CFPB. With respect to HMDA, the CFPB has authority to prescribe rules regarding (1) the nature and scope of the data to be collected and reported, (2) the method of submitting data, (3) the format and content of disclosures, and (4) required modifications to the HMDA data prior to public disclosure by the FFIEC and the reporting entities to help protect the privacy of individuals.
Second, the Dodd-Frank Act amended HMDA, requiring covered institutions to collect and report several new data items. The new data items range widely and include information about loan terms, the property and originator involved in the transaction, and the borrower, as well as a unique loan identification number.
The New Data Items
The following enumerates the new data items that must be reported and those that were mentioned in the Dodd-Frank Act but for which discretion was left to the CFPB to decide whether to include them in the required reporting. The new items fall into several categories; the items that may be included at the discretion of the CFPB are noted.
- Loan terms
- Total points and fees
- APOR rate spread for all loans, measured against a benchmark rate to be determined by the CFPB (now required only for higher-priced loans)
- Duration (and existence) of prepayment penalty
- Indicator of whether mortgage has an adjustable rate
- Length of introductory interest rate period for adjustable-rate mortgages
- Presence of negative amortization feature
- Term to maturity
- Property information
- Property value
- Parcel identification number, at the option of the CFPB
- Originator information
- Origination channel (such as retail loan officer or broker)
- Originator identification number (as set forth in the Secure and Fair Enforcement for Mortgage Licensing Act, or SAFE Act), at the option of the CFPB 70
- Borrower information
- Credit score, in a form determined by the CFPB
- Age
- Universal loan identification number, at the option of the CFPB
Four of these items are currently being collected by institutions covered by HMDA but are not reported or disclosed to the public. These items are required inputs into the "rate spread calculator" made available to covered entities by the FFIEC to determine whether the APOR spread on a loan is large enough to require reporting of the interest rate spread.71 The four items are (1) the term to maturity, (2) the APOR spread, (3) an indicator of whether the loan has a fixed or adjustable interest rate, and (4) the length of the introductory rate period for adjustable-rate loans.
The Dodd-Frank Act also stipulated changes in the way in which the new data items (except for borrower age) would be released to the public as compared with the current data release. The act states that the new items will be reported in grouped form as counts of loans and loan dollars, with the CFPB determining the appropriate groupings.
Timing
At the time of this writing, there is some uncertainty about the schedule for forthcoming changes to HMDA rules. Under the Dodd-Frank Act, reporting entities are given a period of time to make changes to their data collection and reporting systems before compliance must begin with a revised rule. Following the issuance of final rules, a minimum of nine additional months must pass before data collection begins. On the January 1 following that nine-month period, institutions would be required to begin collecting the new data elements, with reporting of the modified data by March 1 of the next calendar year. For example, if new final rules are adopted in February 2013, collection of the expanded data would begin January 1, 2014, with reporting beginning in 2015.
APPENDIX A: REQUIREMENTS OF REGULATION C
The Federal Reserve Board's Regulation C requires lenders to report the following information on home-purchase and home-improvement loans and on refinancings:
For each application or loan
- application date and the date an action was taken on the application
- action taken on the application
- approved and originated
- approved but not accepted by the applicant
- denied (with the reasons for denial--voluntary for some lenders)
- withdrawn by the applicant
- file closed for incompleteness
- preapproval program status (for home-purchase loans only)
- preapproval request denied by financial institution
- preapproval request approved but not accepted by individual
- loan amount
- loan type
- conventional
- insured by the Federal Housing Administration
- guaranteed by the Department of Veterans Affairs
- backed by the Farm Service Agency or Rural Housing Service
- lien status
- first lien
- junior lien
- unsecured
- loan purpose
- home purchase
- refinance
- home improvement
- type of purchaser (if the lender subsequently sold the loan during the year)
- Fannie Mae
- Ginnie Mae
- Freddie Mac
- Farmer Mac
- Private securitization
- Commercial bank, savings bank, or savings association
- Life insurance company, credit union, mortgage bank, or finance company
- Affiliate institution
- Other type of purchaser
For each applicant or co-applicant
- race
- ethnicity
- sex
- income relied on in credit decision
For each property
- location, by state, county, metropolitan statistical area, and census tract
- type of structure
- one- to four-family dwelling
- manufactured home
- multifamily property (dwelling with five or more units)
- occupancy status (owner occupied, non-owner occupied, or not applicable)
For loans subject to price reporting
- spread above comparable Treasury security for applications taken prior to October 1, 2010
- spread above average prime offer rate for applications taken on or after October 1, 2010
For loans subject to the Home Ownership and Equity Protection Act
- indicator of whether loan is subject to the Home Ownership and Equity Protection Act
1. A brief history of HMDA is available at Federal Financial Institutions Examination Council, "History of HMDA," webpage, www.ffiec.gov/hmda/history2.htm. Return to text
2. It is estimated that the HMDA data cover about 90 to 95 percent of Federal Housing Administration lending and between 75 and 85 percent of other first-lien home loans. See U.S. Department of Housing and Urban Development, Office of Policy Development and Research (2011), "A Look at the FHA's Evolving Market Shares by Race and Ethnicity," U.S. Housing Market Conditions (May), pp. 6-12, www.huduser.org/portal/periodicals/ushmc/spring11/USHMC_1q11.pdf  . Return to text
3. A list of the items reported under HMDA for 2010 is provided in appendix A. Return to text
4. Information about Regulation C (12 C.F.R. pt. 203) is available at www.federalreserve.gov. Return to text
5. For information about the Consumer Financial Protection Bureau, see www.consumerfinance.gov. Return to text
6. The FFIEC (www.ffiec.gov) was established by federal law in 1979 as an interagency body to prescribe uniform examination procedures, and to promote uniform supervision, among the federal agencies responsible for the examination and supervision of financial institutions. The member agencies are the Board of Governors of the Federal Reserve System, the Consumer Financial Protection Bureau, the Federal Deposit Insurance Corporation, the National Credit Union Administration, the Office of the Comptroller of the Currency, and representatives from state bank supervisory agencies. Under agreements with these agencies and the Department of Housing and Urban Development, the Federal Reserve Board collects and processes the HMDA data. Return to text
7. For the 2010 data, the FFIEC prepared and made available to the public 45,961 MSA-specific HMDA reports on behalf of reporting institutions. The FFIEC also makes available to the public similar reports about private mortgage insurance (PMI) activity; for the 2010 data, it prepared and made publicly available 2,478 MSA-specific PMI reports on behalf of the PMI companies. All of the HMDA and PMI reports are available on the FFIEC's reports website at www.ffiec.gov/reports.htm.
The designation of MSAs is not static. From time to time, the Office of Management and Budget updates the list and geographic scope of metropolitan and micropolitan statistical areas. See Office of Management and Budget, "Statistical Programs and Standards," webpage, www.whitehouse.gov/omb/inforeg_statpolicy. Return to text
8. The only reported items not included in the data made available to the public are the loan application number, the date of the application, and the date on which action was taken on the application. Return to text
9. Some lenders file amended HMDA reports, which are not reflected in the initial public data release. A "final" HMDA data set reflecting these changes is created two years following the initial data release. The data used to prepare this article are drawn from the initial public release for 2009 and 2010 and from the "final" HMDA data for years prior to that. Consequently, numbers in this article for the years 2008 and earlier may differ somewhat from numbers calculated from the initial public release files. Return to text
10. For the 2011 reporting year (covering lending in 2010), the minimum asset size for purposes of coverage was $39 million. The minimum asset size changes from year to year with changes in the Consumer Price Index for Urban Wage Earners and Clerical Workers. The threshold for the 2010 data was unchanged from the level applicable to the prior year. See the FFIEC's guide to HMDA reporting at www.ffiec.gov/hmda/guide.htm. Return to text
11. Each year, the Federal Reserve Board tracks each financial institution that is expected to report (including all lenders that reported data for the previous calendar year) and then contacts, if possible, those institutions that did not submit a report. In some cases, nonreporting is due to a cessation of business; in most others, it is the result of a merger, acquisition, or consolidation. When a merger, acquisition, or consolidation occurs, all lending by the institutions covered by HMDA in that year is supposed to be reported by the surviving entity; only when an institution goes out of business or the surviving entity is not a HMDA-covered reporter is the volume of reported loans likely affected. Return to text
12. Lenders report the date on which action on an application is taken. For originations, the "action taken" date is the closing date or date of origination for the loan. This date is the one we use to compile data at the monthly level. Generally, the interest rate on a loan is set at an earlier point known as the lock date. The interest rate series in the figure is constructed from the results of a survey of "offer rates" made by lenders to prime borrowers. The loan pricing is likely to reflect the interest rate available at the time of the lock date. Thus, the timing of the loan volume and interest rate series may be slightly misaligned in the figure. Return to text
13. The program was not limited to first-time homebuyers. Eligibility for the tax credit also was extended to homebuyers who were long-time residents of their previous homes. The program included income and home-value limits. For more information, see Internal Revenue Service (2009), "First-Time Homebuyer Credit Extended to April 30, 2010; Some Current Homeowners Now Also Qualify," press release, November 24, www.irs.gov/newsroom/article/0,,id=215791,00.html; and Internal Revenue Service, "First-Time Homebuyer Credit," webpage, www.irs.gov/newsroom/article/0,,id=204671,00.html. Return to text
14. Our analysis in an earlier article suggested that about one-half of the home-purchase loans in 2009 qualified under the first-time homebuyer tax credit program. See Robert B. Avery, Neil Bhutta, Kenneth P. Brevoort, and Glenn B. Canner (2010), "The 2009 HMDA Data: The Mortgage Market in a Time of Low Interest Rates and Economic Distress," Federal Reserve Bulletin, vol. 96, pp. A39-A77. Return to text
15. The volume of home-purchase originations fell nearly 40 percent from June 2010 to July 2010 and then remained at reduced levels for the rest of the year. Return to text
16. An investment property is a non-owner-occupied dwelling that is intended to be rented or resold for a profit. Some non-owner-occupied units--vacation homes and second homes--are for the primary use of the owners and thus would not be considered investment properties. The HMDA data do not, however, distinguish between these two types of non-owner-occupied dwellings. Return to text
17. Research using credit record data suggests that in states that experienced the largest run-up in home prices, investors accounted for about one-half of the home-purchase loans. See Andrew Haughwout, Donghoon Lee, Joseph Tracy, and Wilbert van der Klaauw (2011), "Real Estate Investors, the Leverage Cycle and the Housing Market Crisis," paper presented at the Housing Economics and Research Conference, UCLA Ziman Center for Real Estate, Los Angeles, April, www.anderson.ucla.edu/x30674.xml . Return to text
18. Many of these resort areas are in rural counties, which creates a potential bias for HMDA-based calculations. Lenders without offices in metropolitan areas do not have to report HMDA data. If borrowers for non-owner-occupant loans are less likely than those for owner-occupant loans to use local lenders, this circumstance would bias the HMDA incidence of non-owner-occupant lending upward in rural areas. Return to text
19. Founded in 1973, the Mortgage Insurance Companies of America is the trade association for the PMI industry. Return to text
20. One firm that reported data in previous years, Triad Guaranty Insurance Corporation, stopped issuing new policies in July 2008 but continues to manage existing policies. Return to text
21. Some care must be exercised in comparing the PMI and HMDA data. First, because of reporting rules, the HMDA data do not cover all lending for properties in rural areas. However, the PMI reporting firms provide information on all privately insured loans regardless of property location. Second, the "action date" for PMI issuance is the date that the PMI insurance was extended, which is often different from the date the loan was closed, which determines the HMDA action date. For loans taken out near the beginning or end of a calendar year, this factor could shift the PMI reporting into a reporting year different from that of the loan. Third, the size of the loan and borrower characteristics can also differ between the two data sources. Finally, the PMI data do not capture "pool insurance"--that is, insurance written for pools of loans rather than individual mortgage loans. The omission of this type of insurance tends to understate the breadth of PMI coverage. Return to text
22. For the other applications that did not result in a policy being written, the application was withdrawn, the application file closed because it was not completed, or the request was approved but no policy was issued. Return to text
23. For a more detailed analysis, see Avery and others, "The 2009 HMDA Data." Return to text
24. Unless a junior lien is used for home purchase or explicitly for home improvements, it is not reported under HMDA unless it is used to refinance an existing lien. Further, about one-half of all junior liens are HELOCs, which do not have to be reported in the HMDA data regardless of the purpose of the loan. Return to text
25. Ginnie Mae does not buy or sell loans; rather, it guarantees investors on the timely payment of interest and principal for mortgage-backed securities backed by FHA or VA loans. (See the Ginnie Mae website at www.ginniemae.gov.) Farmer Mac purchases certain types of agriculture-related loans. (See a description of Farmer Mac programs at www.farmermac.com/Lenders/Programs .) Fannie Mae and Freddie Mac are government-sponsored enterprises, which, while federally chartered, are privately owned. However, in 2008, these two entities were placed under government conservatorship. (See the Fannie Mae and Freddie Mac websites at www.fanniemae.com/kb/index?page=home
and www.freddiemac.com .) Return to text
26. Some loans recorded as sold in the HMDA data are sold to affiliated institutions and thus are not true secondary-market sales. In 2010, 6.3 percent of the loans recorded as sold in the HMDA data were sales to affiliates. Return to text
27. The information provided in the tables is identical to that provided in analyses of earlier years of HMDA data. Comparisons of the numbers in tables 11 and 12 with those in the tables from earlier years, including denial rates, can be made by consulting the following articles: Avery and others, "The 2009 HMDA Data"; and Robert B. Avery, Neil Bhutta, Kenneth P. Brevoort, Glenn B. Canner, and Christa N. Gibbs (2010), "The 2008 HMDA Data: The Mortgage Market during a Turbulent Year," Federal Reserve Bulletin, vol. 96, pp. A169-A211. Also see Robert B. Avery, Kenneth P. Brevoort, and Glenn B. Canner (2008), "The 2007 HMDA Data," Federal Reserve Bulletin, vol. 94, pp. A107-A146; Robert B. Avery, Kenneth P. Brevoort, and Glenn B. Canner (2007), "The 2006 HMDA Data," Federal Reserve Bulletin, vol. 93, pp. A73-A109; Robert B. Avery, Kenneth P. Brevoort, and Glenn B. Canner (2006), "Higher-Priced Home Lending and the 2005 HMDA Data," Federal Reserve Bulletin, vol. 92, pp. A123-A166; and Robert B. Avery, Glenn B. Canner, and Robert E. Cook (2005),"New Information Reported under HMDA and Its Application in Fair Lending Enforcement," Federal Reserve Bulletin, vol. 91, pp. 344-94. Return to text
28. The rules for reporting loan pricing information under HMDA were originally adopted in 2002, covering lending beginning in 2004. These older rules required lenders to compare the APR on the loan with the yield on a Treasury security with a comparable term to maturity to determine whether the loan should be considered higher priced: If the difference exceeded 3 percentage points for a first-lien loan or 5 percentage points for a junior-lien loan, the loan was classified as higher priced and the rate spread (the amount of the difference) was reported. Return to text
29. For a more detailed discussion of the problems with the old price-reporting rules that led to the change, see Avery and others, "The 2009 HMDA Data." Return to text
30. The weekly PMMS reports the average contract rates and points for all loans and the margin for adjustable-rate loans for loans offered to prime borrowers (those who pose the lowest credit risk). The survey currently reports information for two fixed-rate mortgage products (30-year and 15-year terms) and two adjustable-rate mortgage products (1-year adjustable rate and a 5-year adjustable rate). See Freddie Mac, "Weekly Primary Mortgage Market Survey (PMMS)," webpage, www.freddiemac.com/pmms ; and Federal Financial Institutions Examination Council, "New FFIEC Rate Spread Calculator," webpage, www.ffiec.gov/ratespread/newcalc.aspx. Return to text
31. In previous articles exploring the distortions created by the old loan pricing classification methodology (see Avery and others, "The 2009 HMDA Data"), we used an adjustment technique that tried to address those distortions. The adjustment technique was similar to the new reporting rules, though it was also clearly inferior to them and could not have been implemented without access to date information, which is not part of the public use file. Without this adjustment, comparison of higher-priced data for loans covered by the old reporting rules with such data for loans covered by the new ones is not appropriate. Even with the adjustment, it is not possible to adjust the data for loans reported under the old rules to make them fully comparable to data reported under the new rules. For this reason, we restrict our discussion here to the 2010 data. Return to text
32. Unlike the threshold rules used to report higher-priced loans, the threshold rules used to identify HOEPA loans did not change between 2009 and 2010, and thus the 2010 number of HOEPA loans is comparable to that of earlier years. The requirement to report HOEPA loans in the HMDA data relates to whether the loan is subject to the original protections of HOEPA, as determined by the coverage test in the Federal Reserve Board's Regulation Z, 12 C.F.R. pt. 226.32(a). The required reporting is not triggered by the more recently adopted protections for "higher-priced mortgage loans" under Regulation Z, notwithstanding that those protections were adopted under authority given to the Board by HOEPA. See 73 Fed. Reg. 44522 (July 30, 2008). Return to text
33. HOEPA does not apply to home-purchase loans. Return to text
34. See Board of Governors of the Federal Reserve System, "Senior Loan Officer Opinion Survey on Bank Lending Practices," webpage, www.federalreserve.gov/boarddocs/SnLoanSurvey. Return to text
35. See Federal Housing Finance Agency, "House Price Index," webpage, www.fhfa.gov/Default.aspx?Page=14. Elevated levels of unemployment and underemployment across much of the country have also likely damped refinancings, since reduced incomes and unstable employment make qualifying for loans more difficult. Return to text
36. For a more detailed discussion of why the Home Affordable Refinance Program may not have had more robust results thus far, see Elizabeth A. Duke (2011), "Rebalancing the Housing Market," speech delivered at the Federal Reserve Board Policy Forum "The Housing Market Going Forward: Lessons Learned from the Recent Crisis," Washington, September 1, www.federalreserve.gov/newsevents/speech/duke20110901a.htm. Return to text
37. The data are drawn using a methodology to ensure that the same individuals can be tracked over time, and that the data are representative of all individuals with a credit record as of the end of each quarter. For more information on these data, see Donghoon Lee and Wilbert van der Klaauw (2010), "An Introduction to the FRBNY Consumer Credit Panel," Federal Reserve Bank of New York Staff Reports 479 (New York: Federal Reserve Bank of New York, November). It is important to note that all individuals in the database are anonymous: Names, street addresses, and Social Security numbers have been suppressed. Individuals are distinguished and can be linked over time through a unique, anonymous consumer identification number assigned by Equifax. Return to text
38. This score is generated from the Equifax Risk Score 3.0 model. The Equifax Risk Score 3.0 is a credit score produced from a general-purpose risk model that predicts the likelihood an individual will become 90 days or more delinquent on any account within 24 months after the score is calculated. The Equifax Risk Score 3.0 ranges from 280 to 850, with a higher score corresponding to lower relative risk (for more information, see www.equifax.com ). An individual's credit score at the end of 2009 represents a reasonable metric of the score that would have been available to a lender that received an application for a refinancing during 2010. Return to text
39. Those consumers with relatively small balances are less likely to find it in their financial interest to refinance. Indeed, table 10 indicates that more than 97 percent of refinance loans in 2010 were for amounts in excess of $50,000. Return to text
40. Unfortunately, the credit bureau data lack information on the interest rate of the loan or the structure of the loan (for example, whether it is an adjustable- or fixed-rate mortgage). Thus, we cannot determine more precisely whether a given borrower has a strong financial incentive to refinance. For example, borrowers with adjustable-rate mortgages may be less inclined to refinance because they already enjoy the benefits of falling rates. Return to text
41. One could imagine comparing denial rates on refinance applications in the HMDA data across geographies and over time to gauge the difficulty of refinancing currently. However, as discussed later, changes over time in the composition of applicants as credit conditions change would likely confound such an analysis. Return to text
42. For example, instead of a refinance rate of 22.7 percent for 2008 borrowers in other states with a score between 720 and 819, such borrowers would have had a refinance rate of 28.9 percent. Similarly, instead of a refinance rate of 10 percent for 2005 borrowers in the steepest-decline states, they would have had a refinance rate of 22.5 percent. After adjusting the refinance rates for each cell in this manner, the counterfactual rate is then calculated as a weighted average of each cell, where the weights are given by the share of borrowers in each cell. Return to text
43. Analysis of the data suggests that of those with at least one closed-end mortgage with a balance above $50,000 at the end of 2009, about two-thirds had just that one mortgage, about 13 percent had two first-lien mortgages, and about 20 percent had a junior lien--either a closed-end mortgage or a HELOC with a positive balance. Of those with a junior lien, about two-thirds had a HELOC as opposed to a closed-end junior lien. Because of the data structure, it is difficult to estimate refinance rates for those who have a closed-end junior-lien loan. Also note that the bureau data do not identify junior-lien loans explicitly; instead, we assume that those with a HELOC and those with a second closed-end mortgage that is no more than 25 percent of the size of the other closed-end mortgage have a junior lien. Return to text
44. For the 2010 reporting year, 77.5 percent of the nonconventional first-lien owner-occupant home-purchase loans were FHA loans, 15.2 percent were VA guaranteed, and 7.3 percent were covered under the FSA or RHS programs. For nonconventional refinance loans, 79.2 percent were FHA, 20.3 percent VA, and 0.4 percent FSA or RHS. Return to text
45. For 2010, only the September data were used. Return to text
46. The home-improvement and non-owner-occupant loan categories are more heterogeneous than the other two. The home-improvement category may include some "cash-out" refinance loans, which would be treated as refinancings except that some of the funds are used for home improvements, as well as smaller new loans on homes that previously had no mortgage. The non-owner-occupant category presented here is heterogeneous by construction since it includes all types of loans. As a consequence of this heterogeneity, the disposition of liens in these two categories is likely more sensitive to market changes than that of liens in the refinance and home-purchase categories. Return to text
47. Fees were raised for mortgages with case numbers assigned (generally at the point of FHA application) after April 5, 2010. Most of the mortgages closing in April probably had case numbers assigned before the price rise. Return to text
48. The monthly mortgage payment used for the PTI ratio is estimated assuming all mortgages are fully amortizing 30-year fixed mortgages. If the loan pricing spread is reported in the HMDA data, the loan contract rate is assumed to be the same as the APR. Otherwise, it is assumed to be equal to the APOR plus 20 basis points prevailing at the loan's estimated lock date. Return to text
49. The incidence of a type of loan for a group can be calculated from the data in tables 14.A and 14.B by multiplying the number of loans of a given type (shown as memo items in the last rows of the tables) by the share attributable to a group and then dividing the result by the product of the total number of loans and the overall incidence for the group. For example, the incidence of nonconventional refinance lending for blacks in 2010 was (1,164,102 x 0.093) / (2,211,409 x 0.06) = 81.6 percent. Return to text
50. For counties in an MSA, the limit for the county with the highest median house price is used for all counties in the MSA. In 2006 and 2007, the national maximum for FHA single-family home loans was $271,050 in most areas of the country. VA loans do not have a size limit, but they do have a guarantee limit, which is tied to GSE loan limits. FSA loans are also subject to different, and generally higher, limits. Only LMI borrowers in rural areas are eligible for RHS loans, but the loans do not have an explicit maximum size limit. Return to text
51. New standards released on March 6, 2008, raised the limit for GSE one- to four-family home loans to 125 percent of the area median house price, subject to an overall limit of $729,750 for single-family homes in the continental United States (the limit could also not be lower than $417,000). FHA limits were also raised to 125 percent of the median house price prevailing in an area, subject to the same $729,750 national maximum for single-family homes applicable to the GSEs. Return to text
52. See Avery and others, "The 2008 HMDA Data." Return to text
53. U.S. Department of Housing and Urban Development (2011), "Potential Changes to FHA Single-Family Loan Limits beginning October 1, 2011 from Implementation of the Housing and Economic Recovery Act of 2008," market analysis brief, May 26, portal.hud.gov/hudportal/documents/huddoc?id=FHA_Loan_Limits_HERA.pdf. Return to text
54. Federal Housing Finance Agency (2011), "Possible Declines in Conforming Loan Limits," Mortgage Market Note 11-01, revised May 26, www.fhfa.gov/rss.aspx?page=77&id=0. Return to text
55. See Robert Dietz and Natalia Siniavskaia (2011), GSE and FHA Loan Limit Changes for 2011: Scope of Impact, Special Studies (Washington: National Association of Home Builders, June 1), www.nahb.org/reference_list.aspx?sectionID=734 . Return to text
56. A similar analysis was done using the 2009 HMDA data. See Josiah Madar and Mark A. Willis (forthcoming), "Why We Need to Pay Attention to the Upcoming FHA and GSE Loan Limit Reductions," working paper (New York: Furman Center for Real Estate and Urban Policy). Return to text
57. The effects of the limit changes (and the disappearance of the private secondary securities market) are evident in the substantial decline of the jumbo share of the mortgage market from 2007 to 2008. On the surface, it would appear that none of the jumbo market loans would have been eligible for the FHA/VA programs or for purchase by the GSEs. Yet in 2010, almost one-fourth of the home-purchase loans, and 16 percent of the refinance loans, exceeding the maximum GSE/FHA loan limits were reported in the HMDA data as nonconventional or sold to the GSEs. One explanation for this result is that the loans may be for two- to four-family homes, which have higher limits. Some are VA loans, which are not strictly subject to the limits but only to a limitation on the insurance guarantee (about 35 percent of jumbo nonconventional loans were VA loans, a percentage significantly higher than the overall share of VA nonconventional loans). Some may simply be reporting errors or have loan sizes very near the limits such that rounding errors may have led to their misclassification. This issue may be of particular concern for FHA loans--almost one-half of all 2010 FHA loans reported as exceeding the FHA loan limit had loan sizes within $10,000 of the limit. Return to text
58. See Paul A. Joice (2011), "Neighborhood Stabilization Program," U.S. Department of Housing and Urban Development, Cityscape: A Journal of Policy Development and Research, vol. 13 (1), pp. 135-41. Return to text
59. See, for example, Kai-yan Lee (2008), "Research Review: Spillover Effects of Foreclosures on Communities," Federal Reserve Bank of Boston, New England Community Developments, issue 2, pp. 10-12, www.bostonfed.org/commdev/necd/index.htm#2008. Estimates of spillover effects on surrounding properties are also in Center for Responsible Lending (2009), "Soaring Spillover: Accelerating Foreclosures to Cost Neighbors $502 Billion in 2009 Alone; 69.5 Million Homes Lose $7,200 on Average," May, www.responsiblelending.org/mortgage-lending/research-analysis/soaring-spillover-accelerating-foreclosures-to-cost-neighbors-436-billion-in-2009-alone-73-4-million-homes-lose-5-900-on-average.html. Return to text
60. The NSP is administered by HUD. Funds are distributed to acquire, repair, and resell foreclosed and abandoned properties. Since the creation of the program, additional funding has been provided in two subsequent laws: the American Recovery and Reinvestment Act of 2009 and the Dodd-Frank Wall Street Reform and Consumer Protection Act of 2010. Although each of the three laws has the same broad objective, the provisions of the laws differ in how the funds may be allocated. For more information about the NSP, see U.S. Department of Housing and Urban Development, "Neighborhood Stabilization Program Resource Exchange," webpage, http://hudnsphelp.info/index.cfm. Return to text
61. For more information, see Board of Governors of the Federal Reserve System, Federal Deposit Insurance Corporation, Office of the Comptroller of the Currency, and Office of Thrift Supervision (2010), "Agencies Expand Scope of Community Reinvestment Act Regulations to Encourage Support for HUD Neighborhood Stabilization Program Activities," joint press release, December 15, www.federalreserve.gov/newsevents/press/bcreg/20101215a.htm. For details on the proposed revision to the CRA, see Board of Governors of the Federal Reserve System, Federal Deposit Insurance Corporation, Office of the Comptroller of the Currency, and Office of Thrift Supervision (2010), "Agencies Propose to Expand Scope of Community Reinvestment Act Regulations to Encourage Depository Institution Support for HUD Neighborhood Stabilization Program Activities," joint press release, June 17, www.federalreserve.gov/newsevents/press/bcreg/20100617c.htm. Return to text
62. This finding differs with the conclusions of an analysis of lending in high-foreclosure neighborhoods conducted in a previous article (see Avery and others, "The 2009 HMDA Data"). That analysis suggested that the more-rapid declines in lending activity in high-foreclosure neighborhoods, compared with other neighborhoods, largely reflected geographic differences. Return to text
63. See Avery, Brevoort, and Canner, "The 2006 HMDA Data"; Avery, Brevoort, and Canner, "Higher-Priced Home Lending and the 2005 HMDA Data"; and Avery, Canner, and Cook, "New Information Reported under HMDA." Return to text
64. See, for example, Andrew Haughwout, Christopher Mayer, and Joseph Tracy (2009), Subprime Mortgage Pricing: The Impact of Race, Ethnicity, and Gender on the Cost of Borrowing, Staff Report 368 (New York: Federal Reserve Bank of New York, April); and Marsha J. Courchane (2007), "The Pricing of Home Mortgage Loans to Minority Borrowers: How Much of the APR Differential Can We Explain?" Journal of Real Estate Research, vol. 29 (4), pp. 399-439. Return to text
65. Excluded from the analysis are applicants residing outside the 50 states and the District of Columbia as well as applications deemed to be business related. Applicant gender is controlled for in the racial and ethnic analyses, and race and ethnicity are controlled for in the analyses of gender differences. Return to text
66. For purposes of presentation, the borrower- and lender-modified outcomes shown in the tables are normalized so that, for the base comparison group (non-Hispanic whites in the case of comparison by race and ethnicity and males in the case of comparison by sex), the mean at each modification level is the same as the gross mean. Return to text
67. Although results here are reported for nonconventional lending as a whole, the analysis controls for the specific type of government-backed loan program (FHA, VA, or FSA/RHS) used by the borrower or loan applicant. Return to text
68. See Avery and others, "The 2008 HMDA Data." Return to text
69. The Interagency Fair Lending Examination Procedures are available at www.ffiec.gov/PDF/fairlend.pdf. Return to text
70. The SAFE Act created the Nationwide Mortgage Licensing System and Registry, which will, among other things, assign unique identifying numbers to all residential mortgage originators employed by banking institutions, Farm Credit System institutions, and others, including mortgage companies and brokers. See Federal Financial Institutions Examination Council, "Secure and Fair Enforcement for Mortgage Licensing Act (S.A.F.E. Act) FAQs," webpage, www.ffiec.gov/safeact.htm. Return to text
71. See Federal Financial Institutions Examination Council, "New FFIEC Rate Spread Calculator," webpage, www.ffiec.gov/ratespread/NewBulkRateSpread.aspx. Return to text