
Dodd-Frank Act Stress Test 2016: Supervisory Stress Test Methodology and Results
 Print
PrintExecutive Summary
The Dodd-Frank Wall Street Reform and Consumer Protection Act (Dodd-Frank Act) requires the Federal Reserve to conduct an annual stress test of BHCs with $50 billion or more in total consolidated assets and any nonbank financial company that the FSOC has determined shall be supervised by the Board.3 The Board first adopted rules implementing this requirement in October 2012 and most recently modified these rules in December 2015.4
For this year's stress test cycle (DFAST 2016), which began January 1, 2016, the Federal Reserve conducted supervisory stress tests of 33 BHCs.
This report provides
- background on Dodd-Frank Act stress testing;
- details of the adverse and severely adverse supervisory scenarios used in DFAST 2016;
- an overview of the analytical framework and methods used to generate the Federal Reserve's projections, highlighting notable changes from last year's program; and
- the results of the supervisory stress tests under adverse and severely adverse scenarios for the BHCs that participated in the DFAST 2016 program, presented both in the aggregate and for individual institutions.
The adverse and severely adverse supervisory scenarios used in DFAST 2016 feature U.S. and global recessions. In particular, the severely adverse scenario is characterized by a severe global recession, accompanied by a period of heightened corporate financial stress and negative yields for short-term U.S. Treasury securities. The adverse scenario is characterized by weakening economic activity across all countries or country blocs included in the scenario, accompanied by a period of deflation in the United States and in the other countries and country blocs.
In conducting its supervisory stress tests, the Federal Reserve calculated its projections of a BHC's balance sheet, risk-weighted assets (RWAs), net income, and resulting regulatory capital ratios under these scenarios using data on BHCs' financial conditions and risk characteristics provided by the BHCs and a set of models developed or selected by the Federal Reserve. As compared to DFAST 2015, the Federal Reserve enhanced some of the supervisory models to improve model stability and incorporate greater precision in the calculation of capital. These changes are highlighted in box 1. Changes in supervisory stress test results from the prior year reflect a combination of changes in supervisory scenarios, BHCs' financial conditions and risk characteristics, and enhancements to supervisory models. A description of the effect of scenarios, new data, and model changes on the stress test results is included in box 2. Specific descriptions of the supervisory models and related assumptions can be found in appendix B.
The results of the DFAST 2016 projections suggest that, in the aggregate, the 33 BHCs would experience substantial losses under both the adverse and the severely adverse scenarios.
Over the nine quarters of the planning horizon, aggregate losses at the 33 BHCs under the severely adverse scenario are projected to be $526 billion. This includes losses across loan portfolios, losses from credit impairment on securities held in the BHCs' investment portfolios, trading and counterparty credit losses from a global market shock, and other losses. Projected aggregate net revenue before provisions for loan and lease losses (pre-provision net revenue, or PPNR) is $384 billion, and net income before taxes is projected to be -$195 billion.
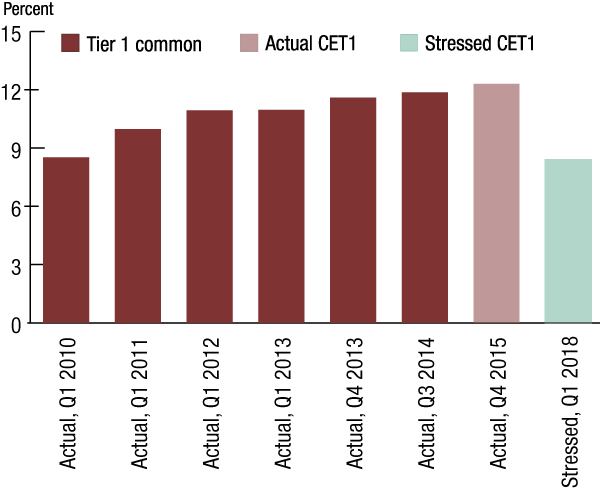
As illustrated in figure 1, in the severely adverse scenario, the aggregate Common Equity Tier 1 (CET1) capital ratio would fall from an actual 12.3 percent in the fourth quarter of 2015 to a post-stress level of 8.4 percent in the first quarter of 2018.
In the adverse scenario, aggregate projected losses, PPNR, and net income before taxes are $324 billion, $475 billion, and $142 billion, respectively. The aggregate CET1 capital ratio under the adverse scenario would fall 173 basis points to its minimum over the planning horizon of 10.5 percent in the first quarter of 2018.
Source: FR Y-9C, FR Y-14A, and supervisory estimates under the severely adverse scenario.
Details of the results are provided in the Supervisory Stress Test Results section of this report.
References
3. 12 USC 5365(i)(1). Return to text
4. See 12 CFR part 252, subpart E. Return to text
