
Dodd-Frank Act Stress Test 2016: Supervisory Stress Test Methodology and Results
 Print
PrintSupervisory Stress Test Results
This section describes the Federal Reserve's projections of RWAs, losses, revenues, expenses, and capital positions for the 33 BHCs participating in DFAST 2016 under the severely adverse and adverse scenarios. Results are presented both in the aggregate for the 33 BHCs and for individual BHCs. The aggregate results provide a sense of the stringency of the adverse and severely adverse scenario projections and the sensitivities of losses, revenues, and capital at these BHCs as a group to the stressed economic and financial market conditions contained in those scenarios. The range of results across individual BHCs reflects differences in business focus, asset composition, revenue and expense sources, and portfolio risk characteristics. The comprehensive results for individual BHCs are reported in appendix C.
Severely Adverse Scenario
In this Section:
Stressed Regulatory Capital Ratios and Risk-Weighted Assets
The projections suggest declines in capital ratios for all the BHCs under the severely adverse scenario. In the aggregate, each of the four capital ratios calculated in the fourth quarter of 2015 declines over the course of the planning horizon, with first-quarter 2018 levels ranging from 2.6 percentage points to 3.9 percentage points lower than at the start of the planning horizon (see table 2).30 Table 3 presents these ratios for each of the 33 BHCs.
The changes in post-stress capital ratios vary considerably across BHCs (see figure 10). The capital ratios for all firms decline for all firms over the course of the planning horizon. The post-stress capital ratios incorporate Federal Reserve projections of the levels of total average assets and RWAs over the planning horizon. Declines in capital ratios in part reflect an increase in projected RWAs over the planning horizon. The increase in RWAs reflects projected asset and loan growth in the scenario and the impact of the scenario's assumed increase in equity market volatility on market risk-weighted assets (MRWAs) at firms with large trading portfolios.
Projected Losses
The Federal Reserve projects that the 33 BHCs as a group would experience significant losses under the severely adverse scenario. In this scenario, losses are projected to be $526 billion for the 33 BHCs in the aggregate over the nine quarters of the planning horizon. These losses include
- $385 billion in accrual loan portfolio losses,
- $11 billion in OTTI and other realized securities losses,
- $113 billion in trading and/or counterparty losses at the eight BHCs with substantial trading, processing, or custodial operations, and
- $17 billion in additional losses from items such as loans booked under the fair-value option (see table 2).
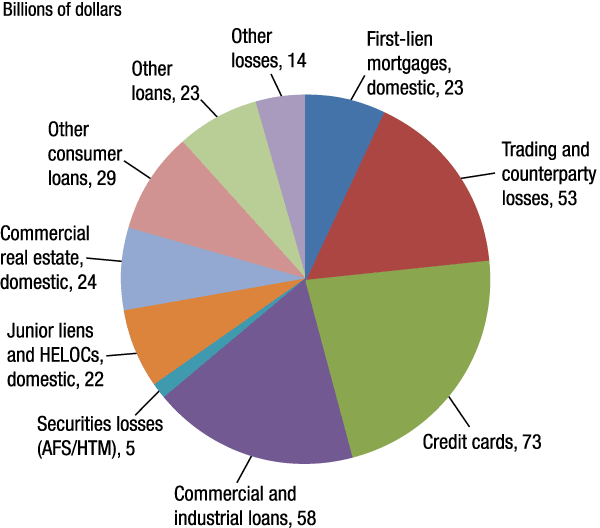
The biggest sources of loss are accrual loan portfolios and trading and counterparty positions subject to the global market shock and counterparty default component. Together, these account for 95 percent of the projected losses for the 33 BHCs (figure 9).
Note: Estimates are for the nine-quarter period from 2016:Q1-2018:Q1 as a percent of risk-weighted assets. (The text of this note has been changed from "average" assets to "risk-weighted" assets.)
Loan Losses
Projected losses on consumer-related lending--domestic residential mortgages, credit cards, and other consumer loans--represent 52 percent of projected loan losses and 38 percent of total projected losses for the 33 BHCs (see table 2). This is consistent with the severely adverse scenario, which features high unemployment rates and significant declines in housing prices. Losses on commercial and industrial loans are the single largest category of losses at $93 billion, representing 24 percent of total projected loan losses. This is followed by $92 billion in credit card loans and $70 billion of losses across domestic residential mortgage loans, including both first liens and junior liens/home equity lines of credit.
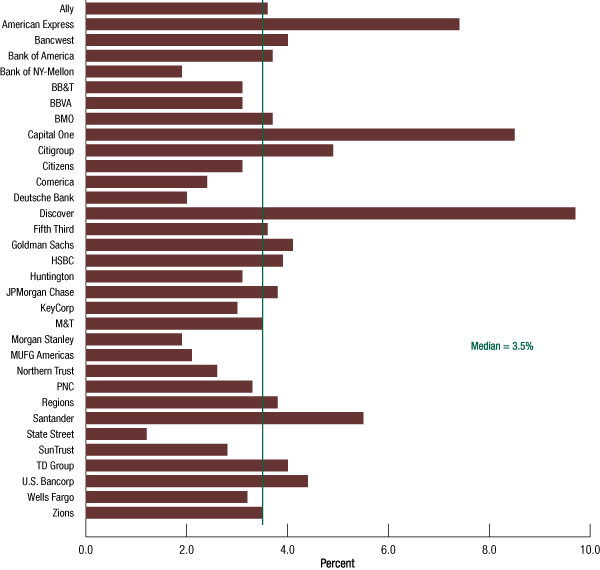
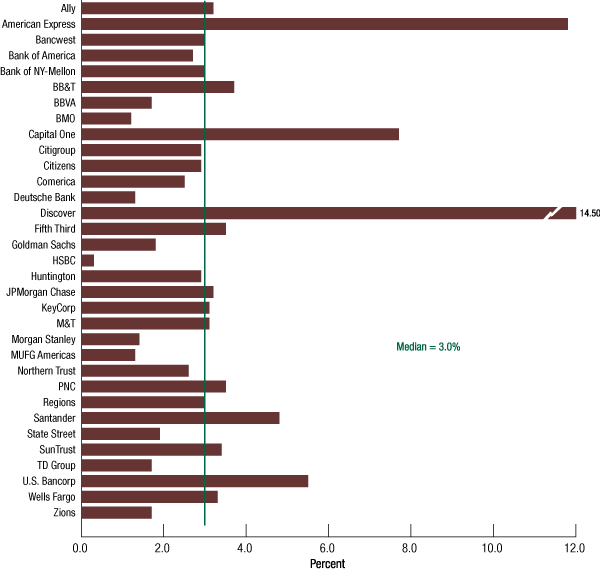
For the 33 BHCs as a group, the nine-quarter cumulative loss rate for all accrual loan portfolios is 6.1 percent, where the loss rate is calculated as total projected loan losses over the nine quarters of the planning horizon divided by average loan balances over the horizon. Total loan loss rates vary significantly across BHCs, ranging between 1.9 percent and 12.4 percent across these institutions (see table 6 and figure 11).
Note: Estimates are for nine quarter period from 2016:Q1-2018:Q1 as a percent of average balances.
The differences in total loan loss rates across the BHCs reflect differences in the risk characteristics of the portfolios held by each BHC with regard to both the type of lending of each portfolio and the loans within each portfolio. Loan portfolio composition matters because projected loss rates vary significantly by loan type. In the aggregate, nine-quarter cumulative loss rates vary between 3.2 percent on domestic first lien mortgages and 13.4 percent on credit cards, reflecting both differences in typical performance of these loans--some loan types tend to generate higher losses, though generally also higher revenue--and differences in the sensitivity of different types of lending to the severely adverse scenario. In particular, lending categories for which performance is sensitive to unemployment rates or housing prices may experience high stressed loss rates due to the considerable stress on these factors in the severely adverse scenario.
Projected loss rates on most loan categories show similar dispersion across BHCs (see table 6 and figures D.1 through D.7).31 There are significant differences across BHCs in the projected loan loss rates for similar types of loans. For example, while the median projected loss rate on commercial real estate loans is 6.8 percent, the rates among BHCs with commercial real estate portfolios vary from a low of 3.1 percent to a high of 22.9 percent. For commercial and industrial loans, the range of projected loss rates is from 2.6 percent to 15.5 percent, with a median of 5.5 percent.
Differences in projected loss rates across BHCs primarily reflect differences in loan and borrower characteristics. In addition, some BHCs have taken write-downs on portfolios of impaired loans either purchased or acquired through mergers. Losses on these loans are projected using the same loss models used for loans of the same type, and the resulting loss projections are reduced by the amount of such write-downs. For these BHCs, projected loss rates will be lower than for BHCs that hold similar loans that have not been subject to purchase-related write-downs.
Box 2. Explanation of Changes in Results
Year-over-year changes in supervisory stress test results are reflective of several factors:
- changes in BHCs' starting capital positions;
- portfolio composition and risk characteristics;
- changing hypothetical scenarios; and
- model changes.
These factors can have positive or negative effects on the resulting post-stress capital ratios.
In the aggregate, DFAST firms have stronger balance sheets this year compared to DFAST 2015. They have increased the dollar amount of their capital, improved the credit quality of some of their material loan portfolios, and reduced illiquid securitization exposures on their trading book. In addition, mortgage-related litigation and settlements, which negatively affected some firms' earnings in the past, 1 have been significantly resolved as a result of recent settlements and court rulings on private-label mortgage securities.2
Last year's severely adverse scenario assumed that corporate credit quality worsened even more than what would be expected in a severe recession. The assumption amplified the widening of corporate bond spreads, decline in equity prices, and increase in equity price volatility. By comparison, this year's severely adverse scenario includes a more severe recession than last year's scenario and also features negative short-term interest rates, which moderate the decline in equity prices and increase in market volatility relative to last year. Collectively, the change in the scenario tended to increase projections of net income in the aggregate, but its effects varied across DFAST firms. As compared to last year's severely adverse scenario, firms that are active in trading and market activities saw smaller losses in net income as a result of less severe stress in the equity markets, but firms more focused on traditional lending activities were more affected by negative short-term interest rates and greater stress in the real economy.
As in the past, the Federal Reserve made a number of enhancements in the models used for the supervisory stress test this year. Most model changes this year were incremental, but the Federal Reserve made more notable changes in three models--namely, the operational risk model, MRWA model, and capital calculation. These changes had moderate effects on the aggregate results but had varied effects on individual firms as described in box 1.
1. Aggregate projected losses from operational risk events, expenses relating to mortgage put-backs, and expenses relating to the disposition of other real estate owned averaged more than $130 billion over the last three DFAST cycles. This year, the aggregated projected losses from the same items totaled less than $100 billion. Return to text
2. ACE Securities Corp v. DB Structured Products, Inc., 25 N.Y. 3d 581 (2015). Return to text
Losses on Trading, Private Equity, SFT, and Derivatives Positions
The severely adverse scenario results include $113 billion in trading losses from the global market shock at the six BHCs with large trading and private-equity exposures and losses from the counterparty default component at the eight BHCs with substantial trading, processing, or custodial operations. Trading and counterparty losses range between $1.5 billion and $33 billion across the eight BHCs (see table 4), with the largest losses at those BHCs that were subject to both the global market shock and the counterparty default component. Even so, the relative size of losses across firms depends not on nominal portfolio size but rather on the specific risk characteristics of each BHC's trading positions, inclusive of hedges. Importantly, these projected losses are based on the trading positions and counterparty exposures held by these firms on a single date (January 4, 2016) and could have differed if they had been based on a different date.
Projected Pre-provision Net Revenue and Net Income
In the aggregate, the 33 BHCs are projected to generate $384 billion in PPNR cumulatively over the nine quarters of the planning horizon, equal to 2.5 percent of their combined average assets (see table 2). PPNR projections reflect low levels of net interest income because of the effect of negative short-term interest rates throughout the severely adverse scenario. The results also reflect low levels of noninterest income, consistent with the falling asset prices, rising equity market volatility, and sharply contracting economic activity in the severely adverse scenario. In addition, the PPNR projections incorporate expenses stemming from estimates of elevated levels of losses from operational-risk events such as fraud, employee lawsuits, litigation-related expenses, or computer system or other operating disruptions, and expenses related to put-backs of mortgages netted against actual mortgage put-back reserves reported by the BHCs.32
The ratio of projected cumulative PPNR to average assets varies across BHCs (see figure 12). A significant portion of this variation reflects differences in business focus across the institutions. For instance, the ratio of PPNR to assets tends to be higher at BHCs focusing on credit card lending, reflecting the higher net interest income that credit cards generally produce relative to other forms of lending.33 Importantly, lower PPNR rates do not necessarily imply lower net income, since the same business focus and revenue risk characteristics determining differences in PPNR across firms could also result in offsetting differences in projected losses across BHCs.
Note: Estimates are for the nine-quarter period from 2016:Q1-2018:Q1 as a percent of average assets.
Projected PPNR and losses are the primary determinants of projected pre-tax net income.Table 4 presents projections of the components of pre-tax net income, including provisions into the ALLL and one-time income and expense and extraordinary items, under the severely adverse scenario for each of the 33 BHCs (see table 2 for aggregate). The projections are cumulative for the nine quarters of the planning horizon.
Of note, following U.S. GAAP, the net income projections incorporate loan losses indirectly through provisions, which equal projected loan losses plus the amount needed for the ALLL to be at an appropriate level at the end of each quarter. The $439 billion in total provisions includes $385 billion in net charge-offs, with the remainder being the reserve build. These amounts are cumulative over the planning horizon and mask variation in the ALLL during the course of the nine quarters. Specifically, the projected ALLL increases during the early quarters of the planning horizon, given the increased economic stress in the severely adverse scenario, and then declines as the economic stress abates.
The Federal Reserve's projections of pre-tax net income under the severely adverse scenario imply negative net income at most of the 33 BHCs individually and for the BHCs as a group over the nine-quarter planning horizon. Projected net income before taxes (pre-tax net income) is an aggregate net loss of $195 billion over the planning horizon for the 33 BHCs.
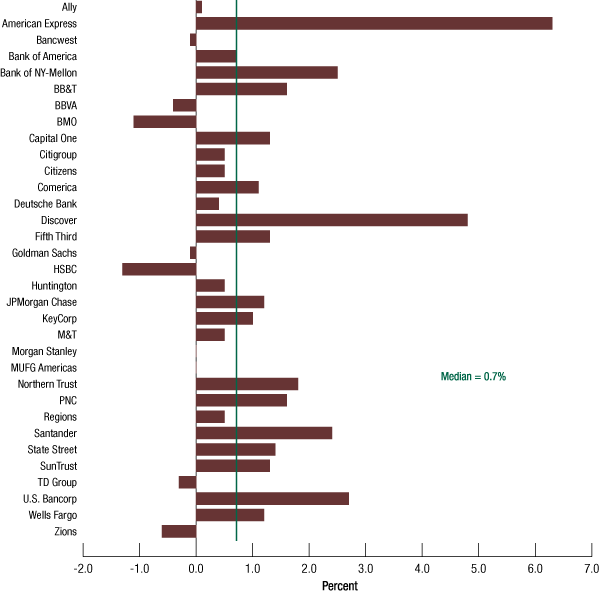
The ratio of pre-tax net income to average assets for each of the 33 BHCs ranges between -3.7 percent and 3.7 percent (see figure 13). Projected cumulative net income for most of the BHCs (28 of 33) is negative over the planning horizon. Differences across the firms reflect differences in the sensitivity of the various components of net income to the economic and financial market conditions in the supervisory scenarios. Projected net income for the eight BHCs subject to the global market shock and/or the counterparty default component includes the effect of those additional scenario components in the adverse and severely adverse scenarios, introducing some additional variation in projected net income between these eight BHCs and the other firms participating in DFAST 2016.
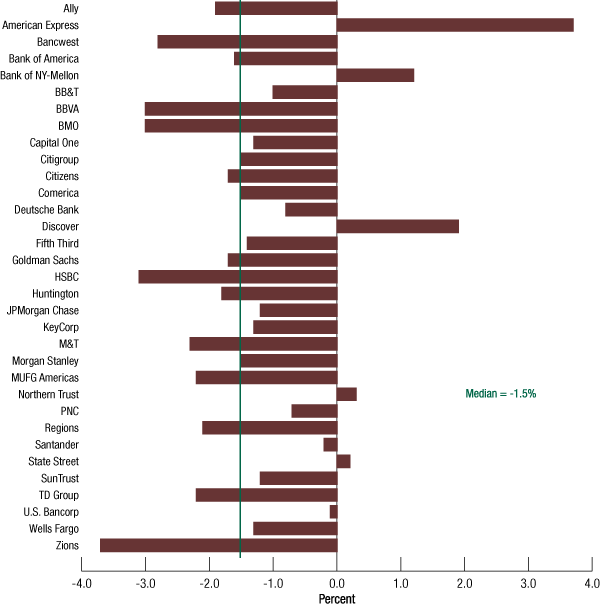
Note: Estimates are for the nine-quarter period from 2016:Q1-2018:Q1 as a percent of average assets.
Final capital ratios for advanced approaches firms and other BHCs that opt into advanced approaches treatment for AOCI are also impacted by OCI (table 4), which is driven by unrealized gains and losses on securities in the supervisory stress test. Negative Treasury yields, which persists throughout the projection horizon in the severely adverse scenario, resulted in unrealized gains on securities for most of the affected BHCs over the planning horizon.
Table 2. 33 participating bank holding companies
Projected stressed capital ratios, risk-weighted assets, losses, revenues, net income before taxes, and loan losses
Federal Reserve estimates: Severely adverse scenario
| Regulatory ratio | Actual 2015:Q4 | Stressed capital ratios1 | |
|---|---|---|---|
| Ending | Minimum | ||
| Common equity tier 1 capital ratio | 12.3 | 8.4 | 8.4 |
| Tier 1 capital ratio | 13.5 | 9.8 | 9.8 |
| Total capital ratio | 16.2 | 12.3 | 12.3 |
| Tier 1 leverage ratio | 9.2 | 6.7 | 6.7 |
Note: In accordance with the regulatory capital framework, all risk-based capital ratios are now calculated using standardized RWAs, which became effective on January 1, 2015. The transition had a one-time effect of reducing risk-based capital ratios in first quarter 2015. However, the aggregate common equity capital ratio of the 33 firms increased by 70 basis points between the first quarter of 2015 and the fourth quarter of 2015.
1. The capital ratios are calculated using capital action assumptions provided within the Dodd-Frank Act stress testing rule. See 12 CFR 252.56(b). These projections represent hypothetical estimates that involve an economic outcome that is more adverse than expected. The minimum capital ratio presented is for the period 2016:Q1 to 2018:Q1. Return to table
| Loan type | Billions of dollars | Portfolio loss rates (percent)1 |
|---|---|---|
| Loan losses | 384.9 | 6.1 |
| First-lien mortgages, domestic | 38.1 | 3.2 |
| Junior liens and HELOCs, domestic | 32.2 | 8.1 |
| Commercial and industrial2 | 93.1 | 6.3 |
| Commercial real estate, domestic | 51.9 | 7.0 |
| Credit cards | 92.3 | 13.4 |
| Other consumer3 | 37.9 | 5.7 |
| Other loans4 | 39.3 | 3.4 |
1. Average loan balances used to calculate portfolio loss rates exclude loans held for sale and loans held for investment under the fair-value option, and are calculated over nine quarters. Return to table
2. Commercial and industrial loans include small- and medium-enterprise loans and corporate cards. Return to table
3. Other consumer loans include student loans and automobile loans. Return to table
4. Other loans include international real estate loans. Return to table
| Item | Actual 2015:Q4 | Projected 2018:Q1 |
|---|---|---|
| Risk-weighted assets1 | 9,595.1 | 10,518.2 |
1. For each quarter, risk-weighted assets are calculated under the Board's standardized capital risk-based approach in 12 CFR part 217, subpart D. Return to table
| Item | Billions of dollars | Percent of average assets1 |
|---|---|---|
| Pre-provision net revenue2 | 383.6 | 2.5 |
| Other revenue3 | 1.6 | |
| less | ||
| Provisions | 438.6 | |
| Realized losses/gains on securities (AFS/HTM) | 11.3 | |
| Trading and counterparty losses4 | 113.0 | |
| Other losses/gains5 | 17.3 | |
| equals | ||
| Net income before taxes | -195.0 | -1.3 |
| Memo items | ||
| Other comprehensive income6 | 13.6 | |
| Other effects on capital | Actual 2015:Q4 | 2018:Q1 |
| AOCI included in capital (billions of dollars)7 | -37.0 | -32.2 |
1. Average assets is the nine-quarter average of total assets. Return to table
2. Pre-provision net revenue includes losses from operational-risk events, mortgage repurchase expenses, and other real estate owned (OREO) costs. Return to table
3. Other revenue includes one-time income and (expense) items not included in pre-provision net revenue. Return to table
4. Trading and counterparty losses include mark-to-market and credit valuation adjustments (CVA) losses and losses arising from the counterparty default scenario component applied to derivatives, securities lending, and repurchase agreement activities. Return to table
5. Other losses/gains includes projected change in fair value of loans held for sale and loans held for investment measured under the fair-value option, and goodwill impairment losses. Return to table
6. Other comprehensive income (OCI) is only calculated for advanced approaches BHCs, and other BHCs that opt into the advanced approaches treatment of AOCI. Return to table
7. Certain aspects of AOCI are subject to transition arrangements for inclusion in projected regulatory capital. The transition arrangements are 40 percent included in projected regulatory capital for 2015, 60 percent included in projected regulatory capital for 2016, 80 percent included in projected regulatory capital for 2017, and 100 percent included in projected regulatory capital for 2018. See 12 CFR 217.300(b)(3). Return to table
| Bank holding company | Common equity tier 1 capital ratio |
Tier 1 capital ratio | Total capital ratio | Tier 1 leverage ratio | ||||||||
|---|---|---|---|---|---|---|---|---|---|---|---|---|
| Actual 2015:Q4 | Ending | Minimum | Actual 2015:Q4 | Ending | Minimum | Actual 2015:Q4 | Ending | Minimum | Actual 2015:Q4 | Ending | Minimum | |
| Ally Financial Inc. | 9.2 | 6.1 | 6.1 | 11.1 | 8.3 | 8.3 | 12.5 | 10.0 | 10.0 | 9.7 | 7.2 | 7.2 |
| American Express Company | 12.4 | 12.3 | 11.4 | 13.5 | 13.4 | 12.6 | 15.2 | 15.1 | 14.3 | 11.7 | 10.9 | 10.9 |
| BancWest Corporation | 12.3 | 8.6 | 8.6 | 12.3 | 8.6 | 8.6 | 14.6 | 11.0 | 11.0 | 10.1 | 7.0 | 7.0 |
| Bank of America Corporation | 11.6 | 8.1 | 8.1 | 12.9 | 9.6 | 9.6 | 15.7 | 12.5 | 12.5 | 8.6 | 6.4 | 6.4 |
| The Bank of New York Mellon Corporation | 11.5 | 11.2 | 10.5 | 13.1 | 13.1 | 12.2 | 13.5 | 13.6 | 12.7 | 6.0 | 5.9 | 5.5 |
| BB&T Corporation | 10.3 | 6.9 | 6.9 | 11.8 | 8.5 | 8.5 | 14.3 | 10.9 | 10.9 | 9.8 | 7.0 | 7.0 |
| BBVA Compass Bancshares, Inc. | 10.7 | 6.5 | 6.5 | 11.1 | 6.8 | 6.8 | 13.7 | 9.3 | 9.3 | 9.0 | 5.4 | 5.4 |
| BMO Financial Corp. | 11.9 | 5.9 | 5.9 | 11.9 | 6.4 | 6.4 | 14.9 | 8.7 | 8.7 | 9.3 | 4.9 | 4.9 |
| Capital One Financial Corporation | 11.1 | 8.2 | 8.2 | 12.4 | 9.4 | 9.4 | 14.6 | 11.4 | 11.4 | 10.6 | 8.0 | 8.0 |
| Citigroup Inc. | 15.3 | 9.2 | 9.2 | 15.5 | 10.5 | 10.3 | 18.5 | 13.5 | 13.4 | 10.2 | 7.0 | 6.9 |
| Citizens Financial Group, Inc. | 11.7 | 8.8 | 8.8 | 12.0 | 9.0 | 9.0 | 15.3 | 12.3 | 12.3 | 10.5 | 7.8 | 7.8 |
| Comerica Incorporated | 10.5 | 8.3 | 8.3 | 10.5 | 8.3 | 8.3 | 12.7 | 10.2 | 10.2 | 10.2 | 7.9 | 7.9 |
| Deutsche Bank Trust Corporation | 34.1 | 30.1 | 30.1 | 34.1 | 30.1 | 30.1 | 34.3 | 31.2 | 31.2 | 13.9 | 12.2 | 12.2 |
| Discover Financial Services | 13.9 | 12.4 | 11.9 | 14.7 | 13.1 | 12.6 | 16.5 | 14.5 | 14.1 | 12.9 | 11.4 | 11.3 |
| Fifth Third Bancorp | 9.8 | 6.8 | 6.8 | 10.9 | 7.8 | 7.8 | 14.1 | 11.1 | 11.1 | 9.5 | 6.8 | 6.8 |
| The Goldman Sachs Group, Inc. | 13.6 | 10.2 | 8.4 | 15.6 | 11.5 | 9.8 | 18.7 | 14.3 | 12.6 | 9.3 | 6.9 | 6.3 |
| HSBC North America Holdings Inc. | 15.7 | 9.1 | 9.1 | 17.3 | 11.0 | 11.0 | 22.6 | 15.2 | 15.2 | 10.0 | 6.2 | 6.2 |
| Huntington Bancshares Incorporated | 9.8 | 5.0 | 5.0 | 10.5 | 6.3 | 6.3 | 12.6 | 8.6 | 8.6 | 8.8 | 5.0 | 5.0 |
| JPMorgan Chase & Co. | 12.0 | 8.3 | 8.3 | 13.7 | 9.9 | 9.9 | 16.0 | 12.1 | 12.1 | 8.5 | 6.2 | 6.2 |
| KeyCorp | 10.9 | 6.4 | 6.4 | 11.4 | 6.8 | 6.8 | 13.0 | 8.9 | 8.9 | 10.7 | 6.0 | 6.0 |
| M&T Bank Corporation | 11.1 | 6.9 | 6.9 | 12.7 | 8.2 | 8.2 | 14.9 | 10.3 | 10.3 | 10.9 | 6.9 | 6.9 |
| Morgan Stanley | 16.4 | 10.0 | 9.1 | 18.4 | 11.6 | 10.2 | 22.0 | 14.6 | 13.5 | 8.3 | 5.4 | 4.9 |
| MUFG Americas Holdings Corporation | 13.6 | 10.1 | 10.1 | 13.6 | 10.1 | 10.1 | 15.6 | 12.2 | 12.2 | 11.4 | 7.0 | 7.0 |
| Northern Trust Corporation | 10.8 | 9.6 | 9.6 | 11.4 | 10.1 | 10.1 | 13.2 | 11.9 | 11.9 | 7.5 | 6.5 | 6.5 |
| The PNC Financial Services Group, Inc. | 10.6 | 7.6 | 7.6 | 12.0 | 8.7 | 8.7 | 14.6 | 11.0 | 11.0 | 10.2 | 7.4 | 7.4 |
| Regions Financial Corporation | 10.9 | 7.3 | 7.3 | 11.7 | 7.9 | 7.9 | 13.9 | 10.0 | 10.0 | 10.3 | 6.9 | 6.9 |
| Santander Holdings USA, Inc. | 12.0 | 11.8 | 11.8 | 13.5 | 12.7 | 12.7 | 15.3 | 14.2 | 14.2 | 11.6 | 10.0 | 10.0 |
| State Street Corporation | 13.0 | 9.6 | 9.6 | 15.9 | 12.8 | 12.8 | 18.2 | 14.7 | 14.7 | 6.9 | 5.4 | 5.4 |
| SunTrust Banks, Inc. | 10.0 | 7.5 | 7.5 | 10.8 | 8.2 | 8.2 | 12.5 | 9.9 | 9.9 | 9.7 | 7.4 | 7.4 |
| TD Group US Holdings LLC | 13.1 | 8.4 | 8.4 | 13.2 | 8.4 | 8.4 | 14.3 | 9.8 | 9.8 | 8.3 | 5.0 | 5.0 |
| U.S. Bancorp | 9.6 | 7.5 | 7.5 | 11.3 | 8.9 | 8.9 | 13.3 | 10.8 | 10.8 | 9.5 | 7.6 | 7.6 |
| Wells Fargo & Company | 11.1 | 7.2 | 7.2 | 12.6 | 8.7 | 8.7 | 15.8 | 11.7 | 11.7 | 9.4 | 6.6 | 6.6 |
| Zions Bancorporation | 12.2 | 6.6 | 6.6 | 14.1 | 8.3 | 8.3 | 16.1 | 10.1 | 10.1 | 11.3 | 6.5 | 6.5 |
| 33 participating bank holding companies | 12.3 | 8.4 | 8.4 | 13.5 | 9.8 | 9.8 | 16.2 | 12.3 | 12.3 | 9.2 | 6.7 | 6.7 |
Note: The capital ratios are calculated using capital action assumptions provided within the Dodd-Frank Act stress testing rule. See 12 CFR 252.56(b). These projections represent hypothetical estimates that involve an economic outcome that is more adverse than expected. The minimum capital ratio presented is for the period 2016:Q1 to 2018:Q1.
In accordance with the regulatory capital framework, all risk-based capital ratios are now calculated using standardized RWAs, which became effective on January 1, 2015. The transition had a one-time effect of reducing risk-based capital ratios in first quarter 2015. However, the aggregate common equity capital ratio of the 33 firms increased by 70 basis points between the first quarter of 2015 and the fourth quarter of 2015.
| Bank holding company | Sum of revenues | Minus sum of provisions and losses | Equals | Memo items | Other effects on capital | ||||
|---|---|---|---|---|---|---|---|---|---|
| Pre-provision net revenue1 | Other revenue 2 |
Provisions | Realized losses/gains on securities (AFS/HTM) | Trading and counterparty losses3 | Other losses/ gains4 |
Net income before taxes |
Other compre- hensive income5 |
AOCI included in capital6 (2018:Q1) |
|
| Ally Financial Inc. | 4.8 | 0.0 | 7.4 | 0.5 | 0.0 | 0.0 | -3.2 | 0.0 | 0.0 |
| American Express Company | 19.2 | 1.3 | 13.9 | 0.0 | 0.0 | 0.4 | 6.2 | 0.0 | -2.5 |
| BancWest Corporation | 2.7 | 0.0 | 5.5 | 0.0 | 0.0 | 0.0 | -2.8 | 0.0 | 0.0 |
| Bank of America Corporation | 45.7 | 0.0 | 59.2 | 0.7 | 20.0 | 2.2 | -36.3 | 8.5 | 3.9 |
| The Bank of New York Mellon Corporation | 9.2 | 0.0 | 2.6 | 0.1 | 1.5 | 0.0 | 4.9 | 0.8 | -1.8 |
| BB&T Corporation | 7.0 | 0.0 | 9.1 | 0.0 | 0.0 | 0.0 | -2.2 | 0.0 | 0.0 |
| BBVA Compass Bancshares, Inc. | 1.1 | 0.0 | 3.8 | 0.0 | 0.0 | 0.0 | -2.8 | 0.0 | 0.0 |
| BMO Financial Corp. | 0.9 | 0.0 | 4.9 | 0.0 | 0.0 | 0.0 | -3.9 | 0.0 | 0.0 |
| Capital One Financial Corporation | 26.0 | 0.0 | 30.4 | 0.0 | 0.0 | 0.1 | -4.6 | 0.5 | -0.3 |
| Citigroup Inc. | 43.7 | 0.3 | 50.1 | 1.6 | 16.8 | 3.0 | -27.6 | 2.6 | -26.2 |
| Citizens Financial Group, Inc. | 3.4 | 0.0 | 5.7 | 0.1 | 0.0 | 0.1 | -2.5 | 0.0 | 0.0 |
| Comerica Incorporated | 1.3 | 0.0 | 2.4 | 0.0 | 0.0 | 0.0 | -1.1 | 0.0 | 0.0 |
| Deutsche Bank Trust Corporation | 0.5 | 0.0 | 1.0 | 0.0 | 0.0 | 0.0 | -0.4 | 0.0 | 0.0 |
| Discover Financial Services | 13.0 | 0.0 | 11.3 | 0.0 | 0.0 | 0.0 | 1.7 | 0.0 | 0.0 |
| Fifth Third Bancorp | 4.0 | 0.0 | 6.0 | 0.0 | 0.0 | 0.0 | -2.1 | 0.0 | 0.0 |
| The Goldman Sachs Group, Inc. | 12.1 | 0.0 | 5.7 | 0.0 | 18.0 | 3.9 | -15.4 | 0.0 | -0.7 |
| HSBC North America Holdings Inc. | -1.2 | 0.0 | 5.8 | 0.0 | 0.0 | 1.7 | -8.8 | 2.0 | 1.1 |
| Huntington Bancshares Incorporated | 2.2 | 0.0 | 3.7 | 0.1 | 0.0 | 0.0 | -1.6 | 0.0 | 0.0 |
| JPMorgan Chase & Co. | 64.9 | 0.0 | 60.2 | 2.1 | 32.6 | 0.5 | -30.5 | -3.0 | -2.7 |
| KeyCorp | 3.1 | 0.0 | 4.7 | 0.0 | 0.0 | 0.0 | -1.7 | 0.0 | 0.0 |
| M&T Bank Corporation | 3.1 | 0.0 | 6.1 | 0.0 | 0.0 | 0.0 | -2.9 | 0.0 | 0.0 |
| Morgan Stanley | 7.8 | 0.0 | 4.3 | 0.1 | 13.0 | 3.0 | -12.5 | 1.1 | -0.5 |
| MUFG Americas Holdings Corporation | 1.2 | 0.0 | 4.0 | 0.4 | 0.0 | 0.1 | -3.3 | 0.0 | 0.0 |
| Northern Trust Corporation | 2.4 | 0.0 | 2.0 | 0.0 | 0.0 | 0.0 | 0.4 | 0.3 | -0.1 |
| The PNC Financial Services Group, Inc. | 10.8 | 0.0 | 13.0 | 0.2 | 0.0 | 0.2 | -2.6 | 0.7 | 0.4 |
| Regions Financial Corporation | 3.1 | 0.0 | 5.8 | 0.0 | 0.0 | 0.0 | -2.8 | 0.0 | 0.0 |
| Santander Holdings USA, Inc. | 6.3 | 0.0 | 6.3 | 0.1 | 0.0 | 0.1 | -0.2 | 0.0 | 0.0 |
| State Street Corporation | 2.9 | 0.0 | 0.4 | 0.4 | 1.5 | 0.0 | 0.6 | -0.2 | -1.6 |
| SunTrust Banks, Inc. | 5.1 | 0.0 | 7.1 | 0.0 | 0.0 | 0.4 | -2.4 | 0.0 | 0.0 |
| TD Group US Holdings LLC | 4.3 | 0.0 | 11.1 | 0.1 | 0.0 | 0.0 | -6.9 | -0.2 | -0.2 |
| U.S. Bancorp | 21.4 | 0.0 | 21.5 | 0.0 | 0.0 | 0.0 | -0.2 | 1.1 | 0.2 |
| Wells Fargo & Company | 51.0 | 0.0 | 60.5 | 4.6 | 9.7 | 1.4 | -25.2 | -0.7 | -1.0 |
| Zions Bancorporation | 0.7 | 0.0 | 3.0 | 0.0 | 0.0 | 0.0 | -2.3 | 0.0 | 0.0 |
| 33 participating bank holding companies | 383.6 | 1.6 | 438.6 | 11.3 | 113.0 | 17.3 | -195.0 | 13.6 | -32.2 |
Note: These projections represent hypothetical estimates that involve an economic outcome that is more adverse than expected. Estimates may not sum precisely due to rounding.
1. Pre-provision net revenue includes losses from operational-risk events, mortgage repurchase expenses, and other real estate owned costs. Return to table
2. Other revenue includes one-time income and (expense) items not included in pre-provision net revenue. Return to table
3. Trading and counterparty losses include mark-to-market and credit valuation adjustments losses and losses arising from the counterparty default scenario component applied to derivatives, securities lending, and repurchase agreement activities. Return to table
4. Other losses/gains includes projected change in fair value of loans held for sale and loans held for investment measured under the fair-value option, and goodwill impairment losses. Return to table
5. Other comprehensive income is only calculated for advanced approaches BHCs and other BHCs that opt into advanced approaches treatment for AOCI. Return to table
6. Certain aspects of AOCI are subject to transition arrangements for inclusion in projected regulatory capital. Those transitions are 40 percent included in projected regulatory capital for 2015, 60 percent included in projected regulatory capital for 2016, 80 percent included in projected regulatory capital for 2017, and 100 percent included in projected regulatory capital for 2018. See 12 CFR 217.300(b)(3). Return to table
| Bank holding company | Loan losses |
First lien mortgages, domestic |
Junior liens and HELOCs, domestic |
Commercial and industrial |
Commercial real estate, domestic1 |
Credit cards |
Other consumer2 |
Other loans3 |
|---|---|---|---|---|---|---|---|---|
| Ally Financial Inc. | 6.1 | 0.3 | 0.2 | 1.9 | 0.1 | 0.0 | 3.7 | 0.0 |
| American Express Company | 10.6 | 0.0 | 0.0 | 3.6 | 0.0 | 6.8 | 0.0 | 0.2 |
| BancWest Corporation | 4.5 | 0.4 | 0.2 | 1.4 | 1.2 | 0.1 | 0.9 | 0.4 |
| Bank of America Corporation | 53.7 | 7.5 | 10.1 | 11.9 | 5.7 | 11.9 | 1.8 | 4.8 |
| The Bank of New York Mellon Corporation | 2.1 | 0.2 | 0.0 | 0.1 | 0.2 | 0.0 | 0.3 | 1.3 |
| BB&T Corporation | 7.7 | 1.1 | 0.3 | 1.2 | 3.0 | 0.3 | 1.3 | 0.6 |
| BBVA Compass Bancshares, Inc. | 3.4 | 0.6 | 0.2 | 1.1 | 1.1 | 0.1 | 0.2 | 0.1 |
| BMO Financial Corp. | 4.0 | 0.3 | 0.5 | 1.8 | 0.6 | 0.0 | 0.1 | 0.6 |
| Capital One Financial Corporation | 26.7 | 0.3 | 0.1 | 2.7 | 1.3 | 18.0 | 3.5 | 0.7 |
| Citigroup Inc. | 45.8 | 2.2 | 2.3 | 8.8 | 1.2 | 21.1 | 3.6 | 6.5 |
| Citizens Financial Group, Inc. | 5.0 | 0.4 | 1.1 | 1.4 | 0.8 | 0.2 | 0.9 | 0.2 |
| Comerica Incorporated | 2.3 | 0.1 | 0.1 | 1.0 | 0.6 | 0.0 | 0.1 | 0.4 |
| Deutsche Bank Trust Corporation | 0.8 | 0.1 | 0.0 | 0.2 | 0.3 | 0.0 | 0.0 | 0.2 |
| Discover Financial Services | 9.3 | 0.0 | 0.0 | 0.0 | 0.0 | 7.6 | 1.6 | 0.0 |
| Fifth Third Bancorp | 5.5 | 0.6 | 0.4 | 2.1 | 1.3 | 0.4 | 0.4 | 0.3 |
| The Goldman Sachs Group, Inc. | 4.8 | 0.4 | 0.0 | 2.0 | 0.3 | 0.0 | 0.1 | 2.1 |
| HSBC North America Holdings Inc. | 5.4 | 2.1 | 0.6 | 1.5 | 0.7 | 0.1 | 0.0 | 0.5 |
| Huntington Bancshares Incorporated | 3.1 | 0.3 | 0.3 | 0.9 | 0.7 | 0.1 | 0.5 | 0.2 |
| JPMorgan Chase & Co. | 53.4 | 5.4 | 5.4 | 13.7 | 4.5 | 13.9 | 2.5 | 8.0 |
| KeyCorp | 4.1 | 0.3 | 0.4 | 1.4 | 0.9 | 0.1 | 0.5 | 0.4 |
| M&T Bank Corporation | 5.2 | 1.5 | 0.4 | 0.7 | 2.1 | 0.1 | 0.4 | 0.1 |
| Morgan Stanley | 3.3 | 0.4 | 0.0 | 1.1 | 0.5 | 0.0 | 0.2 | 1.2 |
| MUFG Americas Holdings Corporation | 3.4 | 0.6 | 0.1 | 1.2 | 0.9 | 0.0 | 0.1 | 0.4 |
| Northern Trust Corporation | 1.6 | 0.2 | 0.2 | 0.3 | 0.3 | 0.0 | 0.0 | 0.6 |
| The PNC Financial Services Group, Inc. | 11.4 | 0.9 | 1.5 | 4.7 | 2.4 | 0.5 | 0.8 | 0.6 |
| Regions Financial Corporation | 5.2 | 0.7 | 0.5 | 1.6 | 1.6 | 0.2 | 0.4 | 0.3 |
| Santander Holdings USA, Inc. | 7.1 | 0.3 | 0.2 | 0.8 | 1.0 | 0.1 | 4.4 | 0.3 |
| State Street Corporation | 0.4 | 0.0 | 0.0 | 0.2 | 0.0 | 0.0 | 0.0 | 0.2 |
| SunTrust Banks, Inc. | 6.4 | 1.0 | 0.8 | 2.2 | 1.0 | 0.2 | 1.1 | 0.2 |
| TD Group US Holdings LLC | 9.3 | 0.8 | 0.6 | 2.2 | 2.4 | 2.0 | 0.5 | 0.8 |
| U.S. Bancorp | 18.9 | 1.6 | 0.9 | 6.4 | 4.2 | 3.3 | 1.4 | 1.1 |
| Wells Fargo & Company | 51.8 | 7.3 | 4.7 | 12.0 | 10.0 | 5.4 | 6.5 | 5.8 |
| Zions Bancorporation | 2.6 | 0.1 | 0.1 | 1.1 | 1.2 | 0.0 | 0.1 | 0.1 |
| 33 participating bank holding companies | 384.9 | 38.1 | 32.2 | 93.1 | 51.9 | 92.3 | 37.9 | 39.3 |
Note: These projections represent hypothetical estimates that involve an economic outcome that is more adverse than expected.
1. Commercial and industrial loans include small and medium enterprise loans and corporate cards. Return to table
2. Other consumer loans include student loans and automobile loans. Return to table
3. Other loans include international real estate loans. Return to table
| Bank holding company | Loan losses |
First lien mortgages, domestic |
Junior liens and HELOCs, domestic |
Commercial and industrial |
Commercial real estate, domestic2 |
Credit cards | Other consumer3 |
Other loans4 |
|---|---|---|---|---|---|---|---|---|
| Ally Financial Inc. | 5.3 | 3.5 | 8.4 | 4.5 | 3.1 | 0.0 | 6.1 | 9.4 |
| American Express Company | 9.8 | 0.0 | 0.0 | 10.5 | 0.0 | 9.5 | 13.8 | 7.9 |
| BancWest Corporation | 6.7 | 4.9 | 4.2 | 9.0 | 7.1 | 18.2 | 5.7 | 6.3 |
| Bank of America Corporation | 5.6 | 3.8 | 13.0 | 5.0 | 7.7 | 11.5 | 2.2 | 2.6 |
| The Bank of New York Mellon Corporation | 3.2 | 2.3 | 8.5 | 2.6 | 8.6 | 0.0 | 11.2 | 2.6 |
| BB&T Corporation | 5.3 | 3.3 | 3.5 | 4.7 | 7.7 | 13.3 | 6.6 | 3.2 |
| BBVA Compass Bancshares, Inc. | 5.4 | 3.8 | 5.8 | 5.4 | 8.6 | 15.7 | 5.5 | 1.8 |
| BMO Financial Corp. | 5.8 | 3.5 | 10.8 | 6.9 | 7.3 | 11.0 | 2.1 | 4.3 |
| Capital One Financial Corporation | 11.2 | 1.1 | 6.7 | 9.8 | 4.4 | 19.3 | 8.1 | 4.0 |
| Citigroup Inc. | 7.0 | 2.8 | 9.3 | 5.5 | 9.9 | 14.0 | 11.4 | 3.3 |
| Citizens Financial Group, Inc. | 4.8 | 2.8 | 6.1 | 4.9 | 6.6 | 12.1 | 4.5 | 2.5 |
| Comerica Incorporated | 4.4 | 3.3 | 3.6 | 3.6 | 5.6 | 0.0 | 8.5 | 6.2 |
| Deutsche Bank Trust Corporation | 3.8 | 2.4 | 8.4 | 5.7 | 9.0 | 0.0 | 4.4 | 1.8 |
| Discover Financial Services | 12.4 | 4.6 | 14.2 | 15.5 | 22.9 | 12.8 | 10.8 | 7.2 |
| Fifth Third Bancorp | 5.8 | 4.3 | 5.4 | 5.7 | 12.2 | 16.2 | 3.0 | 3.0 |
| The Goldman Sachs Group, Inc. | 6.8 | 50.1 | 8.0 | 12.0 | 6.5 | 0.0 | 4.4 | 4.3 |
| HSBC North America Holdings Inc. | 5.9 | 7.9 | 16.3 | 4.0 | 6.3 | 15.0 | 8.0 | 3.7 |
| Huntington Bancshares Incorporated | 4.8 | 3.9 | 3.7 | 5.0 | 7.0 | 15.1 | 4.2 | 3.5 |
| JPMorgan Chase & Co. | 6.1 | 2.7 | 9.2 | 9.4 | 4.6 | 11.0 | 3.6 | 4.5 |
| KeyCorp | 5.1 | 4.5 | 4.3 | 5.2 | 6.1 | 12.5 | 7.4 | 2.9 |
| M&T Bank Corporation | 5.8 | 5.6 | 6.3 | 4.1 | 6.8 | 15.0 | 6.4 | 3.9 |
| Morgan Stanley | 3.3 | 1.7 | 8.0 | 8.5 | 5.5 | 0.0 | 0.9 | 3.0 |
| MUFG Americas Holdings Corporation | 4.2 | 2.0 | 5.3 | 5.5 | 5.5 | 0.0 | 15.8 | 4.3 |
| Northern Trust Corporation | 4.6 | 3.1 | 9.6 | 4.0 | 6.4 | 0.0 | 12.8 | 4.4 |
| The PNC Financial Services Group, Inc. | 5.3 | 3.4 | 6.6 | 6.7 | 6.8 | 12.2 | 3.8 | 1.7 |
| Regions Financial Corporation | 6.1 | 4.6 | 5.3 | 6.3 | 9.9 | 14.3 | 6.5 | 2.7 |
| Santander Holdings USA, Inc. | 8.2 | 3.8 | 3.8 | 3.9 | 5.2 | 15.6 | 16.5 | 4.2 |
| State Street Corporation | 1.9 | 0.0 | 0.0 | 5.4 | 5.7 | 0.0 | 0.6 | 1.2 |
| SunTrust Banks, Inc. | 4.5 | 3.9 | 5.6 | 4.7 | 5.4 | 14.0 | 4.9 | 1.7 |
| TD Group US Holdings LLC | 6.5 | 3.7 | 6.4 | 6.7 | 9.6 | 18.2 | 2.5 | 3.8 |
| U.S. Bancorp | 7.0 | 2.8 | 5.1 | 9.0 | 10.5 | 15.0 | 3.8 | 4.8 |
| Wells Fargo & Company | 5.4 | 2.8 | 6.5 | 6.3 | 7.4 | 15.2 | 6.7 | 3.4 |
| Zions Bancorporation | 6.3 | 1.1 | 3.4 | 8.5 | 6.7 | 15.0 | 10.9 | 5.5 |
| 33 participating bank holding companies | 6.1 | 3.2 | 8.1 | 6.3 | 7.0 | 13.4 | 5.7 | 3.4 |
Note: These projections represent hypothetical estimates that involve an economic outcome that is more adverse than expected.
1. Average loan balances used to calculate portfolio loss rates exclude loans held for sale and loans held for investment under the fair-value option, and are calculated over nine quarters. Return to table
2. Commercial and industrial loans include small and medium enterprise loans and corporate cards. Return to table
3. Other consumer loans include student loans and automobile loans. Return to table
4. Other loans include international real estate loans. Return to table
Adverse Scenario
In this Section:
Stressed Capital Ratios and Risk-Weighted Assets
The adverse scenario projections suggest moderate declines in aggregate capital ratios for the 33 BHCs. The aggregate CET1 ratio is projected to fall 1.7 percentage points to its minimum over the planning horizon and to be 1.7 percentage points lower at the end of the planning horizon (see table 7).34 In addition, at the end of the planning horizon, the tier 1 risk-based capital ratio and the total risk-based capital ratio are 1.7 and 2.2 percentage points lower than at the start of the planning horizon, respectively. The tier 1 leverage ratio is projected to decline 1.2 percentage points over the planning horizon.
The projected declines in post-stress capital ratios are smaller than those under the severely adverse scenario, reflecting the less severe macroeconomic conditions assumed in the adverse scenario. As compared to the severely adverse scenario, the adverse scenario projections imply higher aggregate net income driven by higher PPNR and lower losses. Offsetting somewhat the effect of aggregate higher net income on capital, the adverse scenario also features more robust projected balance sheet and risk-weighted asset growth than the severely adverse scenario, which on net tends to reduce post-stress capital ratios.
Projected Losses
The Federal Reserve's projections suggest that the 33 BHCs as a group would face elevated losses under the adverse scenario, though not as large as the losses under the severely adverse scenario. In this scenario, total losses are projected to equal $324 billion for the 33 BHCs over the nine-quarter planning horizon.
These losses include
- $252 billion in accrual loan losses,
- $5 billion in OTTI and other realized securities losses,
- $53 billion in losses from the global market shock and the largest counterparty default components, and
- $14 billion in additional losses from items such as loans booked under the fair-value option.
These results are presented in aggregate (table 7) and individually for each of the 33 BHCs (table 9 and appendix C). Aggregate loss amounts are lower than those projected under the severely adverse scenario, once again reflecting the relatively less stressful macroeconomic and financial market conditions assumed in the adverse scenario.
Note: Estimates are for the nine-quarter period from 2016:Q1-2018:Q1 as a percent of risk-weighted assets. (The text of this note has been changed from "average" assets to "risk-weighted" assets.)
Loan Losses
As in the severely adverse scenario, the accrual loan portfolio is the largest source of losses in the adverse scenario, accounting for $252 billion of projected losses for the 33 BHCs. The lower peak unemployment rate and more moderate residential and commercial real estate price declines in the adverse scenario result in lower projected accrual loan losses on consumer and real estate-related loans relative to the severely adverse scenario. In aggregate, the nine-quarter loan loss rate of the 33 BHCs is 4.0 percent. As in the severely adverse scenario results, there is considerable diversity across firms in projected loan loss rates, both in the aggregate and by loan type (see figures 16 and D.8 to D.14).
Note: Estimates are for the nine-quarter period from 2016:Q1-2018:Q1 as a percent of average balances.
Losses on Trading, Private Equity, and Derivatives Positions
Projected losses resulting from the impact of the global market shock and the largest counterparty default on trading, private equity, and counterparty exposures for the eight BHCs with large trading, processing, or custodial operations equal $53 billion under the adverse scenario. These losses are slightly less than half those projected under the severely adverse scenario, reflecting the less severe market shocks assumed in the global market shock component of the adverse scenario.
Projected Pre-provision Net Revenue and Net Income
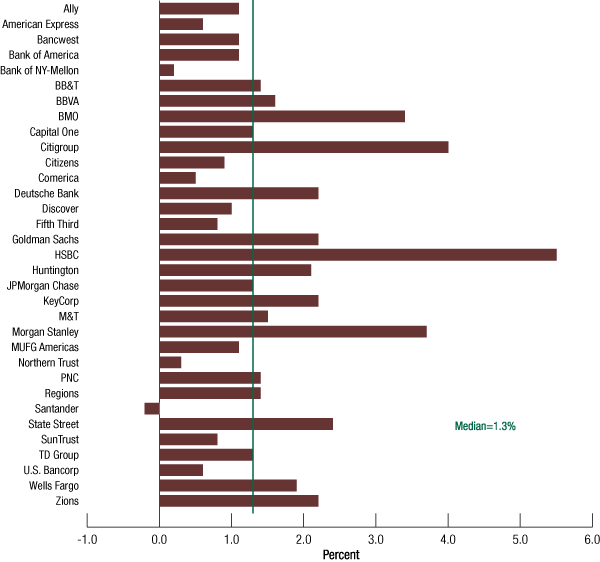
Aggregate PPNR is projected to equal $475 billion for the 33 BHCs under the adverse scenario, equal to 3.1 percent of average projected assets for these firms. Similar to the severely adverse scenario, projected PPNR declines largely due to the drop in long-term Treasury rates at the start of the projection horizon. However, projected operational risk and mortgage repurchase losses are lower compared to the severely adverse scenario, the latter being consistent with the adverse scenario's more moderate housing price decline. Projected ratios of PPNR to assets vary significantly across the 33 BHCs (see figure 17).
Note: Estimates are for the nine-quarter period from 2016:Q1-2018:Q1 as a percent of average assets.
In the aggregate, the 33 BHCs are projected to have cumulative pre-tax net income of $142 billion over the nine-quarter planning horizon under the adverse scenario. Twenty-four of the BHCs are projected to have positive cumulative pre-tax net income, though 21 firms experience at least one quarter of negative net income during the planning horizon. The higher net income, as compared to the severely adverse scenario projections, reflects the combination of higher projected PPNR and lower projected losses, especially on trading, private equity and counterparty positions, and on the accrual loan portfolio. The $263 billion in total provisions reported in table 7 includes $252 billion in net charge-offs, with the remainder being the reserve build.
Aggregate pre-tax net income under the adverse scenario is positive, with a ratio of income to average assets of 0.9 percent. Projected nine-quarter return on assets under the adverse scenario ranges between -1.3 and 6.3 percent for the 33 BHCs (see figure 18).
Note: Estimates are for the nine-quarter period from 2016:Q1-2018:Q1 as a percent of average assets.
Lower interest rates and wider credit spreads assumed in the scenario result in -$15 billion of other comprehensive income over the nine quarters of the planning horizon for advanced approaches BHCs and other BHCs that opt into advanced approaches treatment for AOCI. Reflecting the gradual phasing-in of portions of AOCI in the revised regulatory capital framework -$37 billion in AOCI is included in post-stress regulatory capital as of the first quarter of 2018.
Table 7. 33 participating bank holding companies
Projected stressed capital ratios, risk-weighted assets, losses, revenues, net income before taxes, and loan losses
Federal Reserve estimates: Adverse scenario
| Regulatory ratio | Actual 2015:Q4 | Stressed capital ratios1 | |
|---|---|---|---|
| Ending | Minimum | ||
| Common equity tier 1 capital ratio | 12.3 | 10.5 | 10.5 |
| Tier 1 capital ratio | 13.5 | 11.8 | 11.8 |
| Total capital ratio | 16.2 | 14.0 | 14.0 |
| Tier 1 leverage ratio | 9.2 | 8.0 | 8.0 |
Note: In accordance with the regulatory capital framework, all risk-based capital ratios are now calculated using standardized RWAs, which became effective on January 1, 2015. The transition had a one-time effect of reducing risk-based capital ratios in first quarter 2015. However, the aggregate common equity capital ratio of the 33 firms increased by 70 basis points between the first quarter of 2015 and the fourth quarter of 2015.
1. The capital ratios are calculated using capital action assumptions provided within the Dodd-Frank Act stress testing rule. See 12 CFR 252.56(b). These projections represent hypothetical estimates that involve an economic outcome that is more adverse than expected. The minimum capital ratio presented is for the period 2016:Q1 to 2018:Q1. Return to table
| Loan type | Billions of dollars | Portfolio loss rates (percent)1 |
|---|---|---|
| Loan losses | 252.0 | 4.0 |
| First-lien mortgages, domestic | 23.2 | 2.0 |
| Junior liens and HELOCs, domestic | 22.2 | 5.5 |
| Commercial and industrial2 | 58.5 | 4.0 |
| Commercial real estate, domestic | 23.9 | 3.2 |
| Credit cards | 73.1 | 10.5 |
| Other consumer3 | 28.6 | 4.3 |
| Other loans4 | 22.6 | 1.9 |
1. Average loan balances used to calculate portfolio loss rates exclude loans held for sale and loans held for investment under the fair-value option, and are calculated over nine quarters. Return to table
2. Commercial and industrial loans include small- and medium-enterprise loans and corporate cards. Return to table
3. Other consumer loans include student loans and automobile loans. Return to table
4. Other loans include international real estate loans. Return to table
| Item | Actual 2015:Q4 | Projected 2018:Q1 |
|---|---|---|
| Risk-weighted assets 1 | 9,595.1 | 10,673.1 |
1. For each quarter, risk-weighted assets are calculated under the Board's standardized capital risk-based approach in 12 CFR part 217, subpart D. Return to table
| Item | Billions of dollars | Percent of average assets1 |
|---|---|---|
| Pre-provision net revenue2 | 474.8 | 3.1 |
| Other revenue3 | 1.6 | |
| less | ||
| Provisions | 262.6 | |
| Realized losses/gains on securities (AFS/HTM) | 5.2 | |
| Trading and counterparty losses4 | 52.6 | |
| Other losses/gains5 | 14.4 | |
| equals | ||
| Net income before taxes | 141.6 | 0.9 |
| Memo items | ||
| Other comprehensive income6 | -14.6 | |
| Other effects on capital | Actual 2015:Q4 | 2018:Q1 |
| AOCI included in capital (billions of dollars)7 | -37.0 | -60.3 |
1. Average assets is the nine-quarter average of total assets. Return to table
2. Pre-provision net revenue includes losses from operational-risk events, mortgage repurchase expenses, and other real estate owned (OREO) costs. Return to table
3. Other revenue includes one-time income and (expense) items not included in pre-provision net revenue. Return to table
4. Trading and counterparty losses include mark-to-market and credit valuation adjustments (CVA) losses and losses arising from the counterparty default scenario component applied to derivatives, securities lending, and repurchase agreement activities. Return to table
5. Other losses/gains includes projected change in fair value of loans held for sale and loans held for investment measured under the fair-value option, and goodwill impairment losses. Return to table
6. Other comprehensive income (OCI) is only calculated for advanced approaches BHCs, and other BHCs that opt into the advanced approaches treatment of AOCI. Return to table
7. Certain aspects of AOCI are subject to transition arrangements for inclusion in projected regulatory capital. The transition arrangements are 40 percent included in projected regulatory capital for 2015, 60 percent included in projected regulatory capital for 2016, 80 percent included in projected regulatory capital for 2017, and 100 percent included in projected regulatory capital for 2018. See 12 CFR 217.300(b)(3). Return to table
| Bank holding company | Common equity tier 1 capital ratio |
Tier 1 capital ratio | Total capital ratio | Tier 1 leverage ratio | ||||||||
|---|---|---|---|---|---|---|---|---|---|---|---|---|
| Actual 2015:Q4 | Ending | Minimum | Actual 2015:Q4 | Ending | Minimum | Actual 2015:Q4 | Ending | Minimum | Actual 2015:Q4 | Ending | Minimum | |
| Ally Financial Inc. | 9.2 | 8.1 | 8.1 | 11.1 | 10.2 | 10.2 | 12.5 | 11.9 | 11.9 | 9.7 | 8.9 | 8.9 |
| American Express Company | 12.4 | 14.3 | 11.7 | 13.5 | 15.5 | 12.9 | 15.2 | 17.1 | 14.6 | 11.7 | 12.4 | 11.3 |
| BancWest Corporation | 12.3 | 11.2 | 11.2 | 12.3 | 11.2 | 11.2 | 14.6 | 13.6 | 13.6 | 10.1 | 9.1 | 9.1 |
| Bank of America Corporation | 11.6 | 10.5 | 10.5 | 12.9 | 12.0 | 12.0 | 15.7 | 14.3 | 14.3 | 8.6 | 8.0 | 8.0 |
| The Bank of New York Mellon Corporation | 11.5 | 12.4 | 11.3 | 13.1 | 14.3 | 12.8 | 13.5 | 14.6 | 13.2 | 6.0 | 6.3 | 5.8 |
| BB&T Corporation | 10.3 | 8.9 | 8.9 | 11.8 | 10.5 | 10.5 | 14.3 | 12.4 | 12.4 | 9.8 | 8.5 | 8.5 |
| BBVA Compass Bancshares, Inc. | 10.7 | 9.1 | 9.1 | 11.1 | 9.4 | 9.4 | 13.7 | 11.5 | 11.5 | 9.0 | 7.5 | 7.5 |
| BMO Financial Corp. | 11.9 | 8.5 | 8.5 | 11.9 | 8.9 | 8.9 | 14.9 | 11.1 | 11.1 | 9.3 | 6.8 | 6.8 |
| Capital One Financial Corporation | 11.1 | 10.0 | 9.8 | 12.4 | 11.2 | 11.0 | 14.6 | 13.1 | 13.1 | 10.6 | 9.5 | 9.5 |
| Citigroup Inc. | 15.3 | 11.3 | 11.3 | 15.5 | 12.6 | 12.6 | 18.5 | 15.2 | 15.2 | 10.2 | 8.3 | 8.3 |
| Citizens Financial Group, Inc. | 11.7 | 10.8 | 10.8 | 12.0 | 11.0 | 11.0 | 15.3 | 14.0 | 14.0 | 10.5 | 9.5 | 9.5 |
| Comerica Incorporated | 10.5 | 10.0 | 10.0 | 10.5 | 10.0 | 10.0 | 12.7 | 11.5 | 11.5 | 10.2 | 9.5 | 9.5 |
| Deutsche Bank Trust Corporation | 34.1 | 31.9 | 31.9 | 34.1 | 31.9 | 31.9 | 34.3 | 32.5 | 32.5 | 13.9 | 12.8 | 12.8 |
| Discover Financial Services | 13.9 | 14.4 | 12.9 | 14.7 | 15.0 | 13.7 | 16.5 | 16.5 | 15.4 | 12.9 | 13.0 | 12.3 |
| Fifth Third Bancorp | 9.8 | 9.0 | 9.0 | 10.9 | 9.9 | 9.9 | 14.1 | 12.7 | 12.7 | 9.5 | 8.6 | 8.6 |
| The Goldman Sachs Group, Inc. | 13.6 | 11.9 | 11.4 | 15.6 | 12.6 | 12.6 | 18.7 | 15.3 | 15.3 | 9.3 | 7.5 | 7.4 |
| HSBC North America Holdings Inc. | 15.7 | 10.2 | 10.2 | 17.3 | 12.0 | 12.0 | 22.6 | 15.3 | 15.3 | 10.0 | 6.8 | 6.8 |
| Huntington Bancshares Incorporated | 9.8 | 7.7 | 7.7 | 10.5 | 8.9 | 8.9 | 12.6 | 11.1 | 11.1 | 8.8 | 7.1 | 7.1 |
| JPMorgan Chase & Co. | 12.0 | 10.6 | 10.6 | 13.7 | 12.2 | 12.2 | 16.0 | 14.1 | 14.1 | 8.5 | 7.5 | 7.5 |
| KeyCorp | 10.9 | 8.8 | 8.8 | 11.4 | 9.2 | 9.2 | 13.0 | 11.0 | 11.0 | 10.7 | 8.1 | 8.1 |
| M&T Bank Corporation | 11.1 | 9.6 | 9.6 | 12.7 | 10.8 | 10.8 | 14.9 | 12.7 | 12.7 | 10.9 | 9.1 | 9.1 |
| Morgan Stanley | 16.4 | 12.8 | 12.7 | 18.4 | 14.5 | 14.3 | 22.0 | 17.4 | 17.4 | 8.3 | 6.5 | 6.5 |
| MUFG Americas Holdings Corporation | 13.6 | 12.5 | 12.5 | 13.6 | 12.5 | 12.5 | 15.6 | 13.9 | 13.9 | 11.4 | 8.7 | 8.7 |
| Northern Trust Corporation | 10.8 | 10.5 | 10.5 | 11.4 | 11.0 | 11.0 | 13.2 | 12.5 | 12.5 | 7.5 | 7.1 | 7.1 |
| The PNC Financial Services Group, Inc. | 10.6 | 9.2 | 9.2 | 12.0 | 10.3 | 10.3 | 14.6 | 12.1 | 12.1 | 10.2 | 8.7 | 8.7 |
| Regions Financial Corporation | 10.9 | 9.6 | 9.6 | 11.7 | 10.2 | 10.2 | 13.9 | 12.1 | 12.1 | 10.3 | 8.8 | 8.8 |
| Santander Holdings USA, Inc. | 12.0 | 13.8 | 12.2 | 13.5 | 14.8 | 13.4 | 15.3 | 16.3 | 15.1 | 11.6 | 11.6 | 11.3 |
| State Street Corporation | 13.0 | 10.6 | 10.6 | 15.9 | 13.7 | 13.7 | 18.2 | 15.6 | 15.6 | 6.9 | 5.7 | 5.7 |
| SunTrust Banks, Inc. | 10.0 | 9.2 | 9.2 | 10.8 | 9.9 | 9.9 | 12.5 | 11.3 | 11.3 | 9.7 | 8.8 | 8.8 |
| TD Group US Holdings LLC | 13.1 | 11.8 | 11.7 | 13.2 | 11.8 | 11.8 | 14.3 | 13.0 | 13.0 | 8.3 | 7.0 | 6.9 |
| U.S. Bancorp | 9.6 | 9.1 | 9.0 | 11.3 | 10.6 | 10.5 | 13.3 | 12.4 | 12.4 | 9.5 | 8.9 | 8.9 |
| Wells Fargo & Company | 11.1 | 9.1 | 9.1 | 12.6 | 10.6 | 10.6 | 15.8 | 13.2 | 13.2 | 9.4 | 8.0 | 8.0 |
| Zions Bancorporation | 12.2 | 10.0 | 10.0 | 14.1 | 11.7 | 11.7 | 16.1 | 13.2 | 13.2 | 11.3 | 9.2 | 9.2 |
| 33 participating bank holding companies | 12.3 | 10.5 | 10.5 | 13.5 | 11.8 | 11.8 | 16.2 | 14.0 | 14.0 | 9.2 | 8.0 | 8.0 |
Note: The capital ratios are calculated using capital action assumptions provided within the Dodd-Frank Act stress testing rule. See 12 CFR 252.56(b). These projections represent hypothetical estimates that involve an economic outcome that is more adverse than expected. The minimum capital ratio presented is for the period 2016:Q1 to 2018:Q1.
In accordance with the regulatory capital framework, all risk-based capital ratios are now calculated using standardized RWAs, which became effective on January 1, 2015. The transition had a one-time effect of reducing risk-based capital ratios in first quarter 2015. However, the aggregate common equity capital ratio of the 33 firms increased by 70 basis points between the first quarter of 2015 and the fourth quarter of 2015.
| Bank holding company | Sum of revenues | Minus sum of provisions and losses | Equals | Memo items | Other effects on capital | ||||
|---|---|---|---|---|---|---|---|---|---|
| Pre-provision net revenue1 | Other revenue 2 |
Provisions | Realized losses/gains on securities (AFS/HTM) | Trading and counterparty losses3 | Other losses/ gains4 |
Net income before taxes |
Other compre- hensive income 5 |
AOCI included in capital 6 (2018:Q1) |
|
| Ally Financial Inc. | 5.4 | 0.0 | 4.9 | 0.3 | 0.0 | 0.0 | 0.1 | 0.0 | 0.0 |
| American Express Company | 20.1 | 1.3 | 10.4 | 0.0 | 0.0 | 0.2 | 10.8 | 0.0 | -2.6 |
| BancWest Corporation | 3.0 | 0.0 | 3.1 | 0.0 | 0.0 | 0.0 | -0.1 | 0.0 | 0.0 |
| Bank of America Corporation | 61.8 | 0.0 | 35.3 | 0.3 | 7.8 | 1.8 | 16.6 | -0.9 | -5.5 |
| The Bank of New York Mellon Corporation | 12.7 | 0.0 | 1.6 | 0.0 | 0.6 | 0.0 | 10.3 | -0.3 | -2.9 |
| BB&T Corporation | 8.6 | 0.0 | 5.0 | 0.0 | 0.0 | 0.0 | 3.6 | 0.0 | 0.0 |
| BBVA Compass Bancshares, Inc. | 1.6 | 0.0 | 2.0 | 0.0 | 0.0 | 0.0 | -0.4 | 0.0 | 0.0 |
| BMO Financial Corp. | 1.5 | 0.0 | 3.0 | 0.0 | 0.0 | 0.0 | -1.4 | 0.0 | 0.0 |
| Capital One Financial Corporation | 27.1 | 0.0 | 22.5 | 0.0 | 0.0 | 0.1 | 4.6 | -0.1 | -0.8 |
| Citigroup Inc. | 53.1 | 0.3 | 32.5 | 0.9 | 8.4 | 2.5 | 9.0 | -3.2 | -32.0 |
| Citizens Financial Group, Inc. | 4.2 | 0.0 | 3.4 | 0.0 | 0.0 | 0.0 | 0.8 | 0.0 | 0.0 |
| Comerica Incorporated | 1.9 | 0.0 | 1.0 | 0.0 | 0.0 | 0.0 | 0.8 | 0.0 | 0.0 |
| Deutsche Bank Trust Corporation | 0.7 | 0.0 | 0.5 | 0.0 | 0.0 | 0.0 | 0.2 | 0.0 | 0.0 |
| Discover Financial Services | 13.3 | 0.0 | 8.9 | 0.0 | 0.0 | 0.0 | 4.4 | 0.0 | 0.0 |
| Fifth Third Bancorp | 5.2 | 0.0 | 3.3 | 0.0 | 0.0 | 0.0 | 1.9 | 0.0 | 0.0 |
| The Goldman Sachs Group, Inc. | 16.0 | 0.0 | 3.3 | 0.0 | 10.1 | 3.1 | -0.5 | 0.0 | -0.7 |
| HSBC North America Holdings Inc. | 1.0 | 0.0 | 3.4 | 0.0 | 0.0 | 1.3 | -3.7 | 0.1 | -0.8 |
| Huntington Bancshares Incorporated | 2.8 | 0.0 | 2.3 | 0.0 | 0.0 | 0.0 | 0.4 | 0.0 | 0.0 |
| JPMorgan Chase & Co. | 78.8 | 0.0 | 34.3 | 0.9 | 13.7 | 0.4 | 29.5 | -4.4 | -4.2 |
| KeyCorp | 4.0 | 0.0 | 2.7 | 0.0 | 0.0 | 0.1 | 1.3 | 0.0 | 0.0 |
| M&T Bank Corporation | 4.0 | 0.0 | 3.3 | 0.0 | 0.0 | 0.0 | 0.6 | 0.0 | 0.0 |
| Morgan Stanley | 11.9 | 0.0 | 2.4 | 0.0 | 7.2 | 2.3 | -0.1 | -0.1 | -1.8 |
| MUFG Americas Holdings Corporation | 1.9 | 0.0 | 1.7 | 0.2 | 0.0 | 0.1 | -0.1 | 0.0 | 0.0 |
| Northern Trust Corporation | 3.2 | 0.0 | 1.0 | 0.0 | 0.0 | 0.0 | 2.2 | 0.0 | -0.4 |
| The PNC Financial Services Group, Inc. | 13.4 | 0.0 | 7.2 | 0.1 | 0.0 | 0.2 | 5.9 | -0.3 | -0.6 |
| Regions Financial Corporation | 4.0 | 0.0 | 3.3 | 0.0 | 0.0 | 0.0 | 0.7 | 0.0 | 0.0 |
| Santander Holdings USA, Inc. | 6.9 | 0.0 | 3.3 | 0.0 | 0.0 | 0.1 | 3.5 | 0.0 | 0.0 |
| State Street Corporation | 4.9 | 0.0 | 0.3 | 0.2 | 0.7 | 0.0 | 3.7 | -1.1 | -2.6 |
| SunTrust Banks, Inc. | 6.9 | 0.0 | 4.0 | 0.0 | 0.0 | 0.4 | 2.6 | 0.0 | 0.0 |
| TD Group US Holdings LLC | 5.5 | 0.0 | 6.4 | 0.0 | 0.0 | 0.0 | -1.0 | -0.4 | -0.4 |
| U.S. Bancorp | 24.6 | 0.0 | 12.5 | 0.0 | 0.0 | 0.0 | 12.0 | -0.2 | -1.1 |
| Wells Fargo & Company | 63.8 | 0.0 | 32.5 | 2.0 | 4.0 | 1.6 | 23.8 | -3.7 | -4.0 |
| Zions Bancorporation | 1.1 | 0.0 | 1.4 | 0.0 | 0.0 | 0.0 | -0.4 | 0.0 | 0.0 |
| 33 participating bank holding companies | 474.8 | 1.6 | 262.6 | 5.2 | 52.6 | 14.4 | 141.6 | -14.6 | -60.3 |
Note: These projections represent hypothetical estimates that involve an economic outcome that is more adverse than expected. Estimates may not sum precisely due to rounding.
1. Pre-provision net revenue includes losses from operational-risk events, mortgage repurchase expenses, and other real estate owned costs. Return to table
2. Other revenue includes one-time income and (expense) items not included in pre-provision net revenue. Return to table
3. Trading and counterparty losses include mark-to-market and credit valuation adjustments losses and losses arising from the counterparty default scenario component applied to derivatives, securities lending, and repurchase agreement activities. Return to table
4. Other losses/gains includes projected change in fair value of loans held for sale and loans held for investment measured under the fair-value option, and goodwill impairment losses. Return to table
5. Other comprehensive income is only calculated for advanced approaches BHCs and other BHCs that opt into advanced approaches treatment for AOCI. Return to table
6. Certain aspects of AOCI are subject to transition arrangements for inclusion in projected regulatory capital. Those transitions are 40 percent included in projected regulatory capital for 2015, 60 percent included in projected regulatory capital for 2016, 80 percent included in projected regulatory capital for 2017, and 100 percent included in projected regulatory capital for 2018. See 12 CFR 217.300(b)(3). Return to table
| Bank holding company | Loan losses |
First lien mortgages, domestic |
Junior liens and HELOCs, domestic |
Commercial and industrial |
Commercial real estate, domestic1 |
Credit cards |
Other consumer2 |
Other loans3 |
|---|---|---|---|---|---|---|---|---|
| Ally Financial Inc. | 4.1 | 0.2 | 0.1 | 1.2 | 0.1 | 0.0 | 2.6 | 0.0 |
| American Express Company | 8.1 | 0.0 | 0.0 | 2.7 | 0.0 | 5.2 | 0.0 | 0.1 |
| BancWest Corporation | 2.7 | 0.3 | 0.1 | 0.8 | 0.6 | 0.1 | 0.6 | 0.3 |
| Bank of America Corporation | 35.8 | 5.1 | 7.6 | 7.1 | 2.6 | 9.3 | 1.2 | 2.8 |
| The Bank of New York Mellon Corporation | 1.3 | 0.1 | 0.0 | 0.1 | 0.1 | 0.0 | 0.3 | 0.8 |
| BB&T Corporation | 4.5 | 0.7 | 0.2 | 0.8 | 1.4 | 0.2 | 0.9 | 0.3 |
| BBVA Compass Bancshares, Inc. | 2.0 | 0.4 | 0.1 | 0.6 | 0.5 | 0.1 | 0.2 | 0.1 |
| BMO Financial Corp. | 2.6 | 0.2 | 0.4 | 1.2 | 0.3 | 0.0 | 0.1 | 0.4 |
| Capital One Financial Corporation | 20.4 | 0.2 | 0.1 | 1.9 | 0.6 | 14.6 | 2.6 | 0.4 |
| Citigroup Inc. | 32.5 | 1.0 | 1.4 | 5.9 | 0.6 | 16.8 | 3.1 | 3.7 |
| Citizens Financial Group, Inc. | 3.2 | 0.3 | 0.8 | 0.8 | 0.4 | 0.1 | 0.7 | 0.1 |
| Comerica Incorporated | 1.2 | 0.0 | 0.0 | 0.6 | 0.3 | 0.0 | 0.0 | 0.2 |
| Deutsche Bank Trust Corporation | 0.4 | 0.1 | 0.0 | 0.1 | 0.1 | 0.0 | 0.0 | 0.1 |
| Discover Financial Services | 7.4 | 0.0 | 0.0 | 0.0 | 0.0 | 6.0 | 1.4 | 0.0 |
| Fifth Third Bancorp | 3.4 | 0.4 | 0.3 | 1.3 | 0.6 | 0.3 | 0.3 | 0.2 |
| The Goldman Sachs Group, Inc. | 2.9 | 0.4 | 0.0 | 1.1 | 0.1 | 0.0 | 0.1 | 1.2 |
| HSBC North America Holdings Inc. | 3.5 | 1.5 | 0.5 | 0.9 | 0.3 | 0.1 | 0.0 | 0.3 |
| Huntington Bancshares Incorporated | 2.0 | 0.2 | 0.2 | 0.6 | 0.4 | 0.1 | 0.4 | 0.1 |
| JPMorgan Chase & Co. | 33.9 | 2.7 | 3.4 | 8.6 | 2.0 | 10.7 | 2.0 | 4.5 |
| KeyCorp | 2.5 | 0.3 | 0.3 | 0.8 | 0.4 | 0.1 | 0.4 | 0.2 |
| M&T Bank Corporation | 3.2 | 1.1 | 0.3 | 0.5 | 1.0 | 0.0 | 0.2 | 0.1 |
| Morgan Stanley | 2.0 | 0.2 | 0.0 | 0.7 | 0.2 | 0.0 | 0.1 | 0.8 |
| MUFG Americas Holdings Corporation | 1.7 | 0.2 | 0.1 | 0.7 | 0.4 | 0.0 | 0.1 | 0.2 |
| Northern Trust Corporation | 0.9 | 0.1 | 0.1 | 0.2 | 0.1 | 0.0 | 0.0 | 0.3 |
| The PNC Financial Services Group, Inc. | 7.1 | 0.6 | 1.1 | 2.9 | 1.1 | 0.4 | 0.7 | 0.3 |
| Regions Financial Corporation | 3.2 | 0.5 | 0.3 | 0.9 | 0.8 | 0.1 | 0.3 | 0.2 |
| Santander Holdings USA, Inc. | 4.9 | 0.2 | 0.2 | 0.5 | 0.5 | 0.1 | 3.3 | 0.2 |
| State Street Corporation | 0.2 | 0.0 | 0.0 | 0.1 | 0.0 | 0.0 | 0.0 | 0.1 |
| SunTrust Banks, Inc. | 4.0 | 0.7 | 0.5 | 1.3 | 0.5 | 0.1 | 0.8 | 0.1 |
| TD Group US Holdings LLC | 5.8 | 0.5 | 0.5 | 1.2 | 1.1 | 1.6 | 0.4 | 0.5 |
| U.S. Bancorp | 12.0 | 1.1 | 0.6 | 4.1 | 2.0 | 2.6 | 1.0 | 0.7 |
| Wells Fargo & Company | 31.2 | 3.8 | 2.9 | 7.5 | 4.5 | 4.3 | 5.0 | 3.3 |
| Zions Bancorporation | 1.5 | 0.0 | 0.1 | 0.7 | 0.6 | 0.0 | 0.0 | 0.1 |
| 33 participating bank holding companies | 252.0 | 23.2 | 22.2 | 58.5 | 23.9 | 73.1 | 28.6 | 22.6 |
Note: These projections represent hypothetical estimates that involve an economic outcome that is more adverse than expected.
1. Commercial and industrial loans include small and medium enterprise loans and corporate cards. Return to table
2. Other consumer loans include student loans and automobile loans. Return to table
3. Other loans include international real estate loans. Return to table
| Bank holding company | Loan losses |
First lien mortgages, domestic |
Junior liens and HELOCs, domestic |
Commercial and industrial |
Commercial real estate, domestic2 |
Credit cards | Other consumer 3 |
Other loans4 |
|---|---|---|---|---|---|---|---|---|
| Ally Financial Inc. | 3.6 | 2.3 | 5.6 | 2.7 | 1.6 | 0.0 | 4.3 | 5.4 |
| American Express Company | 7.4 | 0.0 | 0.0 | 7.8 | 0.0 | 7.3 | 12.0 | 4.6 |
| BancWest Corporation | 4.0 | 3.5 | 2.5 | 5.5 | 3.5 | 14.8 | 3.4 | 4.0 |
| Bank of America Corporation | 3.7 | 2.6 | 9.6 | 3.0 | 3.5 | 9.0 | 1.5 | 1.5 |
| The Bank of New York Mellon Corporation | 1.9 | 1.4 | 6.0 | 1.6 | 3.8 | 0.0 | 8.9 | 1.5 |
| BB&T Corporation | 3.1 | 2.1 | 2.2 | 3.0 | 3.6 | 10.2 | 4.5 | 1.8 |
| BBVA Compass Bancshares, Inc. | 3.1 | 2.4 | 4.2 | 3.3 | 4.0 | 12.6 | 4.1 | 1.1 |
| BMO Financial Corp. | 3.7 | 2.1 | 8.4 | 4.6 | 3.5 | 8.6 | 1.4 | 2.5 |
| Capital One Financial Corporation | 8.5 | 0.8 | 5.3 | 6.7 | 2.0 | 15.5 | 5.9 | 2.2 |
| Citigroup Inc. | 4.9 | 1.3 | 5.5 | 3.6 | 4.3 | 11.1 | 9.8 | 1.9 |
| Citizens Financial Group, Inc. | 3.1 | 1.8 | 4.3 | 2.9 | 3.1 | 9.6 | 3.5 | 1.4 |
| Comerica Incorporated | 2.4 | 1.9 | 2.2 | 2.1 | 2.5 | 0.0 | 6.8 | 3.3 |
| Deutsche Bank Trust Corporation | 2.0 | 1.6 | 6.0 | 3.5 | 3.5 | 0.0 | 3.6 | 1.0 |
| Discover Financial Services | 9.7 | 3.3 | 9.4 | 11.8 | 10.4 | 9.9 | 9.1 | 4.1 |
| Fifth Third Bancorp | 3.6 | 3.2 | 4.1 | 3.4 | 5.6 | 12.2 | 2.1 | 1.8 |
| The Goldman Sachs Group, Inc. | 4.1 | 46.6 | 5.8 | 6.9 | 2.7 | 0.0 | 3.7 | 2.5 |
| HSBC North America Holdings Inc. | 3.9 | 5.7 | 13.3 | 2.4 | 2.6 | 12.0 | 6.7 | 2.0 |
| Huntington Bancshares Incorporated | 3.1 | 2.8 | 2.7 | 3.2 | 3.4 | 11.9 | 3.0 | 2.0 |
| JPMorgan Chase & Co. | 3.8 | 1.3 | 5.7 | 5.9 | 2.1 | 8.4 | 2.8 | 2.5 |
| KeyCorp | 3.0 | 3.3 | 3.1 | 2.9 | 2.8 | 9.6 | 5.6 | 1.7 |
| M&T Bank Corporation | 3.5 | 3.9 | 4.7 | 2.7 | 3.2 | 12.0 | 4.4 | 2.1 |
| Morgan Stanley | 1.9 | 1.0 | 5.8 | 5.1 | 2.2 | 0.0 | 0.8 | 1.8 |
| MUFG Americas Holdings Corporation | 2.1 | 0.8 | 2.4 | 3.1 | 2.3 | 0.0 | 12.5 | 2.4 |
| Northern Trust Corporation | 2.6 | 1.7 | 6.2 | 2.3 | 2.8 | 0.0 | 9.6 | 2.4 |
| The PNC Financial Services Group, Inc. | 3.3 | 2.3 | 4.9 | 4.1 | 3.0 | 9.2 | 3.0 | 1.0 |
| Regions Financial Corporation | 3.8 | 3.2 | 3.9 | 3.7 | 5.0 | 10.7 | 4.9 | 1.6 |
| Santander Holdings USA, Inc. | 5.5 | 2.5 | 2.6 | 2.4 | 2.4 | 11.6 | 12.3 | 2.3 |
| State Street Corporation | 1.2 | 0.0 | 0.0 | 3.0 | 2.3 | 0.0 | 0.6 | 0.8 |
| SunTrust Banks, Inc. | 2.8 | 2.6 | 3.9 | 2.7 | 2.6 | 10.5 | 3.6 | 1.0 |
| TD Group US Holdings LLC | 4.0 | 2.4 | 4.9 | 3.8 | 4.3 | 14.8 | 1.7 | 2.3 |
| U.S. Bancorp | 4.4 | 1.8 | 3.3 | 5.7 | 4.9 | 11.8 | 2.7 | 2.9 |
| Wells Fargo & Company | 3.2 | 1.4 | 3.9 | 3.9 | 3.3 | 12.0 | 5.1 | 1.9 |
| Zions Bancorporation | 3.5 | 0.5 | 1.9 | 5.3 | 3.2 | 12.0 | 8.2 | 3.3 |
| 33 participating bank holding companies | 4.0 | 2.0 | 5.5 | 4.0 | 3.2 | 10.5 | 4.3 | 1.9 |
Note: These projections represent hypothetical estimates that involve an economic outcome that is more adverse than expected.
1. Average loan balances used to calculate portfolio loss rates exclude loans held for sale and loans held for investment under the fair-value option, and are calculated over nine quarters. Return to table
2. Commercial and industrial loans include small and medium enterprise loans and corporate cards. Return to table
3. Other consumer loans include student loans and automobile loans. Return to table
4. Other loans include international real estate loans. Return to table
References
30. In table 2 the decline from starting to ending aggregate CET1 ratio is 2.5 percentage points. The difference is due to rounding. Return to text
31. Losses are calculated based on the exposure at default, which includes both outstanding balances and any additional drawdown of the credit line that occurs prior to default, while loss rates are calculated as a percent of average outstanding balances over the planning horizon. See appendix B for more detail on the models used to project net income and stressed capital. Return to text
32. These estimates are conditional on the hypothetical adverse and severely adverse scenario and on conservative assumptions. They are not a supervisory estimate of the BHCs' current or expected legal liability. Return to text
33. As noted, credit card lending also tends to generate relatively high loss rates, so the higher PPNR rates at these BHCs do not necessarily indicate higher profitability. Return to text
34. As stated in the Executive Summary, the actual decline in the aggregate CET1 ratio is 173 basis points. The amounts in table 7 indicate a decline of 1.8 percentage points, which is due to rounding. Return to text
