
Report on the Economic Well-Being of U.S. Households in 2015
 Print
Print- Preface
- Executive Summary
- Introduction
- Overall Economic Well-Being
- Income and Savings
- Economic Preparedness and Emergency Savings
- Banking, Credit Access, and Credit Usage
- Housing and Household Living Arrangements
- Automobile Purchase Decisions and Auto Lending
- Higher Education and Human Capital
- Education Debt and Student Loans
- Retirement
Automobile Purchase Decisions and Auto Lending
Outside of a house, an automobile is typically one of the largest financial assets that individuals own. These vehicles are often financed at least in part by borrowing. As a result of this borrowing, auto loans are the third largest form of debt in the United States, behind housing debt and student loan debt, with over $1 trillion of auto loans outstanding in the third quarter of 2015.30 In order to evaluate decisionmaking in the car buying process and the sources of information that consumers rely on when obtaining an auto loan, the 2015 survey includes questions on the purchase decision and on automobile lending.
Purchase and Financing of Newly Acquired Vehicles
Twenty-four percent of adults report that either they or their spouse or partner acquired (purchased or leased) a new or used car or truck in the prior year. Of those who bought or leased an automobile, 38 percent purchased a new vehicle, 35 percent purchased a used vehicle from a dealership or car salesman, 17 percent purchased a used vehicle from a private seller, and 9 percent leased a vehicle.31
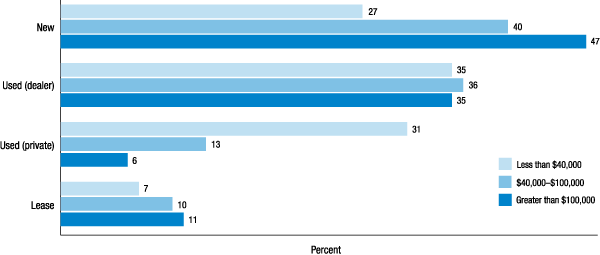
The source from which individuals acquire vehicles varies greatly by income level. Among lower-income respondents who bought or leased a vehicle in the prior year, two-thirds acquired it used, and 31 percent purchased that vehicle from a private seller. Over half of higher-income respondents who acquired a vehicle, on the other hand, either leased the vehicle or purchased it new (figure 24).
Note: Among respondents who purchased or leased a vehicle in the past 12 months.
Among all respondents who acquired a car or truck in the prior year, the median period over which they expect to keep that vehicle is six years. However, the expected life of the vehicle varies greatly based on whether it was leased, purchased new, or purchased used. Respondents who purchased a new, unused vehicle expect to keep it for a median of nine years. This compares to a median expected holding period of five years for those who purchased their automobile from a private seller (table 22). The shorter holding period for vehicles purchased from private sellers likely reflects the lower price of these cars. Seventy-eight percent of used vehicles purchased from private sellers were purchased for less than $10,000.
| Transaction type | Expected ownership period (years) | Purchase price (percent) | |||||
|---|---|---|---|---|---|---|---|
| Mean | Median | Less than $10,000 | $10,000- $20,000 |
$20,000- $30,000 |
$30,000- $40,000 |
Greater than $40,000 |
|
| New | 8.6 | 9.0 | 5.5 | 18.7 | 34.7 | 26.5 | 14.1 |
| Used (dealer) | 8.3 | 8.0 | 19.9 | 43.8 | 22.2 | 8.9 | 5.0 |
| Used (private) | 5.7 | 5.0 | 78.4 | 15.4 | 4.8 | 0.0 | 0.9 |
| Leased | 4.0 | 3.0 | -- | -- | -- | -- | -- |
| Overall | 7.6 | 6.0 | 24.8 | 27.9 | 24.2 | 14.6 | 8.1 |
Note: Among respondents who purchased or leased a vehicle in the past year. Respondents who leased a vehicle are not asked for the purchase price.
Approximately two-thirds of the respondents who purchased a new or used vehicle in the prior year took out a loan to finance that purchase.32 Half of these loans were taken out from the location where the vehicle was purchased, and 47 percent came from a bank, credit union, or Internet lender.
Consistent with the earlier observations (see the "Banking, Credit Access, and Credit Usage" section) that lower-income respondents are less likely to feel that credit is available were they to apply, respondents whose family income is below $40,000 who bought a car in the past year are less likely to have taken out a loan for their vehicle (table 23). However, this result is also at least partially attributable to the fact that lower-income buyers disproportionately purchase their car from private sellers. These private-party transactions may have fewer available options for obtaining a loan, as well as lower purchase prices which can reduce the demand for a loan.
| Income category | No | Yes, from seller |
Yes, from bank, credit union, or Internet lender |
Yes, from other source |
|---|---|---|---|---|
| Less than $40,000 | 44.6 | 24.0 | 28.5 | 2.6 |
| $40,000-$100,000 | 28.9 | 36.2 | 33.0 | 1.8 |
| Greater than $100,000 | 28.1 | 39.4 | 31.1 | 1.4 |
| Overall | 34.1 | 32.9 | 30.9 | 1.9 |
Note: Among respondents who purchased a vehicle in the past year.
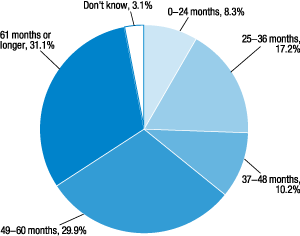
The length of auto loans for vehicles purchased recently vary in length. The median loan length is between 49 and 60 months (4 to 5 years). Approximately one-quarter of the loans are 36 months or less whereas 31 percent are 61 months or longer (figure 25). Comparing the expected holding period for newly acquired vehicles with the length of the loan, the vast majority of buyers expect to hold their car long enough to completely pay off the initial loan. However, 12 percent of car buyers who used a loan to finance the purchase took out a loan with a longer repayment period than their expected horizon for continuing to own the car.
Note: Among respondents who took out a loan to purchase a vehicle in the
past year.
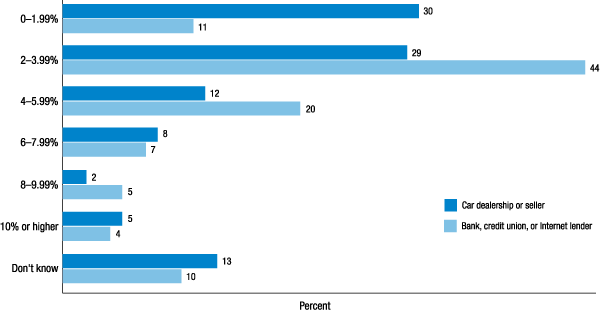
There is also substantial variation in the interest rate that individuals pay on their auto loans. Just over one-fifth of recent borrowers received an interest rate of under 2 percent for their auto loan, and 36 percent received an interest rate of between 2 percent and 3.99 percent. An additional 16 percent pay between 4 percent and 5.99 percent on their auto loan, while 15 percent pay over 6 percent on the loan. Eleven percent of borrowers do not know the interest rate on their loan. Perhaps reflecting the promotional interest rates that some car dealerships offer, it appears that interest rates of under 2 percent are more commonly received from the dealer or car salesman where the car was purchased than from a bank, credit union, or Internet lender (figure 26).
Note: Among respondents who took out a loan to purchase a vehicle in the past year.
This higher propensity of sub-2-percent interest rates from car dealers than from banks or other lenders is true for purchasers of both new and used cars. However, in the used car market there also is evidence of consumers receiving expensive financing more frequently from car sellers than they do from banks, credit unions, or Internet lenders. Among consumers who purchased a used car from a dealership or car lot, one-tenth of those who financed the car through the seller pay an interest rate of over 10 percent. In comparison, only 5 percent of used car loans from banks, credit unions, or Internet lenders have a double-digit interest rate.
Factors in the Car Purchase and Lease Decision
A series of questions in the survey are designed to understand the financial decisions that consumers make leading up to their vehicle purchase or lease. Although these questions are focused on decisions encountered when buying or leasing a car, they may also provide insights into how other large financial decisions are considered.
When deciding where to purchase or lease their vehicle, 70 percent of all consumers report that they compared prices from different sellers. Among just those who financed their purchase with a loan, 73 percent compared prices on the car or truck from different sellers, whereas 53 percent report that they compared interest rates or loan terms from different sellers. Hence, while a majority of consumers shopped around for both the vehicle price and loan terms, the fraction who compared prices on the vehicle significantly exceeds the fraction who compared prices on their loan.
Consumers are also asked about the sources of advice that they turned to when deciding how to finance their auto purchase. Half of car buyers report that they did not use advice from anyone else in deciding how to finance their car purchase. Twenty-three percent report that they used advice from friends or family, 20 percent found advice online, 15 percent used advice from the car dealer or car salesman, and 7 percent used advice from a banker or lender. Forty-seven percent of those who used advice from the car dealer or car salesman (7 percent of all car buyers) indicate that this was the only advice used for financing their vehicle.
When purchasing or leasing a vehicle, there are a number of financial factors that consumers may consider. These include the total purchase price of the car, the monthly payment amount, cash due upfront with the purchase, terms of the loan, or the amount offered for the trade-in of a used vehicle. Just over three-quarters of these consumers negotiated the purchase price of the vehicle, and 55 percent said that the purchase price was the most important factor. However, at least 30 percent of respondents report that they negotiated on each of the other factors presented, and 27 percent say that the monthly payment amount--not the purchase price--was the most important factor in their decision (table 24).
| Factor | Negotiated | Most important |
|---|---|---|
| Purchase price | 76.1 | 54.8 |
| Monthly payment | 40.0 | 27.1 |
| Upfront payment | 37.3 | 3.1 |
| Interest rate on loan | 31.6 | 6.1 |
| Length of loan | 36.6 | 2.7 |
| Trade-in amount | 37.2 | 6.0 |
Note: Among respondents who bought or leased a vehicle in the past year.
Likely reflecting the greater liquidity constraints of lower- and middle-income respondents, the monthly payment amount is of greater importance to consumers with lower incomes. Thirty-three percent of car buyers and leasers whose income is under $40,000, and 29 percent of those whose income is between $40,000 and $100,000, indicate that the monthly payment was their most important factor in negotiations. Among those whose income is over $100,000, 19 percent report that they prioritized the monthly payment.
These respondents who focus on having lower monthly payments when negotiating for their car may be expected have longer loan terms in order to reduce the monthly payments for a car of a given price. The survey finds some evidence that this is the case. Among buyers who indicate that a lower monthly payment was a priority when negotiating, 44 percent of those who financed their purchase took out a loan with a term longer than five years. This compares to 21 percent of those for whom the vehicle price was the main concern that took out a loan with a term of over five years (table 25).
| Factor | 0-24 months | 25-36 months | 37-48 months | 49-60 months | 61 months or longer | Don't know |
|---|---|---|---|---|---|---|
| Purchase price | 11.4 | 19.0 | 10.5 | 35.2 | 20.6 | 3.2 |
| Monthly payment | 4.7 | 20.5 | 1.3 | 28.0 | 44.0 | 1.6 |
| Upfront payment | 7.4 | 26.1 | 15.6 | 22.4 | 20.1 | 8.5 |
| Interest rate on loan | 0.0 | 11.3 | 17.9 | 13.8 | 51.9 | 5.1 |
| Length of loan | 10.8 | 0.0 | 9.9 | 24.7 | 54.6 | 0.0 |
| Trade-in amount | 0.2 | 11.5 | 24.5 | 32.7 | 28.3 | 0.0 |
Note: Among respondents who took out a loan to purchase a vehicle in the past year.
Auto Loan Performance
In order to monitor the performance of auto loans, and the characteristics of borrowers who are struggling to make their loan payment, the survey asks all respondents who own a car whether they currently owe money on loans for their vehicles. Thirty-nine percent of all respondents who own a car or truck report that they owe money on a loan for a vehicle that they own. When combined with those who lease a vehicle, 45 percent of all adults with a car or truck are making payments on at least one vehicle.
Among those respondents who are making vehicle loan or lease payments, 8 percent report that in the last year they have missed or been late making one or more car payments. The likelihood of having missed a payment is substantially higher among lower-income respondents, with 15 percent of those whose income is under $40,000 and also have an auto loan or lease indicating that they have missed one or more car payments.33
Respondents who missed an auto loan or lease payment frequently appear to also be struggling in other aspects of their financial lives. Sixty-percent of respondents with a credit card who missed an auto payment in the prior year report that they carried a balance on their credit card most or all of the time during that time--which is nearly double the rate among the general population with a credit card. Forty-four percent of credit card holders who missed an auto payment also report making only the minimum payment on their credit card most or all of the time, compared to 12 percent of the general population with a credit card that only make the minimum payment most or all of the time. Additionally, 45 percent of respondents with a mortgage who missed a car loan payment also indicate that they missed two or more mortgage payments in the last 12 months, far exceeding the 4 percent of all adults with a mortgage who missed multiple mortgage payments.
References
30. Federal Reserve Bank of New York, Quarterly Report on Household Debt and Credit (November 2015), www.newyorkfed.org/medialibrary/interactives/householdcredit/data/pdf/HHDC_2015Q3.pdf  . Return to text
31. Respondents who purchased or leased multiple vehicles in the previous year are instructed to report on the vehicle which they acquired most recently. Return to text
32. These results only include automobile loans used for the purchase of a newly acquired vehicle and do not include automobile title loans that respondents may take out to borrow money using a car that they already own as collateral. Return to text
33. Since this question is asked of respondents who currently have an outstanding auto loan or lease, it will not capture respondents who had their vehicle repossessed due to missed payments. It also will not capture respondents who were making payments during the year but have since completely paid off their loan. Return to text