
Report on the Economic Well-Being of U.S. Households in 2015
 Print
Print- Preface
- Executive Summary
- Introduction
- Overall Economic Well-Being
- Income and Savings
- Economic Preparedness and Emergency Savings
Higher Education and Human Capital
Whether an individual attends college and completes his or her degree has long been understood to be a major determinant of lifetime income and financial well-being. However, as real college costs and the percentage of students borrowing to pay for education both continue to rise, some have questioned if the relationship between higher education and lifetime returns may now be more complicated. The survey asks respondents about their educational experience, their perceptions of the value of their degree, and--among those who did not complete a college degree--why they did not continue their education. The survey also inquires about the financing of
education and the use of student loans, which is discussed in the "Education Debt and Student Loans" section of this report.
The survey results show that most adults who went to college believe that the value of their education meets or exceeds the costs, although the perceived value of higher education varies widely depending on program completion, type, and major. In particular, while respondents who have a degree from traditional public or nonprofit institutions overwhelmingly report that their education was worth the cost, perceptions of the value of one's degree are less positive among non-completers and respondents who graduated from a for-profit school.
Higher Education Decisions by Family Background
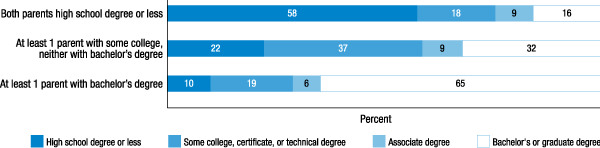
The likelihood that an individual attends college is highly correlated with the education of his or her parents. Among young adults ages 25 to 34 whose parents both have a high school degree or less, 58 percent completed no education beyond high school themselves and only 16 percent obtained at least a bachelor's degree. Among similarly aged respondents with at least one parent who received a bachelor's degree, 65 percent report that they received a bachelor's degree, whereas only 10 percent have no education beyond high school (figure 27).
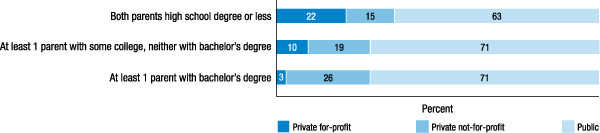
Among those who do attend college, family background also influences the type of school that they attend. Twenty-two percent of young adults ages 25 to 34 who went to college but whose parents did not report that they attended a private for-profit institution. For comparison, among respondents with at least one parent who has a bachelor's degree, 3 percent attended a for-profit institution (figure 28).34 As will be discussed later in this section and in the "Education Debt and Student Loans" section of this report, the type of institution attended appears to be correlated with both the perceived value of one's degree and the likelihood of falling behind on one's student loans.
Note: Among respondents ages 25 to 34 who completed at least some college and reported school attended.
Value of Higher Education by Educational Characteristics
In order to monitor the perceived value of higher education, the survey asks respondents who completed at least some college whether they believe that the lifetime financial benefits of their postsecondary education outweigh the lifetime financial costs. Overall, 51 percent of respondents feel that the benefits of their education exceed the costs and an additional 27 percent of respondents feel that the costs and benefits are about the same. Just 20 percent of respondents believe that the costs of this education exceed the financial benefits that it produced.
While perceptions of the value of one's education are generally positive, responses to this question vary based on the characteristics of the respondent's education. Among non-completers (respondents who attended college but failed to complete at least an associate degree), 35 percent feel that the education was worth the cost, whereas 27 percent feel that the costs outweigh the benefits.35 For those who completed at least an associate degree, the likelihood of viewing the degree as beneficial is much greater. Among these degree completers, 62 percent feel that the benefits of their education outweighed the costs, compared to just 16 percent who feel the costs outweigh the benefits.
Self-perceptions of the value of one's education also vary based on the type of institution attended. Among non-graduates, the type of institution attended has no statistically significant impact on the self-perceived value of the education. However, among those who completed their degree, substantial differences emerge based on where the individual went to school (figure 29). Over 60 percent of graduates from public or not-for-profit institutions report that the value of their degree exceeded the cost. But among graduates of for-profit institutions, only 32 percent feel that their degree was worth the cost.
Figure 29. Overall, how would you say the lifetime financial benefits of your bachelor's degree, associate degree, or most recent educational program compare to its financial costs? (by completion of at least an associate degree and institution type)
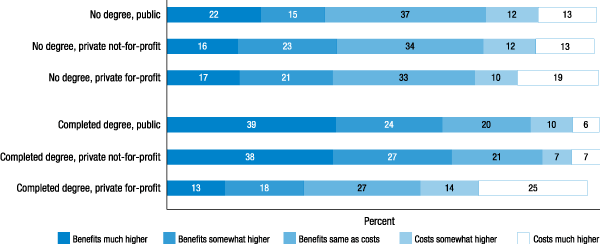
Note: Among respondents who completed at least some college and report the school attended.
Additionally, this difference is not purely due to the selectivity of the institutions. Schools attended were also analyzed by how selective (accepting a small number of applicants) or how inclusive (accepting a larger share of applicants) they are based on the Carnegie Classification™.36 Among respondents who completed a degree from a part-time or inclusive public or not-for-profit institution, 56 percent feel that the benefits outweigh the costs. Among respondents who completed a degree from a similarly inclusive for-profit institution, just 26 percent feel that the benefits exceed the costs.
As was observed in the 2014 survey, there is also some evidence from this year's survey results that the field of study impacts how respondents with similar levels of education value their degree (table 26). While sample sizes for any given degree are small, when looking just at respondents who completed at least an associate degree, those with degrees in engineering, computer science, or physical sciences are the most likely to report that the benefits of their degree exceed the costs. In contrast, respondents with at least an associate degree who majored in a vocational/technical field, social/behavioral sciences, or humanities are the least likely to report that the benefits exceed the costs. Nevertheless, across every major, those who completed at least an associate degree are more likely to say that the benefits exceed the costs than to say that the costs outweigh the benefits.
| Field of study | Benefits outweigh costs | About the same | Costs outweigh benefits |
|---|---|---|---|
| Engineering | 76.9 | 17.3 | 5.7 |
| Computer/information sciences | 73.9 | 17.4 | 7.8 |
| Physical sciences/math | 71.8 | 9.4 | 18.3 |
| Education | 67.5 | 18.4 | 14.1 |
| Life sciences | 64.7 | 19.8 | 15.5 |
| Law | 64.0 | 21.9 | 11.8 |
| Business/management | 63.9 | 21.0 | 15.0 |
| Health | 59.7 | 22.7 | 16.5 |
| Vocational/technical | 51.7 | 34.5 | 13.8 |
| Social/behavioral sciences | 49.7 | 22.7 | 27.3 |
| Humanities | 47.7 | 26.7 | 25.1 |
| Undeclared | 46.2 | 32.0 | 18.1 |
| Other | 51.2 | 17.8 | 29.2 |
| Did not state | 58.9 | 9.6 | 10.8 |
Note: Among respondents who completed at least an associate degree.
A potential determinant of whether respondents feel that the education yielded a net benefit is whether they found employment and, among those employed, if that employment is within their field of study.37 Among employed respondents who completed their degree and are employed in an occupation that is closely related to their major, 67 percent feel that their education was worth the cost. Among those who are employed, but in an unrelated or unknown occupation, 56 percent feel that their education was worth the cost. An even lower 47 percent of non-employed, non-retired degree recipients feel that their education was worth the cost (figure 30).
Figure 30. Overall, how would you say the lifetime financial benefits of your bachelor's or associate degree program compare to its financial costs? (by employment in a field related to field of study)
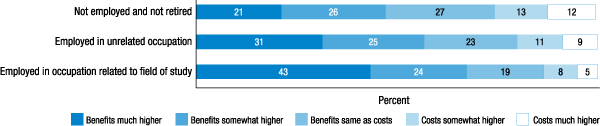
Note: Among non-retired respondents who completed at least an associate degree.
Desire to Change Educational Decisions
The responses to the question of whether one's education was worth the cost suggest that degree completion, type of institution, and choice of major all play a role in whether individuals feel that their educational investment paid off. In order to gain further insight into the dimensions on which respondents feel their educational investments were lacking, the survey also asks respondents what they would do differently if they could go back and make their educational decision again.
Among respondents who started college but did not complete their degree, over two-thirds say that, if they could make their educational choices again, they would have completed more education (table 27). Just 15 percent would have either not attended college or completed less education. Notably, even among respondents who feel that the costs of their education outweigh the benefits, 68 percent of non-graduates report that they would have completed more education, compared to 24 percent who would have completed less education or not gone to college. This suggests that many non-graduates who feel that their education was not worth the cost believe that their failure to complete a degree contributed to the low return on their investment.
| Response | Some college, certificate, or technical degree |
Associate, bachelor's, or graduate degree |
|---|---|---|
| Chosen a different field of study | 37.1 | 33.6 |
| Attended a different school | 32.3 | 22.4 |
| Completed less education or not attended college | 15.1 | 5.6 |
| Completed more education | 69.2 | 41.9 |
Note: Among respondents who completed at least some college.
Among respondents who completed at least an associate degree, the pattern of responses is similar. Forty-two percent of these respondents would have completed more education--which includes 64 percent of associate degree recipients who would have completed additional education. Only 6 percent would have either completed less education or not attended college.
This question also provides evidence that respondents who attended a for-profit institution have a higher level of regret about their choice of school than those who attended a not-for-profit or public institution. Forty-nine percent of respondents who went to a for-profit school say that they would have attended a different school if they could make their educational decisions again. This compares to 28 percent of individuals who attended a not-for-profit institution and 21 percent of individuals who attended a public institution that say they would
have attended a different school.
Reasons for Not Starting or Not Finishing College
Thirty-percent of respondents in the survey have completed at least a bachelor's degree and 13 percent have completed a certificate, technical degree, or associate degree. By contrast, 37 percent indicate that they have no education beyond high school, and an additional 20 percent have completed some college but did not complete a certificate or degree. In order to better understand the decisionmaking process of those who have no education beyond high school or who completed some college but have no certificate or degree from that education, the survey asks these respondents what influenced that enrollment decision. Respondents could select all responses that applied to their situation.
Among respondents who completed a high school degree but who did not attend college, the most
common reasons provided for why they did not attend college are that they simply were not interested (38 percent), because they wanted to work (30 percent), because they felt it was too expensive (29 percent), or because of family responsibilities (23 percent) (table 28). The reasons cited for not attending college differ, however, based on the race and ethnicity of respondents. A lack of interest is cited by 44 percent of white respondents, compared to 28 percent of non-Hispanic black respondents and 24 percent of Hispanic respondents. Hispanic respondents, instead, most frequently cite family responsibilities (39 percent) as the reason for not attending college.
| Reason | Reason for not attending college | Reason for not completing degree |
|---|---|---|
| Too expensive | 29.2 | 28.0 |
| Family responsibilities | 23.4 | 40.4 |
| Wanted to work | 30.3 | 33.5 |
| Simply was not interested in college | 37.5 | n/a |
| Simply was not interested in continuing college | n/a | 22.0 |
| Was not admitted | 1.2 | n/a |
| Low grades | n/a | 9.2 |
| Benefits were not worth the cost | 11.9 | 16.0 |
| Other | 9.3 | 14.4 |
Note: Among respondents who did not attend college or did not complete degree and are not currently enrolled in school.
n/a Not applicable.
Turning to students who attended college but did not finish and are no longer enrolled, family responsibilities are the most common reason cited for leaving college without a degree. This is consistent with the results from the 2014 survey. Forty percent of respondents who did not complete a degree report that family responsibilities contributed to this decision. This compares to 34 percent who say that they left school because they wanted to work, 28 percent who felt it was too expensive, and 22 percent who were simply not interested in continuing. Among women who left college without their degree, a somewhat higher 44 percent say that family responsibilities contributed to this decision.
In order to better understand the details of family responsibilities that prevent the completion of college, respondents who cite family responsibilities as a reason why they did not attend or complete college are asked to provide additional details regarding these responsibilities. Just under half of those who cite family responsibilities mention their children or parental responsibilities as a reason for the decision to not continue college when presented with the follow-up question. Seventeen percent include a mention of their parents--often indicating that they had to care for an elderly parent or take on the responsibilities of a parent who has died. Additionally, 18 percent mention a marriage or divorce, 14 percent mention money or bills, and 9 percent explicitly mention a death or illness in the family.38
Women are much more likely than men to cite children or parental responsibilities as the family responsibility that kept them from attending or completing college. Fifty-five percent of women (and 58 percent of women under age 45) who cite family responsibilities as a reason for this decision reference children or parental responsibilities in the follow-up question. Thirty-five percent of men (and 32 percent of men under age 45) who left college due to family responsibilities include children and parental responsibilities in their explanation.
Job Readiness
One of the primary objectives of higher education is to provide individuals with the human capital necessary for them to contribute to the workforce and fulfill their career objectives. In order to assess respondents' current readiness for the job market, non-retirees are asked about their level of confidence in having the skills necessary to get the kind of jobs that they want. Thirty-five percent of respondents report that they are very confident that they have the skills necessary for the kinds of jobs that they want today, and 37 percent report that they are somewhat confident. This represents an improvement from the 28 percent of respondents who were very confident and 39 percent who were somewhat confident about their job skills when this question was last asked in 2013.39
Confidence in having the appropriate skills for the labor market differs, however, based on the level of education of the respondent. As one's education level increases, confidence in having the appropriate skills necessary for today's labor market increases as well (table 29).
| Education level | Very confident | Somewhat confident | Not confident | Not employed and not looking |
Don't know |
|---|---|---|---|---|---|
| Less than a high school degree | 15.1 | 27.8 | 19.9 | 26.3 | 11.0 |
| High school | 29.0 | 36.7 | 17.2 | 11.3 | 5.8 |
| Some college, certificate, or technical degree | 28.5 | 40.6 | 17.0 | 11.0 | 2.9 |
| Associate degree | 39.0 | 38.6 | 12.5 | 5.6 | 4.3 |
| Bachelor's or graduate degree | 50.2 | 37.1 | 7.9 | 3.4 | 1.3 |
Note: Among non-retired respondents.
Respondents who are not confident that they have the appropriate skills for the job market are then asked for the reasons why they lack confidence. Just over half (52 percent) feel that they need more education, followed by needing additional job training (37 percent). Twenty-six percent of respondents who feel they lack the appropriate job-market skills think that their skills are out of date, 26 percent feel that the job market is changing faster than they can keep up, and 17 percent think that the kind of job that they are qualified for is not available. Likely reflecting their different positions in the life cycle of skill acquisition, younger respondents, ages 18 to 29, disproportionately report that they either need more education or more job training, whereas older respondents, age 45 and older, disproportionately report that their skills are out of date or that the job market is changing faster than they can keep up (table 30).
| Reason | 18-29 | 30-44 | 45-59 | 60+ | Overall |
|---|---|---|---|---|---|
| Need more education | 64.9 | 58.9 | 38.3 | 32.3 | 52.0 |
| Need more job training | 49.3 | 37.7 | 29.4 | 19.7 | 37.2 |
| Skills are out of date | 11.6 | 30.0 | 33.3 | 38.5 | 25.8 |
| Job market changing faster than I can keep up | 15.4 | 22.9 | 39.1 | 31.8 | 26.2 |
| The kind of job I'm qualified for is not available | 14.4 | 15.4 | 17.1 | 25.3 | 16.6 |
Note: Among respondents who are not confident that they have the skills necessary to get the kinds of jobs that they want now.
References
34. Recognizing the relatively small sample size of young adults who attended college but whose parents did not, these calculations were also considered for a broader age band of respondents--ages 25 to 44. When doing so, the results are consistent with those presented here. Return to text
35. When limiting the sample to those who have not completed an associate degree and who are not currently enrolled, 31 percent feel that their education was worth the cost and 27 percent feel that the costs outweigh the benefits. Return to text
36. The Carnegie Classification⢠defines selective institutions as those whose first-year students' test scores place most of these institutions in roughly the middle two-fifths of baccalaureate institutions and more selective institutions as those whose first-year students' test scores place these institutions in roughly the top fifth of baccalaureate institutions. Inclusive institutions extend educational opportunities to a wide range of students with respect to their academic preparation. For more details on the Carnegie Classification, see http://carnegieclassifications.iu.edu/  . Return to text
37. Occupations are classified as being closely related to the field of study by meeting one of two criteria. Using the self-reported occupation and field of study in the SHED data, an occupation and field are considered closely related if either (1) the occupation is the most commonly reported occupation among respondents with that field of study or (2) the field of study is the most commonly reported field among degreed workers of that occupation. Return to text
38. References to children or parental responsibilities include mentions of the words child, baby, kid, twins, babies, son, daughter, pregnant, single mother, single mom, single father, single dad, single parent, start a family, or starting a family. References to one's own parents are those that do not include the references to children listed above, but mention any of the terms parent, mom, dad, mother, father, grandma, or grandpa. References to an illness or death include those that mention sick, ill, illness, disease, disability, elderly, health, Alzheimer's, death, died, or widow. References to divorce or marriage include mentions of the terms divorce, married, marriage, spouse, engaged, fiancé, or fiancée. References to money and bills include mentions of the terms money, cost, afford, expensive, or bills. Results on these text responses are all unweighted. Return to text
39. The 2013 survey excluded respondents who are out of work due to a disability from this question. Since these respondents are less likely to exhibit confidence that they have the skills necessary for the current job market, excluding them from the 2015 numbers for comparability would result in an even larger improvement. Among non-retired, non-disabled respondents in 2015, 37 percent are very confident that they have the skills necessary for the kinds of jobs that they want today and 40 percent are somewhat confident. Return to text