
Report on the Economic Well-Being of U.S. Households in 2015
 Print
Print- Preface
- Executive Summary
- Introduction
- Overall Economic Well-Being
- Income and Savings
- Economic Preparedness and Emergency Savings
Economic Preparedness and Emergency Savings
A key consideration regarding household finances and overall economic well-being is the ability to withstand financial disruptions. Just under one-fifth of adults indicate that they experienced a financial hardship in the prior year, and many Americans remain ill-prepared for such a financial disruption. While slightly more Americans have a safety net to withstand a small financial disruption than was the case in recent years, nearly half lack the resources to easily handle such an event. This lack of a financial safety net appears to have negative repercussions for some individuals when they face a financial challenge. Over one-quarter of respondents report having gone without medical treatment due to an inability to pay, and almost half of those who had an unexpected out-of-pocket medical expense in the prior year report that they currently have unpaid debt from that expense.
Financial Hardships
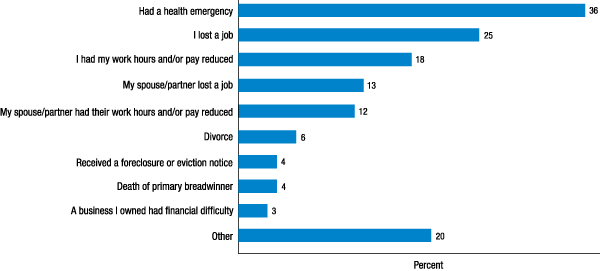
Eighteen percent of respondents indicate that either they, or their family living with them, experienced some form of financial hardship in the previous year. This is a 6 percentage point improvement over that seen in the 2014 survey, when 24 percent of respondents indicated that they experienced some form of financial hardship. Among those who experienced a hardship, 35 percent report that either they or their spouse or partner lost a job (3 percent indicate that both they and their spouse or partner lost a job). Twenty-six percent say that either they or their spouse or partner had their work hours cut, 36 percent had a health emergency, and 4 percent received a foreclosure or eviction notice (figure 10).
Figure 10. Which of the following economic hardships did you or your family living with you experience in the past year?
Many individuals who experienced a financial hardship in the prior year indicate that over the same time frame they also drew down savings, undertook some form of borrowing, or both. Respondents who experienced a hardship, and particularly lower-income respondents who experienced a hardship, are more likely to report borrowing through an alternative financial service such as a tax refund anticipation loan, pawn shop loan, payday loan, auto title loan, or paycheck advance (table 9). Respondents who experienced a financial hardship are also almost twice as likely to have borrowed from, or withdrawn funds from, their retirement account as those who did not experience a hardship. Fifteen percent of non-retirees who experienced a hardship report that they borrowed from and/or cashed out a retirement account in the prior year, whereas 8 percent of those who did not experience a hardship borrowed from and/or cashed out their retirement savings.
| Income category | Among respondents who report a hardship | Among respondents who do not report a hardship |
|---|---|---|
| Less than $40,000 | 20.5 | 8.1 |
| $40,000-$100,000 | 11.0 | 3.7 |
| Greater than $100,000 | 9.3 | 1.2 |
| Overall | 16.5 | 4.7 |
Emergency Savings
In order to assess individuals' preparedness for a financial hardship should one occur, the survey asks respondents several questions related to their ability to withstand emergencies of varying levels of severity. The results differ by the severity of the emergency presented, but, overall, many individuals appear ill-prepared for financial emergencies that may arise.
When asked if they have set aside an emergency or rainy day fund that would cover three months of expenses, nearly half of respondents (47 percent) indicate that they do. However, it is possible that personal savings alone do not fully reflect the way that individuals prepare for such a large financial disruption. Some individuals may, instead, expect to borrow or rely on others in these instances. To capture this possibility, respondents who do not have three months of emergency savings are asked the follow-up question, "If you were to lose your main source of income (e.g., job, government benefits), could you cover your expenses for 3 months by borrowing money, using savings, selling assets, or borrowing from friends/family?" An additional 21 percent of respondents indicate that they could cover three months of expenses using this broad array of options.
When combining the 21 percent of adults who indicate they could cover three months of expenses using assets or borrowing with the 47 percent who could cover three months of expenses using their personal savings, 68 percent of all respondents report that they would be prepared for a three-month financial disruption. Just under one-third of respondents in the 2015 survey indicate that they would not be prepared for a three-month long financial disruption and could not cover their expenses in such a situation, even by borrowing. This is nearly unchanged from the 32 percent of respondents in the 2014 survey who indicated that they could not cover their expenses in such a situation by borrowing.
To determine individuals' preparedness for a smaller-scale financial disruption, respondents are asked how they would pay for a hypothetical emergency expense that would cost $400. Just over half (54 percent) report that they could fairly easily handle such an expense, paying for it entirely using cash, money currently in their checking/savings account, or on a credit card that they would pay in full at their next statement (collectively referred to here as "cash or its functional equivalent"). The remaining 46 percent indicate that such an expense would be more challenging to handle and that they either could not pay the expense or would borrow or sell something to do so.
Specifically, among respondents who would not pay the expense in-full using cash or its functional equivalent, 38 percent would use a credit card that they pay off over time and 31 percent simply could not cover the expense. Over a quarter would borrow from friends or family, and smaller fractions would either sell something, use a payday loan, bank overdraft, or bank loan (figure 11).
Figure 11. Ways that individuals will cover a $400 emergency expense when not using cash or its functional equivalent
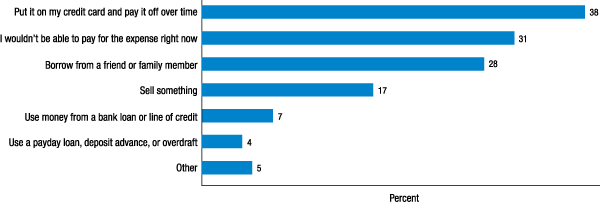
Note: Among those who would not pay the expense in-full using cash or its functional equivalent.
The fraction who indicate that they would pay for an emergency expense using cash or its functional equivalent is quite similar to that seen in 2014, when 53 percent said that they would pay for a $400 expense in this way. However, it does represent a continued modest improvement from that seen in 2013, when 50 percent of respondents indicated that they would use cash or its functional equivalent to cover an emergency expense of this magnitude.
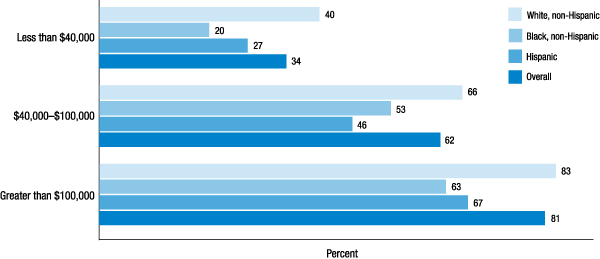
The approach to paying a $400 emergency expense varies substantially by income, and by the race and ethnicity of the respondent. Only 34 percent of respondents whose family income is under $40,000 would pay the $400 expense using cash or its functional equivalent, far below that seen among those in the higher-income groups (figure 12). Similarly, while 61 percent of non-Hispanic white respondents say that they would pay such an expense using cash or its functional equivalent, a lower 38 percent of Hispanic respondents and 36 percent of non-Hispanic black respondents would pay this way.
Figure 12. Respondents who would completely pay an emergency expense that costs $400 using cash or a credit card that they pay off at the end of the month (by family income, race, and ethnicity)
There also is some evidence that respondents differ in how they would pay for this type of expense based on their gender and marital status. While married men and women are likely to report that they would pay for this sort of modest emergency expense using cash or its functional equivalent at relatively similar rates, the same is not true for unmarried respondents. Unmarried women--and particularly those who are widowed, never married, or unmarried but living with a partner--are more likely to report that they could not pay a $400 expense or would use some form of borrowing than are men with an equivalent marital status (table 10).
Table 10. Respondents who would completely pay an emergency expense that costs $400 using cash or a credit card that they pay off at the end of the month (by gender and marital status)
Percent
| Marital status | Men | Women |
|---|---|---|
| Married | 65.3 | 63.2 |
| Widowed | 65.7 | 41.8 |
| Divorced/separated | 41.8 | 38.3 |
| Never married | 46.2 | 40.7 |
| Living with partner | 58.7 | 34.4 |
| Overall | 57.4 | 51.5 |
Respondents who indicate that they would pay the $400 expense using resources other than cash or its functional equivalent are also asked what the largest expense is that they could cover using cash on hand or money in their bank account. Thirty-nine percent of these respondents report that the largest expense that they could cover using cash on-hand is under $100. A further 16 percent indicate that they could only cover an expense between $100 and $200, and 22 percent could cover an expense between $200 and $400. The remaining 22 percent report that they could cover over a $400 expense--suggesting that for this subset of respondents, paying the $400 expense in-part or in-full by using other means reflects a preference of payment methods rather than a necessity.16
Insurance against Financial Risks
An additional way that individuals can insulate themselves from the negative repercussions of a financial shock is through insurance policies that cover specific economic risks. Respondents in the survey are asked whether they currently have various types of insurance. The vast majority of adults indicate that they have health insurance, auto insurance, and--among those who own their home--homeowners insurance. Just over half report having life insurance. However, only one-quarter have disability insurance and fewer than one in seven have long-term care insurance (table 11).
| Insurance type | Less than $40,000 | $40,000- $100,000 |
Greater than $100,000 | Overall |
|---|---|---|---|---|
| Health insurance | 74.5 | 92.4 | 98.4 | 86.1 |
| Auto/car insurance | 66.4 | 92.5 | 97.8 | 82.6 |
| Homeowners or renters insurance | 40.9 | 79.6 | 92.6 | 66.3 |
| Life insurance | 32.5 | 64.6 | 80.5 | 54.6 |
| Disability insurance | 11.0 | 27.4 | 47.4 | 25.1 |
| Long-term care insurance | 6.6 | 15.5 | 22.7 | 13.3 |
| Funeral insurance | 8.8 | 8.2 | 8.0 | 8.4 |
Consistent with the likelihood of having emergency savings, the odds that an individual has insurance against financial hardships is highly correlated with income. The highest-income respondents, whose family income is over $100,000, are more than three times as likely to have long-term care insurance and more than four times as likely to have disability insurance as those whose family income is under $40,000. They also are more likely to have health insurance, auto insurance, and homeowners or renters insurance. The only category of insurance where there was not a substantial difference in coverage rates by income was funeral insurance, which is held by 8 percent to 9 percent of adults of each income level.
Emergency Spending on Health Care
Although emergency expenses can take many forms, out-of-pocket expenses for health care are a particular concern for many individuals. Twenty-two percent of respondents experienced what they describe as a major unexpected medical expense that they had to pay out of pocket in the 12 months prior to the survey.
Among those who report that they had a major unexpected medical expense, the median out-of-pocket cost was $1,200 and the mean was $2,782.17 Consistent with the earlier finding that many adults are ill-prepared for modest financial shocks, 46 percent of those who report a major out-of-pocket medical expense in the prior year also indicate that they currently have debt or unpaid balances related to these medical expenses.
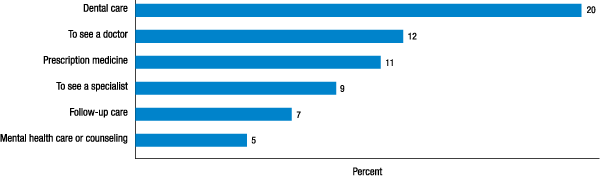
Many respondents also report that they went without some type of care because they were unable to afford it. One-fifth of all respondents went without dental care in the prior 12 months because they could not afford it. Twelve percent went without a doctor visit, 11 percent went without prescription medicine, and 9 percent went without a visit to a specialist (figure 13). Overall, 27 percent of respondents report going without at least one of these types of care because they could not afford it. This is a statistically significant decline relative to the 31 percent of respondents in the 2014 survey who reported that they forewent medical care.
Figure 13. During the past 12 months, was there a time when you needed any of the following, but did not get it because you could not afford it?
The likelihood of foregoing medical care due to cost is inversely correlated with one's income. Among those whose family income is under $40,000, 39 percent have gone without some form of medical treatment in the preceding 12 months. This fraction is 23 percent among respondents with incomes between $40,000 and $100,000, and just 10 percent among respondents making over $100,000.
One potential avenue for alleviating this inability to cover health care expenses is through health insurance, which can reduce the probability of large expenses and/or the hardship from such expense. However, while having health insurance reduces the probability of foregoing medical treatment due to an inability to pay, it does not eliminate it. Among unin-sured respondents, 47 percent report that they had gone without some form of medical treatment in the preceding 12 months. This compares to 24 percent of respondents who have health insurance report that they went without some form of medical treatment in the same period.18
The impact of insurance on the likelihood of missing medical treatments differs based on one's income. Among respondents with incomes below $40,000, those with health insurance are 10 percentage points less likely to have foregone medical treatment than those who are uninsured (figure 14). This is well below the 29 percent difference in treatment-avoidance rates between those with and without insurance for those whose income is over $40,000.19 However, it cannot be determined from these results whether this difference reflects coverage gaps in insurance policies or if it results from an inability of some lower-income individuals to afford the copayments and coinsurance on procedures for which they are insured.
Figure 14. During the past 12 months, was there a time when you needed medical treatment, but did not get it because you could not afford it? (by family income and health insurance status)
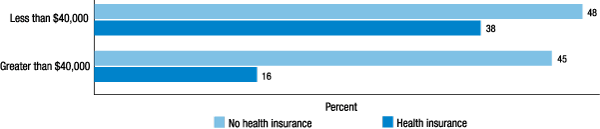
Note: The $40,000-$100,000 and greater than $100,000 income categories are combined due to the small number of respondents with an income over $100,000 who lack health insurance.
References
16. It is also possible, however, that some who say that they could pay $400 or more using cash or its functional equivalent but would pay another way are making that choice not due to a payment preference, but instead because the cash is reserved for other bills that would otherwise go unpaid. This possibility cannot be observed directly in the survey. Return to text
17. The mean is higher than the median due to a long right-tail of the distribution, including one respondent reporting that his or her out-of-pocket medical expenses were $1,000,000 in the last 12 months. Excluding this extreme case, the mean out-of-pocket medical expense for those who reported one was $2,383. Return to text
18. Since the survey asks respondents about their current health insurance status, but also asks about whether they missed medical treatments in the previous year, it is possible that some respondents who currently have insurance were uninsured at the point at which they were unable to afford treatment. Return to text
19. The two higher-income groups are combined due to the very small number of respondents with incomes over $100,000 who lack insurance. Return to text
