Consumers and Mobile Financial Services
March 2016
- Preface
- Executive Summary
- Introduction
- Accessing Financial Services
Accessing Financial Services
Survey respondents were given a set of screening questions that asked if they had access to a bank account, the Internet, and a mobile phone. They were further asked about the various ways in which they access their financial accounts. Of the 91 percent of American consumers who have a checking, savings, or money market account, the majority use some form of technology to interact with their financial institution. (For a discussion of Internet access among Mobile Survey respondents, see box 1.)
As shown in figure 2, the most common way of interacting with a financial institution is in-person at a branch, with 84 percent of consumers who have a bank account reporting that they had visited a branch and spoken with a teller in the 12 months prior to the survey.7 The second-most common means of access in the previous 12 months was using an automated teller machine (ATM) at 75 percent, followed by online banking at 71 percent. Thirty-eight percent of all consumers with bank accounts used mobile banking, up from 35 percent the previous year, while 30 percent used telephone banking.8
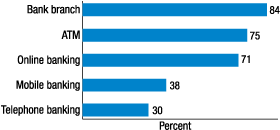
Note: Among respondents with a bank account, regardless of mobile phone ownership or access to the Internet (n=2,373). For mobile banking, the percentage here differs from the incidence rates elsewhere in this report because the latter are computed for those with mobile phones and bank accounts.
The share of respondents with bank accounts who use mobile banking has risen steadily since the 2011 Mobile Survey, surpassing the use of telephone banking.9 Although use of online banking has risen modestly over this period, use of the bank channels other than mobile has been generally consistent. Because these measures capture use of a channel in the past year--not frequency of use or activities over time and across channels--they cannot adequately capture the possible substitution between mobile banking and other ways of interacting with a financial institution. Yet, they suggest that most consumers appear to be making use of multiple bank channels, and that for many who have adopted it, mobile banking is a complement to other ways of conducting banking business.
Box 1. Internet Access among Mobile Survey Respondents
While smartphones are one of the more recent technological innovations transforming the ways consumers conduct their finances, laptop and desktop computers are still important avenues for interacting with financial institutions, searching for financial and other types of information, and purchasing goods and services. In addition to asking questions about mobile and smartphone ownership, the Mobile Survey includes questions about Internet connectivity on desktops, laptops, and tablets to gauge the range of options respondents may have for using technology for financial services.
For panelists who are recruited to join KnowledgePanel ® but indicate they do not have Internet access, GfK provides basic Internet service and a web-accessible device so they can participate in surveys. To measure Internet access, the 2015 Mobile Survey asked respondents if they currently have regular access to the Internet at home that is not provided by GfK. To identify respondents who have Internet access other than what may be available through a smartphone, the question explicitly asked about use of the Internet on a computer (desktop, laptop) and a tablet (e.g., iPad). A similar question also asked about respondents' access to the Internet using a desktop, laptop, or tablet away from home--such as at school, work, a public library, etc.
As a group, 2015 Mobile Survey respondents have high rates of Internet connectivity apart from any basic service that may be provided by GfK. Fifty-four percent reported having access both at home and away from home. Another 28 percent have regular access at home only, and 7 percent have regular access only away from home. Ten percent of respondents did not report any access to the Internet on a desktop, laptop, or tablet. In sum, 82 percent of respondents had regular access to the Internet at home on a desktop, laptop, or tablet computer as of November 2015.1
Respondents with Internet access at home are more likely to own mobile phones, particularly smartphones (figure A). Eighty percent of those who have access to the Internet on a desktop, laptop, or tablet both at home and away from home have smartphones, and 60 percent of those who have Internet access only at home have smartphones. Smartphone ownership rates among those respondents who do not have Internet access at home are lower, but still substantial: 45 percent for those who only have access to the Internet using a desktop, laptop, or tablet away from their home and 31 percent for those who do not have access at all.
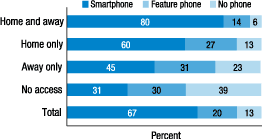
Note: Among all respondents (n=2,510). Here and elsewhere in this report, totals may not add to 100 percent due to rounding and
question non-response.
Most survey respondents appear to have the option of interacting with their financial institutions through home Internet and/or smartphone connections, which can open access to a range of services, as well as product information. However, those who are reliant on Internet access away from home or who have no regular Internet access also are less likely to have smartphones or even basic feature phones and, thus, may face greater obstacles in obtaining financial services through online and mobile channels.
1. While the Mobile Survey's measures of Internet access are not directly comparable to other surveys, a general comparison may be useful for context. Estimates from the American Community Survey (ACS) show that 80 percent of U.S. households had Internet access at home in 2014, up from 79 percent in 2013. In addition to differences in the years the data were collected, survey coverage, question wording, and sampling unit (i.e., adult versus household) there are other differences in the measures. For example, unlike questions on the ACS, the Mobile Survey did not ask about the type of connection (i.e., broadband, mobile, or dialup). For discussion of the 2013 ACS estimate, see www.census.gov/history/pdf/2013comp-internet.pdf; the 2014 ACS figure is a Board staff calculation using estimates from the Census Bureau's American FactFinder tool. Return to text
Mobile Banking
In this Section:
The Mobile Survey defines mobile banking as using "a mobile phone to access your bank or credit union account. This can be done either by accessing your bank or credit union's web page through the web browser on your mobile phone, via text messaging, or by using an app downloaded to your mobile phone." This section takes a more detailed look at mobile banking usage, focusing on mobile banking adoption, activities, and motivations for use.
Adoption Rates
The adoption of mobile banking has continued to increase in the past year. When asked about usage in the previous 12 months, 43 percent of mobile phone users with a bank account reported that they used mobile banking, a proportion that has been steadily climbing (figure 1). Mobile banking among smartphone users with a bank account is higher at 53 percent. The higher incidence of mobile banking adoption among smartphone users suggests that as smartphone adoption continues to increase, mobile banking usage may also increase.
A significant fraction of mobile banking users have only recently adopted the technology. Although the majority of mobile banking users reported that they started using it more than one year ago, 9 percent reported that they adopted mobile banking in the last six months, and 14 percent reported that they adopted mobile banking between six and twelve months ago. Among those consumers with mobile phones who do not currently use mobile banking, 12 percent reported that they will "probably" or "definitely" use mobile banking in the following 12 months.
By examining responses from individuals who participated in both the 2014 and 2015 surveys, it is possible to compare reported mobile banking use from year to year. Among panel respondents with a mobile phone and a bank account in both surveys, most were consistent in their use (or lack of use) of mobile banking from year to year: 32 percent used mobile banking in both years, and 53 percent did not use mobile banking in either year. However, a small share reported a change between the surveys: 4 percent were mobile banking users in 2014, but reported that they had not used mobile banking in 2015, and 9 percent adopted mobile banking in 2015, implying a net increase in use among these panel respondents of approximately 5 percentage points.
Although previous surveys suggest that the reported adoption intentions of the respondents do not perfectly reflect subsequent behavior, there is an association between the planned use of mobile banking and subsequent adoption. Using the panel of respondents to both the 2014 and 2015 Mobile Surveys, it is possible to compare stated adoption intentions in 2014 to the reported use of mobile banking in 2015.
Of those consumers with a mobile phone and bank account in both years who reported in 2014 that they would "definitely" or "probably" adopt mobile banking in the following 12 months, 40 percent reported in the 2015 survey that they had used mobile banking during the previous 12 months. This is a higher proportion than those who said they did not expect their activity to change. Among those with a mobile phone and bank account in both years and indicated that they "probably will not" and "definitely will not" adopt mobile banking, 18 percent and 5 percent, respectively, reported in the 2015 survey that they had, in fact, used mobile banking in the previous 12 months.
For the group of respondents in the 2014 survey who believed they "definitely" or "probably" would use mobile banking in the coming year, the most notable difference between those who reported using mobile banking in the 2015 survey and those who did not was that the adopters were more likely to own a smartphone. Of this likely-to-adopt group, 41 percent with smartphones in 2015 used mobile banking, while 13 percent with feature phones used mobile banking.10 In both the panel and cross-sectional data, smartphone users were more likely to engage in mobile banking than non-smartphone users.
In every year of the survey, older consumers have consistently been less likely to use mobile banking than younger consumers (table 3). For those with a mobile phone and a bank account, results from the 2015 survey indicate that mobile banking use is 67 percent for those in the 18-to-29 age range and 58 percent for those in the 30-to-44 age group. By comparison, only 18 percent of individuals ages 60 or older reported having used mobile banking. Usage has generally increased from year to year for all age groups. These differences by age reflect both the higher share of younger age groups who are smartphone owners, as well as differences in the propensity to use mobile banking for those with a given type of phone. Among smartphone owners, this pattern of higher mobile banking adoption for the younger age groups is still very apparent.
Table 3. Use of mobile banking in past 12 months by age
Percent, except as noted
| Age group | 2011 | 2012 | 2013 | 2014 | 2015 |
|---|---|---|---|---|---|
| 18-29 | 45 | 54 | 63 | 60 | 67 |
| 30-44 | 29 | 37 | 43 | 54 | 58 |
| 45-59 | 12 | 21 | 25 | 32 | 34 |
| 60+ | 5 | 10 | 9 | 13 | 18 |
| Total | 22 | 29 | 33 | 39 | 43 |
| Number of respondents | 1,859 | 2,180 | 2,187 | 2,437 | 2,151 |
Note: Among those with a mobile phone and a bank account.
Consistent with the data from previous surveys, minorities continue to be more likely to use mobile banking than non-Hispanic whites. In particular, Hispanic mobile phone users with bank accounts show a higher rate of use of mobile banking (56 percent) relative to mobile phone users with bank accounts overall (43 percent) (table 4).
Table 4. Use of mobile banking in the past 12 months by race/ethnicity
Percent, except as noted
| Race/ethnicity | 2011 | 2012 | 2013 | 2014 | 2015 |
|---|---|---|---|---|---|
| White, non-Hispanic | 19 | 26 | 30 | 34 | 37 |
| Black, non-Hispanic | 35 | 39 | 42 | 43 | 50 |
| Other, non-Hispanic | 23 | 31 | 35 | 48 | 55 |
| Hispanic | 29 | 36 | 45 | 53 | 56 |
| 2+ races, non-Hispanic | 21 | 36 | 31 | 41 | 46 |
| Total | 22 | 29 | 33 | 39 | 43 |
| Number of respondents | 1,859 | 2,180 | 2,187 | 2,437 | 2,151 |
Note: Among those with a mobile phone and a bank account.
Among those with a mobile phone and bank account, mobile banking use is more common for those with higher levels of education. Usage for those with a college degree or some college (47 percent) is greater than for those with a high school degree or less (35 percent). In addition, mobile banking usage for those mobile phone users with bank accounts with household incomes of $40,000 and above (45 percent) is greater than for those with incomes below $40,000 (38 percent). (For further discussion about mobile banking use among the unbanked and underbanked, see box 2).
Box 2. Banking Status and the Use of Mobile Banking and Payments
The relatively high prevalence of mobile phone and smartphone use among younger generations, minorities, and those with low levels of income--groups that are more likely to be unbanked or underbanked--makes mobile phones a potential platform for expanding financial access and inclusion.
In the 2015 Mobile Survey, 9 percent of respondents were unbanked, having reported that neither they nor their spouse have a checking, savings, or money market account.1 Twenty-two percent of consumers were underbanked in 2015--defined here as having a bank account but also using an alternative financial service (typically from a nonbank provider), including a money order, check-cashing service, tax refund anticipation loan, pawn shop loan, payday loan, auto title loan, or a paycheck advance/deposit advance.2 The remaining share of consumers who reported having a bank account but not using one of these alternative financial services (the "fully banked" group) was 69 percent.
Among both the unbanked and underbanked groups, transaction-based products such as money orders and check-cashing services were the primary types of alternative financial services used. Fifty-one percent of the unbanked and 92 percent of the underbanked reported using at least one of these two financial services, with money orders being more common. Usage of credit-based products--tax refund anticipation loans, pawn shop loans, payday loans, auto title loans, or a paycheck advance/deposit--is much lower, with 14 percent of the unbanked and 29 percent of the underbanked having reported utilizing at least one of these services. Fifty-six percent of the unbanked (and, by definition, 100 percent of the underbanked) used at least one type of alternative financial service.
Seventy percent of both the underbanked and fully banked groups reported owning a smartphone, whereas only 40 percent of the unbanked consumers do the same. Though unbanked respondents reported higher ownership rates of feature phones, the percentage of unbanked consumers with no phone (32 percent) was much higher than both the underbanked (13 percent) and fully banked (10 percent) groups (figure A).

Note: Among respondents who were fully banked (n=1,941), underbanked (n=425), and unbanked (n=128).
Among the mobile phone owners, underbanked consumers were much more likely to report being either a mobile banking or mobile payments user than fully banked respondents (figure B). Fifty-five percent of underbanked consumers with mobile phones reported using mobile banking, and 34 percent reported using mobile payments. These figures compare with only 39 percent of the fully banked respondents with mobile phones using mobile banking and 20 percent using mobile payments.3
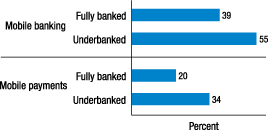
Note: Among respondents with a mobile phone who were fully banked (n=1,762) and underbanked (n=382).
Some of the observed differences in the use of mobile financial services across these groups may be the result of differences in demographics. The underbanked have much higher percentages of younger adults, with 55 percent of the underbanked being between the ages of 18 and 44. This compares to only 42 percent of the fully banked group being in this same age range. Racial and ethnic differences are also notable across the different groups. Just 19 percent of the fully banked respondents are non-Hispanic black or Hispanic, whereas 45 percent of the underbanked group identified themselves as such.
1. In 2015, the wording of the bank account question was changed from that used in earlier years, so the measure of the unbanked is not comparable to the prior years. The 2015 question wording, which conforms to the language from the Board's Survey of Household Economics and Decisionmaking, was, "Do you ["and/or your spouse" / "and/or your partner"] currently have a checking, savings, or money market account?" In the 2013 and 2014 surveys, the question about bank accounts was, "Do you or does your spouse/partner currently have some type of bank or credit union account such as a checking, savings, or money market account?" Return to text
2. Due to changes in the questions about the use of alternative financial services in different years of the Mobile Survey, the 2015 figure for underbanked households is not directly comparable to results from earlier years. Of particular note is the inclusion of paycheck advance/deposit advance as an alternative financial service, despite this type of service being available at some banks. Also, the list of alternative financial services included in this survey differ from those included in the FDIC's work on unbanked and underbanked groups, and thus comparability of underbanked figures across the two surveys must be approached with these differences in mind. Return to text
3. Due to the small sample size and inconsistencies in response patterns for mobile payments questions among the unbanked respondents, estimates of mobile payments use for the unbanked are not included. Return to text
Common Mobile Banking Activities
Among those who reported using mobile banking in 2015, the most common mobile banking activity was checking financial account balances or transaction inquiries, with 94 percent of mobile banking users having performed this function in the 12 months prior to the survey (figure 3).11 This was followed by transferring money between accounts, which was performed by 58 percent of users. In addition, 56 percent of mobile banking users received an alert from their financial institution through a text message, push notification, or e-mail. Depositing a check to an account electronically using a mobile phone camera (known as remote deposit capture) and making an online bill payment from a bank account using a mobile phone were the next most common activities, done by 48 percent and 47 percent of mobile banking users, respectively. Mobile banking users appear to be using mobile applications to conduct their banking transactions, as 82 percent of mobile banking users have installed their bank's application on their phones.
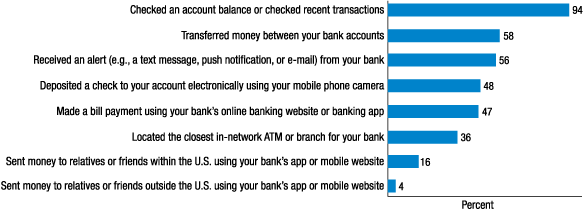
Note: Among respondents with a mobile phone and bank account who used mobile banking in the past 12 months (n=801).
Among all mobile banking users, the frequency of mobile banking use has been relatively consistent over the past several years. Among those who used mobile banking in the month prior to the survey, the median reported usage was five times per month in 2015 and 2014, and four times per month in 2013. Median usage for those with bank accounts who reported using mobile banking was also five times per month in both 2011 and 2012.
Among mobile banking users, there is variation in how frequently people use mobile banking services, and what types of activities they engage in. A relatively small share of mobile banking users (9 percent) indicated that they had used mobile banking in the previous year but had not used it in the previous month.
These low-intensity users have a lower likelihood of engaging in all types of mobile banking activities, relative to mobile banking users overall. Like all mobile banking users, the most common task for low-intensity users is checking account balances or recent transactions (71 percent). Forty-four percent of the low-intensity users have their bank's mobile banking app on their phone--a sizeable share, but far lower than the 82 percent of all mobile banking users who have installed their bank's app in their mobile phone. A greater proportion of low-intensity mobile banking users are non-Hispanic white (68 percent) compared to all mobile banking users (58 percent). Further, a greater proportion of low-intensity mobile banking users are ages 45 or older (43 percent), relative to all mobile banking users (32 percent).
In contrast, high-intensity users--defined here as mobile banking users who have conducted mobile banking tasks more than 10 times during the month prior to the 2015 survey--tend to conduct all mobile banking tasks at the same or higher rates than the larger group of users.12 In particular, high-intensity users reported transferring money between their own accounts, making bill payments using their bank's mobile website or banking app, receiving alerts, and locating an ATM or branch for their bank at much higher rates than all mobile banking users. High-intensity users include greater shares of younger and Hispanic mobile banking users, relative to all mobile banking users.
Reasons for Using--or Not Using--Mobile Banking
Convenience continues to be the most common reason consumers give for adopting mobile banking. Indeed, 39 percent of consumers indicated that the convenience was the main reason they started using mobile banking (figure 4). Twenty-six percent of consumers said getting a smartphone was the main reason for using mobile banking. A further 19 percent of consumers indicated that the timing of their adoption of mobile banking was driven by their bank starting to offer the service.
Among those consumers with mobile phones and bank accounts who do not currently use mobile banking, several reasons for not using the service predominated--namely, they believe that their banking needs are being met without mobile banking (88 percent), they do not see any reason to use mobile banking (78 percent), and they are concerned about security (73 percent). The small size of the mobile phone screen was cited by 43 percent of consumers as the reason they do not use mobile banking. This was followed by a lack of trust in the technology (40 percent) and not having a smartphone (27 percent) as reasons for not using mobile banking. Less commonly cited reasons included the difficulty associated with using mobile banking (18 percent) and not doing the banking in the household (15 percent).

Note: Among respondents with a mobile phone and bank account who used mobile banking in the past 12 months (n=801).
The reasons respondents have given for not using mobile banking have been generally consistent among the 2013, 2014, and 2015 surveys. However, over time, a smaller share of respondents have reported that not having a smartphone (44 percent in 2013, 32 percent in 2014) was a reason why they had not used mobile banking. (For more information on the use of various banking channels by smartphone users, see box 3.)
Consumers who indicated their bank offers mobile banking but they did not use it were asked what mobile banking activities they would be interested in performing if their concerns were addressed. Their top responses included several of the most common activities of current mobile banking users. Checking financial account balances or recent transactions was the most commonly cited (35 percent), followed by receiving alerts from their bank (25 percent), downloading their bank's mobile banking app (22 percent), and depositing checks electronically (21 percent) (figure 5). However, 54 percent of these respondents who do not use mobile banking indicated that they had no interest in performing any mobile banking activities even if their concerns were addressed.
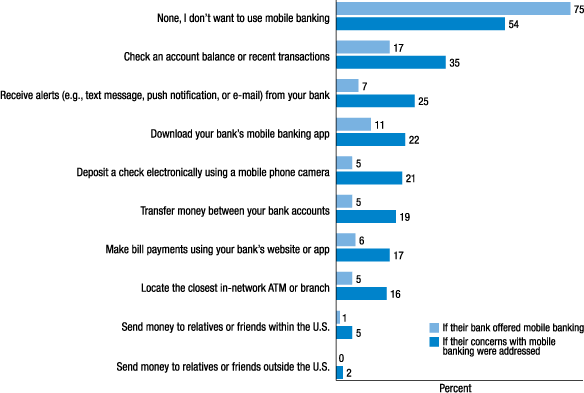
Note: Among those with a mobile phone and bank account who did not use mobile banking in the past 12 months, for those whose bank offered mobile banking (n = 819) and whose bank did not (n=536).
Separately, those who indicated that their bank did not offer mobile banking or that they did not know if their bank offered it were asked what mobile banking activities they would be interested in doing if their bank began to offer the service (figure 5). Checking financial account balances or recent transactions topped the list (17 percent), followed by downloading their bank's mobile banking app (11 percent). While other mobile banking activities did garner interest from smaller shares of this group, the dominant response was that most had no interest in performing any mobile banking activities (75 percent).
Box 3. Channel Use among Smartphone Users
Among those with bank accounts and mobile phones, smartphone owners reported much higher rates of mobile banking usage (53 percent) than feature phone users (7 percent). However, even among those smartphone owners who utilize mobile banking services, many still need or want to use other banking channels. For example, a visit to an ATM or branch may be necessary to withdraw cash, and visiting a branch or talking with a customer service representative may be preferred ways of resolving problems.
Respondents were asked about their use of five banking channels (branch, ATM, telephone, online, and mobile), and the answers provide a fuller picture of how smartphone users interact with their bank or credit union. In the prior 12 months, 83 percent of smartphone owners with bank accounts visited a branch and spoke with a teller, 82 percent used an ATM, 82 percent used online banking, 53 percent used mobile banking, and 29 percent used telephone banking (table A).
Table A. Channel access among smartphone users
Percent, except as noted
| Channel | Past 12 months* |
Past month** |
Top 3 ways interact with bank* |
|---|---|---|---|
| Branch | 83 | 78 | 62 |
| ATM | 82 | 87 | 62 |
| Telephone | 29 | 67 | 16 |
| Online | 82 | 96 | 59 |
| Mobile | 53 | 89 | 31 |
* Among respondents with a smartphone and a bank account (n=1,622).
** Among respondents with a smartphone and a bank account who have used that channel in the past 12 months (n varies, depending on channel).
Among those smartphone owners who used each of these channels in the past year, most had used that same channel in the past month, with the incidence of use in the past month being the highest for the users of the online, mobile, and ATM channels (96 percent, 89 percent, and 87 percent, respectively). The frequency of use was also higher for these three channels. Among those who had used each of the channels in the past month, the median number of uses in the past month was five for each of the online and mobile channels, three for ATM, and two for each of the branch and telephone channels. These responses suggest that many smartphone owners use online, mobile, and ATM banking quite consistently for their banking needs, and the branch and telephone banking channels on a more periodic basis.
In a separate question, respondents were asked to select the most important ways they interact with their bank or credit union. Responses were limited to three channel selections. Among smartphone owners, a teller at a branch (62 percent), ATM (62 percent), and online banking (59 percent) were more frequently cited than mobile banking (31 percent). The lower share choosing mobile banking is due in part to the lower level of adoption of mobile banking, relative to some of the other channels. Among smartphone owners who use mobile banking, 54 percent cited mobile as one of their top three channels--below the shares that cited online (65 percent) and ATM (62 percent), but above the share that cited a teller at a branch (51 percent). Those mobile banking users who said that mobile is one of their top three channels tend to be younger and have higher levels of education than those mobile banking users who do not.
The types of activities conducted using different channels are likely one driver of the frequency of channel use. As noted in this report, the most common activities among mobile banking users were checking financial account balances or transaction inquiries, transferring money between accounts, and receiving alerts. Among smartphone owners with bank accounts who reported visiting a branch in the past 12 months, the two most frequently cited reasons for visiting a branch were depositing (78 percent) or withdrawing (64 percent) a check or cash (figure A). Resolving a problem or getting general information about products or services (24 percent), obtaining specific information about an account (22 percent), and transferring money between accounts (19 percent) were also cited by many respondents.

Note: Among respondents with a smartphone and bank account who have visited a bank branch in the past 12 months (n=1,376).
Taken together, these estimates indicate that while smartphone owners are utilizing the mobile platform to interact with their bank or financial institution, they also rely on online banking and have maintained more traditional connections via the branch and ATM channels.
1. Among respondents with a smartphone and a bank account (n=1,622). Return to text
2. Among respondents with a smartphone and a bank account who have used that channel in the past 12 months (n varies, depending on channel). Return to text
Return to textMobile Payments
In this Section:
For purposes of this survey, mobile payments are defined as "purchases, bill payments, charitable donations, payments to another person, or any other payments made using a mobile phone. This includes using your phone to pay for something in a store as well as payments made through an app, a mobile web browser or a text message."13 This section takes a more detailed look at mobile payment usage, focusing on mobile payment adoption, activities, and motivations for use.
Adoption Rates
Mobile payments continue to be less common than mobile banking. Based on the responses to the broad definition of mobile payments listed above, 24 percent of those with access to a mobile phone reported that they made a mobile payment in the 12 months prior to the survey. Rates of mobile payment usage are somewhat higher among smartphone users: 28 percent of smartphone users reported
having made a mobile payment in the previous 12 months.
Of current mobile payments users, 10 percent had started using mobile payments in the prior six months, while 16 percent began using mobile payments six to twelve months prior to the survey. An additional 20 percent reported that they started using mobile payments in the prior one to two years, and 30 percent reported that they began using mobile payments more than two years prior to the survey. Twenty-one percent of users are unable to recall when they began using mobile payments.
Younger consumers are more likely to make mobile payments (table 5). Of those with a mobile phone in 2015, 30 percent of individuals ages 18 to 29 and 32 percent of individuals ages 30 to 44 had made mobile payments. By comparison, 13 percent of those ages 60 or over reported making mobile payments. This pattern of use by age has been evident across all five years of the survey.
Table 5. Use of mobile payments in the past 12 months by age
Percent, except as noted
| Age group | 2011 | 2012 | 2013 | 2014 | 2015* |
|---|---|---|---|---|---|
| 18-29 | 20 | 26 | 28 | 34 | 30 |
| 30-44 | 16 | 18 | 21 | 31 | 32 |
| 45-59 | 8 | 9 | 13 | 16 | 20 |
| 60+ | 5 | 8 | 7 | 7 | 13 |
| Total | 12 | 15 | 17 | 22 | 24 |
| Number of respondents | 2,002 | 2,291 | 2,341 | 2,603 | 2,244 |
Note: Among respondents with a mobile phone.
* Not directly comparable to prior years due to question change in 2015.
Among those owning a mobile phone, minorities are more likely to make mobile payments (table 6). In 2014, 32 percent of non-Hispanic blacks with mobile phones and 29 percent of Hispanics with mobile phones had made mobile payments, while 19 percent of non-Hispanic whites reported making mobile payments. The pattern of minorities making mobile payments at a higher rate than white, non-Hispanic consumers has persisted over time in the Mobile Survey.
Table 6. Use of mobile payments in the past 12 months by race/ethnicity
Percent, except as noted
| Race/ethnicity | 2011 | 2012 | 2013 | 2014 | 2015* |
|---|---|---|---|---|---|
| White, non-Hispanic | 10 | 13 | 12 | 17 | 19 |
| Black, non-Hispanic | 14 | 18 | 34 | 34 | 32 |
| Other, non-Hispanic | 15 | 17 | 16 | 24 | 45 |
| Hispanic | 20 | 18 | 26 | 32 | 29 |
| 2+ races, non-Hispanic | 9 | 13 | 31 | 23 | 26 |
| Total | 12 | 15 | 17 | 22 | 24 |
| Number of respondents | 2,002 | 2,291 | 2,341 | 2,603 | 2,244 |
Note: Among respondents with a mobile phone.
* Not directly comparable to prior years due to question change in 2015.
There is no clear relationship between mobile payment usage and income or education level among those who own a mobile phone.
Common Mobile Payment Activities
Focusing only on those smartphone owners who reported that they had made a mobile payment in the prior 12 months, the most common mobile payment activity was paying bills (65 percent), followed by purchasing a physical item or digital content remotely using a mobile phone web browser or app (42 percent) (figure 6). The next most common activities reported by mobile payments users were paying for something in a store (33 percent) and sending money to friends or relatives within the United States (25 percent). Less common activities were paying for parking, a taxi, car service, or public transit using a mobile phone (20 percent); making a donation or payment by text message (12 percent); and sending money to relatives or friends outside the United States (5 percent).14
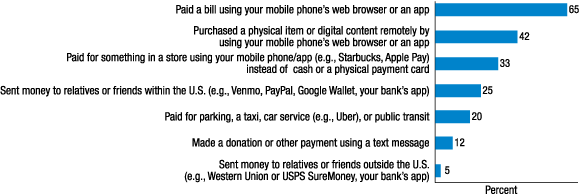
Note: Among those with a smartphone who used mobile payments in the past 12 months (n=406).
Although using a mobile phone to pay for a retail purchase at the point-of-sale (POS) is less common than paying bills or purchasing physical items or digital content remotely with a phone, POS mobile payments are no longer rare. Developments in technology, the entrance of new market participants, and increased familiarity with mobile payments may be contributing to this trend. As noted earlier, in 2015, 33 percent of all mobile payments users with smartphones had paid for something in a store using their mobile phone instead of cash or a payment card in the 12 months prior to the survey. Among those mobile payments users with smartphones who made POS mobile payments, 73 percent had made a POS payment in the preceding month, and over a third had made more than two such payments.
Mobile payments are most commonly funded using debit cards (56 percent), credit cards (48 percent), directly from a bank account (36 percent), or from an account at a non-financial institution such as PayPal (16 percent). Only 9 percent of mobile payments users reported that they used a prepaid debit card, and 3 percent had the charge directly applied to their phone bill. The type of payment used to fund the mobile purchase has implications for the consumer protections that the payer is afforded on the transaction, as different payment sources are covered by different consumer regulations and regulatory agencies.15
Among all mobile payments users, the median reported frequency of using mobile payments was two times in the month prior to the survey. As with mobile banking, there is variation among mobile payments users in how frequently they use the service and in types of activities. Twenty-five percent of mobile payments users reported they had used mobile payments in the last 12 months but not in the month prior to the survey. Like the overall group of mobile payments users, the most common mobile payment activity reported by these low-intensity users is paying bills (30 percent).
Twenty-one percent of mobile payments users reported that they had used mobile payments more than four times in the month prior to the survey.16 Compared to all mobile payments users, these high intensity mobile payments users had higher rates of engaging in all mobile payments activities and tended to engage in a few mobile payment activities at much higher rates. In particular, relative to all mobile payments users, high-intensity users more frequently reported that they paid their bills online through a mobile web browser or app and purchased a physical item or digital content remotely using a mobile phone web browser or app.
Reasons for Using--or Not Using--Mobile Payments
Convenience is the most common reason given by consumers who have adopted mobile payment activity (45 percent). Getting a smartphone is the second most common reason people started using mobile payments (20 percent). Fourteen percent of users said the ability to make mobile payments becoming available to them was the main reason, while 7 percent indicated that they began using mobile payments because they became comfortable with the security.
Among those who said they do not use mobile payments, the most common reason for not adopting
the technology is that they prefer to use other means of making payments: 80 percent reported that it is easier to pay with other methods (figure 7). Sixty-seven percent cited security concerns, and a similar proportion (65 percent) did not see a benefit to using mobile payments.
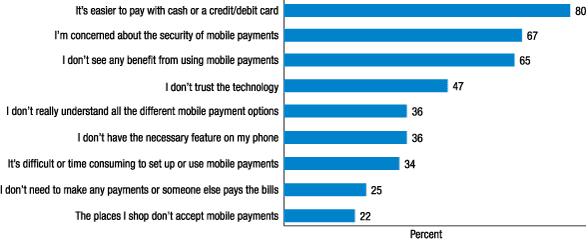
Note: Among respondents with mobile phones who did not use mobile payments in the past 12 months (n=1,802).
The reasons respondents have given for not using mobile payments have been generally consistent between the 2013, 2014, and 2015 surveys. However, over time, a smaller share of respondents have reported that not having the necessary features on their phone (46 percent in 2013, 37 percent in 2014) and the places they shop not accepting mobile payments (27 percent in 2013, 23 percent in 2014) were reasons why they had not used mobile payments.
When consumers who do not use mobile payments were asked to indicate all the mobile payment activities they would have an interest in using if their concerns were addressed, 74 percent indicated that they simply had no interest in using mobile payments even if their concerns were addressed (figure 8). This is similar to the responses regarding mobile banking, indicating that some consumers simply have no interest in utilizing the new technology under any circumstances.
Figure 8. Assuming that the reason(s) why you do not currently use mobile payments was addressed, would you be interested in doing any of the following activities with your mobile phone?
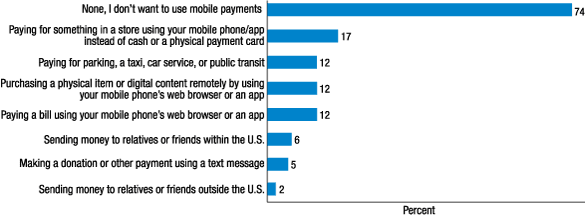
Note: Among respondents with mobile phones who did not use mobile payments in the past 12 months (n=1,802).
Of the potential activities of interest to others, using a mobile phone to pay for purchases at a store was the most commonly cited (17 percent). Three other mobile payment activities appealed to a sizeable share (12 percent for each activity): paying for parking, a taxi, car service, or public transit; paying a bill; and purchasing a physical item or digital content remotely using a mobile phone.
When those with a smartphone who did not report making POS payments were asked if they plan to use their mobile phone to make a payment in a store in the next 12 months, 5 percent said they "definitely will" and 15 percent said they "probably will." The majority of smartphone users said that they "probably will not" (50 percent) or "definitely will not" (30 percent) use their phone to make an in-store payment.
References
7. To measure the use of a bank branch in the 2015 Mobile Survey, respondents were asked the following question: "Have you visited a bank branch and spoken with a teller or a bank employee in the past 12 months? Please do not include visits where your only activity was using an ATM/Cash machine located at a branch." In prior years of the survey, the second sentence requesting that respondents exclude branch visits that only involved the use of an ATM was not included. Thus, the question from the 2015 survey may not be directly comparable to the measures from earlier surveys. This change in the question would likely reduce the measure of branch use in the last year, and thus could be a component of any year-over-year change. Return to text
8. The relative prevalence and ranking of channel usage in the 2013 Mobile Survey is similar to results from the 2013 FDIC Survey of Unbanked and Underbanked Households. See www.economicinclusion.gov/surveys/2013household/. However, the incidence of online banking and of households with Internet access are notably higher in the 2013 Mobile Survey than in the Federal Deposit Insurance Corporation (FDIC) survey. This may be due in part to differences in the survey methodology, as the FDIC survey is conducted by phone and in person while the Mobile Survey is conducted via an online panel. Return to text
9. For an overview of the use of all five channels in previous Mobile Surveys, see figure 2 of the 2015 report, available at www.federalreserve.gov/econresdata/consumers-and-mobile-financial-services-report-201503.pdf. Return to text
10. In this report, the term "feature phone" is used to refer to a mobile phone that is not a smartphone and has limited features aside from making calls. The Mobile Survey defines a smartphone as "a mobile phone with features that may enable it to access the web, send e-mails, download apps, and interact with computers. Smartphones include the iPhone, Blackberry, as well as Android and Windows Mobile powered devices." Respondents who indicated they had a mobile phone were provided with this definition of a smartphone and asked "Is your mobile phone a smartphone?" If they answered "No," they were assumed to have a feature phone. Return to text
11. An alternative way of measuring mobile banking use would be to look at the share of respondents who report they have done one or more mobile banking activities in the last 12 months. For the 2015 Mobile Survey, 58 percent of those with a bank account and a mobile phone reported doing at least one mobile banking activity from the list in the survey. When limiting to only those with a bank account and smartphone, this number increases to 69 percent. This may suggest that the share of people using mobile banking may be somewhat higher than the measure obtained using the general definition. Return to text
12. For the purposes of this report, "high-intensity" users are identified as those respondents who have used mobile banking within the year prior to the 2015 survey and have used mobile banking more frequently than 75 percent of all mobile banking users, which corresponds to a frequency greater than 10 times in the month prior to the 2015 survey. Based on this definition, high-intensity users represent 30 percent of mobile banking users in the 2015 survey. Return to text
13. The definition of mobile payments was revised for the 2015 Mobile Survey. For the 2011 through 2014 surveys, the following definition of mobile payments was provided to respondents: "Mobile payments are purchases, bill payments, charitable donations, payments to another person, or any other payments made using a mobile phone. You can do this either by accessing a web page through the web browser on your mobile device, by sending a text message (SMS), or by using a downloadable application on your mobile device. The amount of the payment may be applied to your phone bill (for example, Red Cross text message donation), charged to your credit card, or withdrawn directly from your bank account." Return to text
14. An alternative way of measuring mobile payments use would be to look at the share of respondents who report they have done one or more mobile payments activities in the last 12 months. For the 2015 Mobile Survey, 30 percent of those with a mobile phone and 38 percent of those with a smartphone reported doing at least one mobile payment activity from the list in the survey. This may suggest that the share of people using mobile payments may be somewhat higher than the measure obtained using the general definition. Return to text
15. For further details on how existing consumer regulations relate to the various methods for making mobile payments, see Stephanie Martin, "Statement before the Committee on Financial Services Subcommittee on Financial Institutions and Consumer Credit U.S. House of Representatives" (Washington: Federal Reserve Board, June 2012), www.federalreserve.gov/newsevents/testimony/martin20120629a.pdf. Return to text
16. For the purposes of this report, "high-intensity" mobile payments users are identified as those respondents who have used mobile payments within the year prior to the 2015 survey and have used mobile payments more frequently than 75 percent of all mobile payments users, which corresponds to a frequency greater than four times in the month prior to the 2015 survey. Return to text
