FEDS Notes
April 18, 2014
The Role of Financial Imbalances in Assessing the State of the Economy
David M. Arseneau and Michael Kiley
Introduction
The buildup of financial imbalances may provide a signal regarding the sustainable rate of resource utilization in the economy. For example, excessive growth in credit might spur spending, employment, and production above levels that would not be attainable in the absence of the underlying financial imbalance. In such a situation, ignoring the influence of excessive credit growth on the real economy might lead one to miss an important signal regarding the sustainability of the rate of resource utilization.
We consider these issues empirically, focusing on the role of credit fluctuations in informing estimates of resource utilization. We briefly lay out some of the economic mechanisms that may imply a role for financial imbalances in assessing resource utilization, and then turn to a simple attempt to embed these mechanisms within an otherwise standard framework for assessing the sustainable rate of output and unemployment.
Our analysis points to several tentative conclusions. Economic theory suggests that financial imbalances may provide signals about resource utilization through their influence on aggregate demand and supply. Implementation of these ideas in a "traditional" trend/cycle model, like that of Kuttner (1994), Staiger, Stock, and Watson (1997), or Fleischman and Roberts (2011), suggests that, from a purely empirical standpoint, financial imbalances play an important role in informing estimates of resource utilization. Taken at face value, the empirical results suggest that traditional estimates of potential output were too optimistic over 2004-2007, to a degree that could have been detected given data through that period and of a magnitude that would have implied need for a notably tighter monetary policy. Similarly, the current state of credit conditions (with weak growth in credit of late) suggests that aggregate demand may be weaker than would be gauged by trend/cycle models ignoring financial imbalances.
Robustness checks show that these results are not disproportionately influenced by the 2003-2013 housing boom and bust period (or the financial crisis). That said, there is some evidence that developments in the housing market--and, in particular, mortgage credit--may be particularly important in informing estimates of the output gap.
The Credit Cycle and Resource Utilization
In general, financial imbalances can potentially influence both aggregate demand and aggregate supply. For example, it seems relatively uncontroversial, at least given current knowledge of the importance of credit developments in financial crises (e.g. Reinhart and Rogoff (2009) and Schularick and Taylor (2012)), that loose credit supply probably stimulates aggregate demand and, when reversed, leads to a contraction in demand.
Because the output gap is not observable and financial conditions affect aggregate demand and supply, credit conditions may be relevant for assessing resource utilization. Our approach is to augment a relatively standard "traditional" empirical model used to estimate the output gap with credit (or other financial) variables. This "traditional" model focuses on the interaction of output and the labor market (e.g., Okun's Law) and the interaction of resource utilization and inflation (e.g., the Phillips curve). Relatively simple examples of such models include Kuttner (1994) and Staiger, Stock, and Watson (1997).
We augment the traditional resource utilization model with measures of credit or house-price developments because a large literature emphasizes housing and credit developments as driving either wealth effects (e.g., Case, Quigley, and Shiller (2005, 2013)) or financial disturbances with severe adverse macroeconomic consequences (e.g., Cecchetti (2008), Reinhart and Rogoff (2009)). In broad terms, our analysis extends and examines the robustness of findings in Borio et al (2013), who allow for financial variables to help determine the output gap by introducing the real interest rate, credit growth, and/or a real house price index into an expanded version of the Hodrick-Prescott filter. These authors ignore the information content in the labor market and inflation for the state of resource utilization. This omission is important from an economic perspective, as labor market slack is important in policy discussions, and from a statistical perspective, as labor market and inflation developments are the most informative variables for resource utilization in traditional approaches (Basistha and Startz (2008)), begging the question of whether the Borio et al (2013) results are fragile.
Specifically, our simple model consists of these key equations:
- A Phillips curve in which inflation is a function of its own lags and the unemployment gap. We measure inflation using the price index for personal consumption expenditures excluding food and energy – that is, with core consumer price inflation.
- An Okun's law relationship linking labor utilization – the unemployment gap – and overall resource utilization – the output gap.
- An output gap equation linking the cyclical state of the economy to its own lags and credit (business and household) developments.
- Equations for the cyclical components of business and household credit, linking these fluctuations to their own lags and movements in resource utilization.
- Equations for the trends in output (potential output), the long-run unemployment rate (the natural rate), and trends in credit.
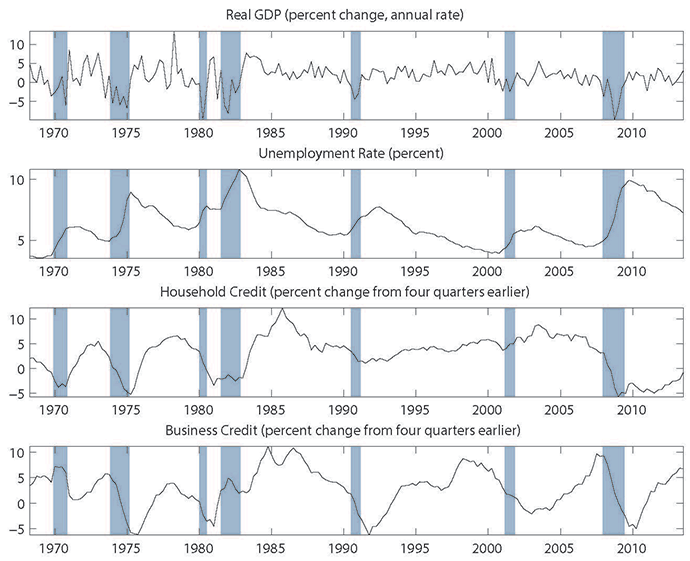
These equations, without credit conditions, are common in the approaches used in previous work. As reported in Figure 1, the unemployment rate shows a clear cycle around recessions (as identified by the National Bureau of Economic Research); this cycle, in conjunction with Okun's Law, is highly informative about the overall business cycle. Indeed, a casual look at the change in real GDP illustrates how difficult it would be to gauge the state of overall resource utilization with- out labor market data. In addition, both credit variables (household and business credit) show clear cycles including during the 1970s, around the credit control period in the early 1980s, and around the most recent recession.
| Figure 1. Key Data Series |
|---|
 |
Source: National Income and Product Accounts from the Bureau of Economic Analysis, Bureau of Labor Statistics, and Flow of Funds from the Federal Reserve Board of Governors. |
Because the output gap is not observable and financial conditions affect aggregate demand and supply, credit conditions may be relevant for assessing resource utilization (and hence the appropriate stance of monetary policy). Specifically, given the theoretical linkages from financial developments to the real side of the economy that have been established in the existing literature, it seems plausible that information regarding financial imbalances may be informative in estimating the extent of resource utilization.
Results
The estimates of resource utilization are markedly different once credit fluctuations are added to the system of equations used for estimation. In short, fluctuations in financial imbalances over the past decade lead to substantively different assessments of resource utilization.
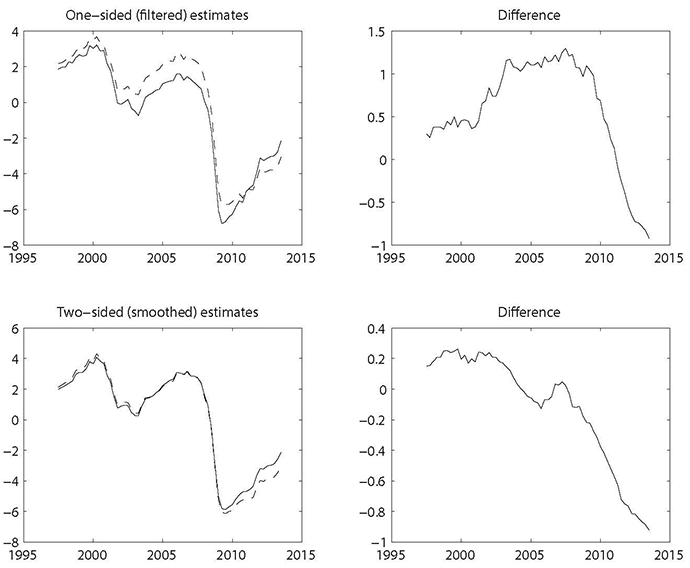
This can be seen in the "one-sided" estimates of the output gap from the traditional model and the system augmented with credit. These one-sided estimates use contemporaneous (but not real-time) data to assess the state of resource utilization at any date, as opposed to the "two-sided" estimates which use the full sample of the most recent vintage of data available. The two-sided estimates of the output gap have an advantage in that they benefit from information gleaned from the future and hence not available at the point in time when the initial estimate is made. In this sense, the one-sided estimates are a more accurate representation of what economists may have been thinking at the time.
As highlighted in the upper two panels of Figure 2, the one-sided estimate of the output gap is about 1 percentage point higher (that is, output above potential) over 2004-2006 according to the model that includes credit growth (the dashed line) relative to the traditional model (the solid line). (The solid line to the right shows the difference between the estimates.) Simply put, the rapid rise in credit over this period signals an unsustainable rate of production – in a manner detectable with data covering the period, and not simply by looking back given subsequent developments (as would be indicated by the two-sided estimates). The augmented model also provides a substantially different assessment in early 2013, where the output gap is about 1 percentage point lower (that is, output further below potential) than from the traditional model.
| Table 1 |
|---|
| One-sided estimates | Two-sided estimates | |
|---|---|---|
| Traditional model | 1.2 | 2.6 |
| Augmented with credit | 2.5 | 2.4 |
| CBO estimate | -1.3 | 0.2 |
1. One-sided estimates from the models use current vintage data. For the CBO, the one-sided estimate is that reported in January 2006 (CBO (2006)) combined with real-time data on real GDP (Federal Reserve Bank of Philadelphia); the two-sided estimate is that reported in February 2014 (CBO (2014)). Return to text.
Borio et al (2013) emphasize that, in their simple model using credit, the one-sided estimates of resource utilization are more reliable than those that ignore credit. This is also true in the models herein, as can be seen by comparing the lines in the upper and lower panels in Figure 2. Table 1 highlights this result for 2005. The augmented model (the second row) accurately identified the size of the output gap in 2005, as currently estimated by either model using data through 2013 (as can be seen by comparing the two columns). In contrast, the traditional model (the first row) revised its assessment substantially as additional data became available. As shown in the memo line, the size of this revision is in line with the evolution of estimates from the Congressional Budget Office (CBO). As of January 2006 the CBO estimated the size of the output gap to be -1.3. That estimate was subsequently revised up over a full percentage point--roughly in line with the revision to the traditional model--by February 2014.
| Figure 2. Output gaps from traditional and credit-augmented models. (Left panels: Traditional, solid line; Augmented, dashed line) |
|---|
 |
The robustness of the one- and two-sided estimates from the augmented model suggest that the information in credit may be valuable in assessing current conditions. However, this information may play a less important role after time has passed – as underlying trends in the past become more apparent once subsequent output, labor market, and inflation outcomes are realized.
Robustness
We examined the robustness of our results along two dimensions.
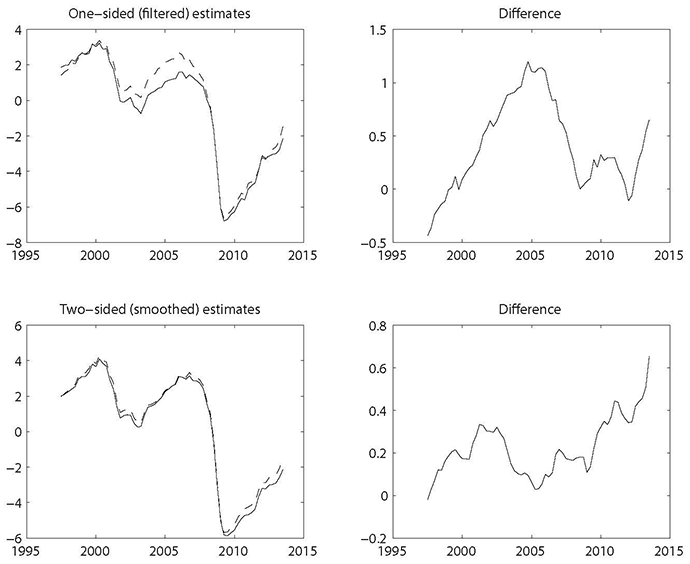
First, given the large run-up and subsequent decline in the U.S. housing market from the early 2000s onward, it is reasonable to ask whether the results presented above are simply a reflection of this episode. To address this, we re-estimated the baseline model using data through the fourth quarter of 2002. We recover very similar results for the estimates for resource utilization using parameters based on developments prior to 2003; hence our finding regarding the usefulness of financial imbalances in informing estimates of the extent of resource utilization do not appear to be merely a reflection of the most recent housing cycle.
| Figure 3. Output gaps from traditional and house-price-augmented models (Left panels: Traditional, solid line; Augmented, dashed line) |
|---|
 |
Second, given the prominent role that housing market developments play in shaping growth in mortgage credit and the importance of housing prices in driving household wealth and aggregate demand through traditional wealth effects (rather than through some structural credit-system mechanism, e.g., Case, Quigley, and Shiller (2005, 2013)), we consider an alternative to our baseline specification in which household credit is replaced by the ratio of national house prices (as measured in the Financial Accounts of the United States) to rents (as measured in the Consumer Price Index). This ratio is a widely-used metric of valuations in the housing market and correlates highly with mortgage credit. Results using this house-price indicator--shown in Figure 3--are nearly identical to those using household credit, suggesting that mortgage credit and the housing market may be particularly informative for measuring resource utilization.
Conclusion
Our results suggest that, from a purely empirical standpoint, financial imbalances play an important role in informing estimates of resource utilization. Taken at face value, the empirical results suggest that traditional estimates of potential output were too optimistic over 2004-2007, to a degree that could have been detected given data through that period and of a magnitude that would have implied need for a notably tighter monetary policy. Consideration of indicators of financial imbalances may be useful in assessing resource utilization going forward.
References
[1] Arabinda Basistha and Richard Startz Measuring the Nairu with Reduced Uncertainty: A Multiple-Indicator Common-cycle Approach. Review of Economics and Statistics Vol.90, No. 4 (Nov., 2008) pp. 805-811, Stable URL: http://www.jstor.org/stable/40043116.
[2] Case Karl E., Quigley John M. and Shiller Robert J., 2005. "Comparing Wealth Effects: The Stock Market versus the Housing Market," The B.E. Journal of Macroeconomics, De Gruyter, vol. 5(1), pages 1-34, May.
[3] Case, Karl E., Quigley, John M. and Shiller, Robert J., 2013. "Wealth Effects Revisited 1975-2012," Critical Finance Review, now publishers, vol. 2(1), pages 101-128, July.
[4] Cecchetti, Stephen G. 2008. "Measuring the Macroeconomic Risks Posed by Asset rice Booms," NBER Chapters, in: Asset Prices and Monetary Policy, pages 9-43 National Bureau of Economic Research, Inc.
[5] Claudio Borio, Piti Disyatat, and Mikael Juselius. Rethinking Potential Output: Embedding Information about the Financial Cycle. BIS Working Paper No. 404. (2013).
[6] Fleischman, Charles A., and John M. Roberts (2011). "From Many Series, One Cycle: Improved Estimates of the Business Cycle from a Multivariate Unobserved Components Model," Finance and Economics Discussion Series 2011-46. Board of Governors of the Federal Reserve System (U.S.).
[7] Kenneth N. Kuttner. Estimating Potential Output as a Latent Variable. Journal of Business and Economic Statistics . Vol. 12, No. 3 (Jul., 1994), pp. 361-368 . Published by: American Statistical Association. Stable URL: http://www.jstor.org/stable/1392092.
[8] Reinhart, Carmen M., Kenneth S. Rogoff 2009. "This Time is Different: Eight Centuries of Financial Folly", Princeton University Press, Princeton, New Jersey.
[9] Schularick, Moritz and Alan M. Taylor. Credit Booms Gone Bust: Monetary Policy, Leverage Cycles, and Financial Crises, 1870-2008. American Economic Review, Vol. 102, No, 2, (2012), pp. 1029 – 1061.
[10] Staiger, Douglas, James H. Stock and Mark W. Watson. The NAIRU, Unemployment and Monetary Policy. Journal of Economic Perspectives. Vol. 11, No. 1 (Winter, 1997) pp. 33-49 . Stable URL: http://www.jstor.org/stable/2138250.
Please cite as:
Arseneau, David M., and Michael T. Kiley (2014). "The Role of Financial Imbalances in Assessing the State of the Economy," FEDS Notes. Washington: Board of Governors of the Federal Reserve System, April 18, 2014. https://doi.org/10.17016/2380-7172.0015
Disclaimer: FEDS Notes are articles in which Board economists offer their own views and present analysis on a range of topics in economics and finance. These articles are shorter and less technically oriented than FEDS Working Papers.
