
FEDS Notes
 Print
PrintNovember 23, 2015
Low Inflation in the United States: A Summary of Recent Research
Michael T. Kiley 1
Inflation in the United States has been running at low levels. Over the five years ending in December 2014, the percent change in the Consumer Price Index (CPI), at 8.8 percent (or 1.7 percent at an annual rate), was the lowest rate of price increase seen in the United States in half a century. To be sure, the past 50 years include the Great Inflation of the 1970s and the slow disinflation from those elevated levels that occurred over the course of the 1980s and early 1990s. Nonetheless, inflation in recent years has fallen to levels below the objective of the Federal Open Market Committee (FOMC), and the causes and potential consequences of low inflation have been an area of intense research within the Federal Reserve System and elsewhere.2
In this note, several aspects of this research are reviewed and evaluated. The discussion first evaluates the degree to which low inflation is a surprise: While the level of inflation is low by historical standards, the decline in inflation since the onset of the Great Recession has been less than many popular models of the inflation process would have predicted and, as a result, research in recent years has emphasized that inflation has been surprisingly high, not low. A number of factors have been offered as explanations for "surprisingly high inflation", including an anchoring in inflation expectations, a small and/or reduced effect of unemployment on inflation (e.g., a flattening of the Phillips curve), and an unusual divergence between unemployment and overall labor market slack that may have pushed up inflation (e.g., "shadow slack" substantially less than that measured by unemployment). A brief review of each of these issues is provided.
Before turning to the discussion, there are two factors that have likely played important roles in inflation developments in recent years that receive only a short discussion herein. First, wage developments, and in particularly the interaction of low inflation and downward nominal wage rigidity, have likely played a role; Daly and Hobijn (2014) review related evidence. In addition, the appreciation of the dollar over the past year has been a factor in recent developments.
Low Inflation
Figure 1 presents the twelve-month percent changes in the CPI and the CPI excluding food and energy (the core CPI). Inflation in recent years has been low by the standards of the past half century, and the recent decline in oil (and hence energy) prices is not an important factor in explaining the low average pace of inflation in recent years, as the average pace of inflation since 2008 is essentially identical for the overall and core CPIs.
| Figure 1: Percent Change in CPI and Core CPI |
|---|
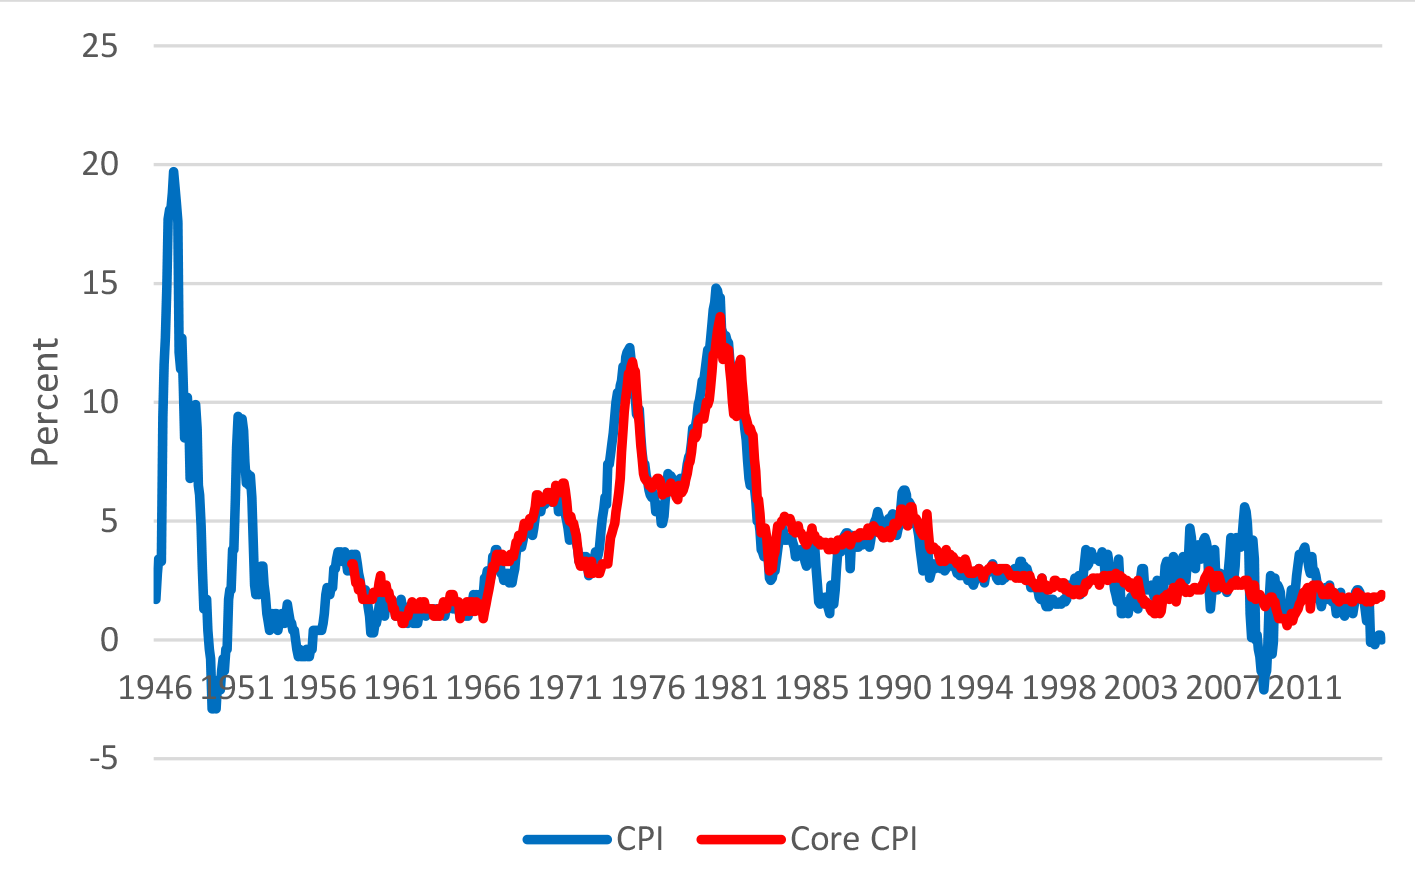 |
Note: Percent change is the change over the previous twelve months. The data shown in the figure spans the period from January 1946 to September 2015.
Source: Department of Labor, Bureau of Labor Statistics
A number of pieces of research, including well-known early investigations by Ball and Mazumder (2011) and Stock (2011), have noted that the low rate of inflation following the Great Recession is not surprising given the rise in unemployment and a traditional Phillips curve relationship indeed, inflation has been surprisingly high. This surprise can be illustrated via graphical representation of the simple accelerationist Phillips curve
where π(t) is inflation in period t, U(t) is the unemployment rate in period t and U*(t) is the natural rate of unemployment (so U(t)-U*(t) is slack), κ>0 is the slope of the Phillips curve, and e(t) is the error term in the equation. Figure 2 presents a scatterplot of the change in core CPI inflation against the unemployment rate, as suggested by this Phillips curve. Over the 1976-1995 period, a strong negative relationship between the level of unemployment jumps out of the figure (and is captured in the fitted-regression line through the red dots). In contrast, there is little relationship between the change in inflation and unemployment over the 1996-2014 period (the blue dots and fitted line). Indeed, the decline in inflation since 2008 is surprisingly small using the pre-1996 relationship, as can be seen through a comparison of the change in inflation when the unemployment rate is near 10 percent in the blue dots with the change that occurred in the early 1980s recession (in the red dots for unemployment near 10 percent).
| Figure 2: A Graphical Illustration of the Accelerationist Phillips Curve |
|---|
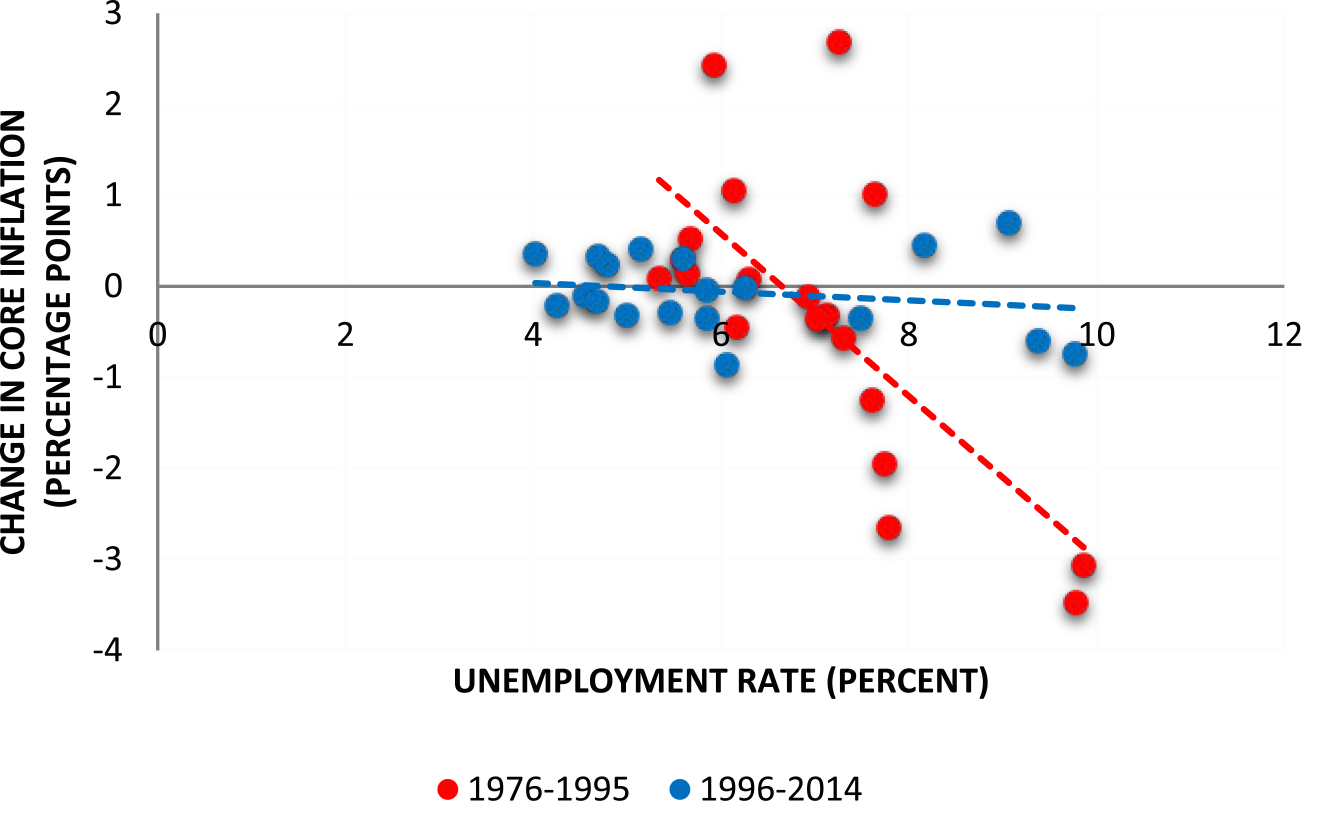 |
Note: Core inflation is measured by the percent change in the annual average of the CPI from its level in the previous year.
Source: Department of Labor, Bureau of Labor Statistics and author's calculations.
Explaining the inflation surprise via changes in the Phillips curve
Many readers may not be especially surprised at some degree of instability in the type of reduced-form Phillips curve highlighted in exhibit 2 for example, instability in such relationships when the behavior of monetary policy changes significantly was a core critique of such relationships over the past fifty years.3 But inspection of the accelerationist Phillips curve suggests two changes in its form that could contribute to surprisingly high inflation.
First, lagged inflation in an accelerationist structure proxies for inflation expectations perhaps because lagged inflation is a good measure of the likely path of inflation in an environment in which the central bank's inflation target is uncertain and changing over time. An alternative is that current inflation could be anchored by relatively stable inflation expectations, with such expectations replacing lagged inflation in the relationship between inflation and unemployment. This effect is predicted by New-Keynesian Phillips curves with a stable inflation target, as in Gali and Gertler (1999), Kiley (2007), or the current generation of dynamic-stochastic-general equilibrium (DSGE) models used at central banks (which build on, for example, Smets and Wouters (2007)). The central prediction of this line of thought most prominently explored (either directly or indirectly) by Ball and Mazumder (2011), Stock (2011), and Coibion and Gorodnichenko (2015) is that inflation expectations in the 1976-1995 period presented in figure 2, during which an accelerationist structure explains inflation movements well, should show a strong dependence on lagged inflation and, because of recent anchoring of expectations, should show little dependence on lagged inflation in the 1996-2014 period. Figure 3 explores the relationship between inflation expectations (inflation one-year ahead, as measured in the first quarter of the year) and the rate of CPI inflation in the previous year (as measured by the percent change in the annual average of the CPI in the previous year).
| Figure 3: Inflation and Inflation Expectations |
|---|
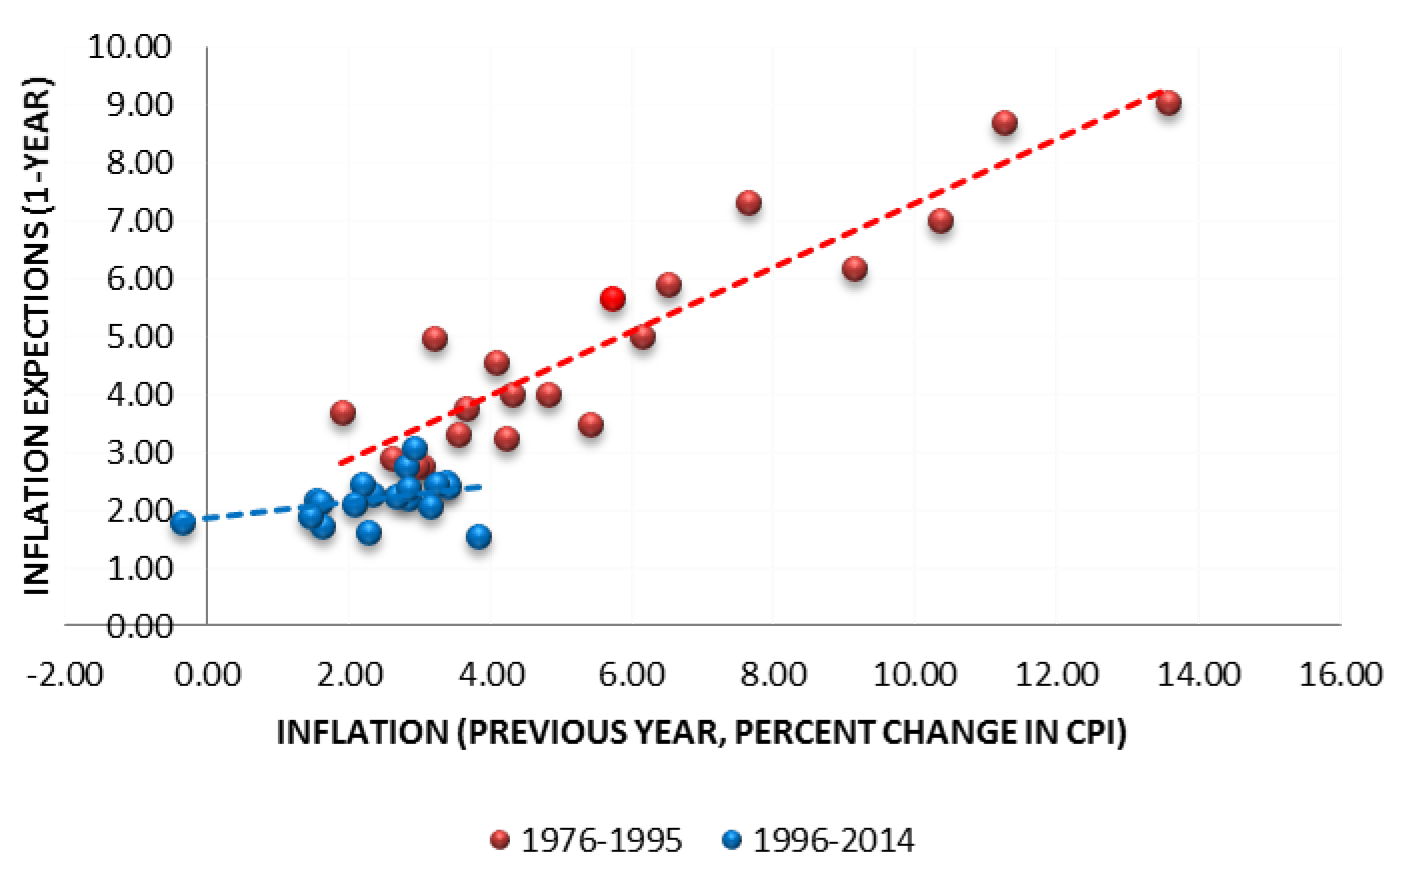 |
Note: Inflation in the previous year is measured by the percent change in the annual average of the CPI from the level in the previous year. Inflation expectations (1-year ahead) are measured by the one-year expected inflation in GDP prices for the 1976-1995 period, as reported in the first-quarter Survey of Professional Forecasters. For the 1996-2014 period, inflation expectations are measured by the one-year expected inflation in the CPI from the Survey of Professional Forecasters.
Source: Department of Labor, Bureau of Labor Statistics and Federal Reserve Bank of Philadelphia.
The relationship between expected inflation and lagged inflation weakened substantially moving from the pre-1996 period to post-1995 period (the red to blue dots). As a result, an expectations-augmented Phillips curve would predict substantially less cumulative disinflation in response to persistently elevated unemployment, as the anchoring of inflation expectations limits the degree of disinflation. Even so, this anchoring is probably insufficient to explain the limited decline in inflation following the rise in unemployment in 2008 and 2009: Returning to figure 2, both expected and actual (core) inflation were in the neighborhood of 2 percent during those years, and hence the fact that inflation remained near this level when unemployment was near 10 percent (as can be seen by the small change in inflation when unemployment was near 10 percent in the blue dots) points to factors other than anchored inflation expectations.
A second factor explored by Ball and Mazumder (2011), and emphasized by Del Negro, Giannoni, and Schorfheide (2015), is a "flat" Phillips curve. Three (related) interpretations of "flatness" in the Phillips curve have been offered. Ball and Mazumder (2011) suggest that "menu cost" models of nominal price and wage rigidity imply that such rigidities increase as the average rate of inflation falls, implying that more of the adjustment in nominal aggregate demand falls on output and less on inflation when inflation is low; this is exactly the finding emphasized in Kiley (2000), which analyzed support for this prediction across a large sample of countries. Research exploring the effects of downward nominal-wage rigidity points to a reduced effect of labor-market weakness on inflation in a low-inflation environment (Daly and Hobijn (2014)). In addition, Del Negro, Giannoni, and Schorfheide (2015) suggest that structural models of inflation dynamics in the New-Keynesian tradition have long suggested "flatter" Phillips curves (e.g., Kiley (2007)) than apparent in the reduced-form relationship depicted in figure 2 for the pre-1996 period; according to this view, the direct effect of slack on prices has long been relatively small, and the apparent steep slope in the pre-1996 period owes to other factors (such as the challenges associated with decisively shifting expectations to a view that monetary policy will act forcefully to stabilize inflation following a period in which such actions were not taken). Finally, Kiley (2008) and Boivin, Kiley, and Mishkin (2010) present evidence that a more clear commitment to price stability in recent decades, in the form of a monetary policy rule with a more sizable response to inflation, acts to substantially stabilize inflation expectations and mitigate fluctuations in inflation, with less clear effects on economic activity; such a shift in monetary policy behavior is consistent with an observed flattening in the Phillips curve.
While a flattening of the Phillips curve is consistent with a number of theoretical and empirical studies, the links between structural features of the economy and the properties of the reduced-form relationship between inflation and unemployment is complex and depends on many model features. Perhaps for this reason, analysis of the "missing disinflation" of recent years has not converged on the role of a flattening in the Phillips curve. (For example, Christiano, Eichenbaum, and Trabandt (2015) use a DSGE model very similar to that in Boivin, Kiley, and Mishkin (2010) and Del Negro, Giannoni, and Schorfheide (2015), but attribute the modest decline in inflation relative to pre-1996 norms to a decline in technological progress, not a flat Phillips curve.)
Explaining the inflation surprise via shadow slack
A number of researchers have linked the modest disinflation since 2008 to the notion that slack is not well-proxied over this period by the unemployment rate. A fairly large number of researchers suggested that the very large (and persistent) increase in long-term unemployment, and the possibility that such unemployed persons are detached from the labor market to a sufficient degree that they do not represent slack, may have been a factor that limited the disinflation over the period of interest.4
As figure 4 amply illustrates, the rise in long-term unemployment in the Great Recession was historically unusual, and short-term unemployment had returned to a historically-typical level a couple of years ago, which would imply limited (to no) disinflationary impetus from that time forward if short-term unemployment better captured slack. However, the econometric evidence using aggregate U.S. labor-market measures was fairly inconclusive (e.g., Ball and Mazumder (2011)), and Kiley (2015), building on a model of the econometric challenges in previous studies, found no evidence that short-term unemployment was a better measure of slack than total unemployment using data on U.S. metropolitan regions.5 Moreover, long-term unemployment has now returned to a historically-typical level and hence separate roles for short- and long-term unemployment could not be a factor in the most recent experience of low inflation.
| Figure 4: Total, Short-term, and Long-term Unemployment |
|---|
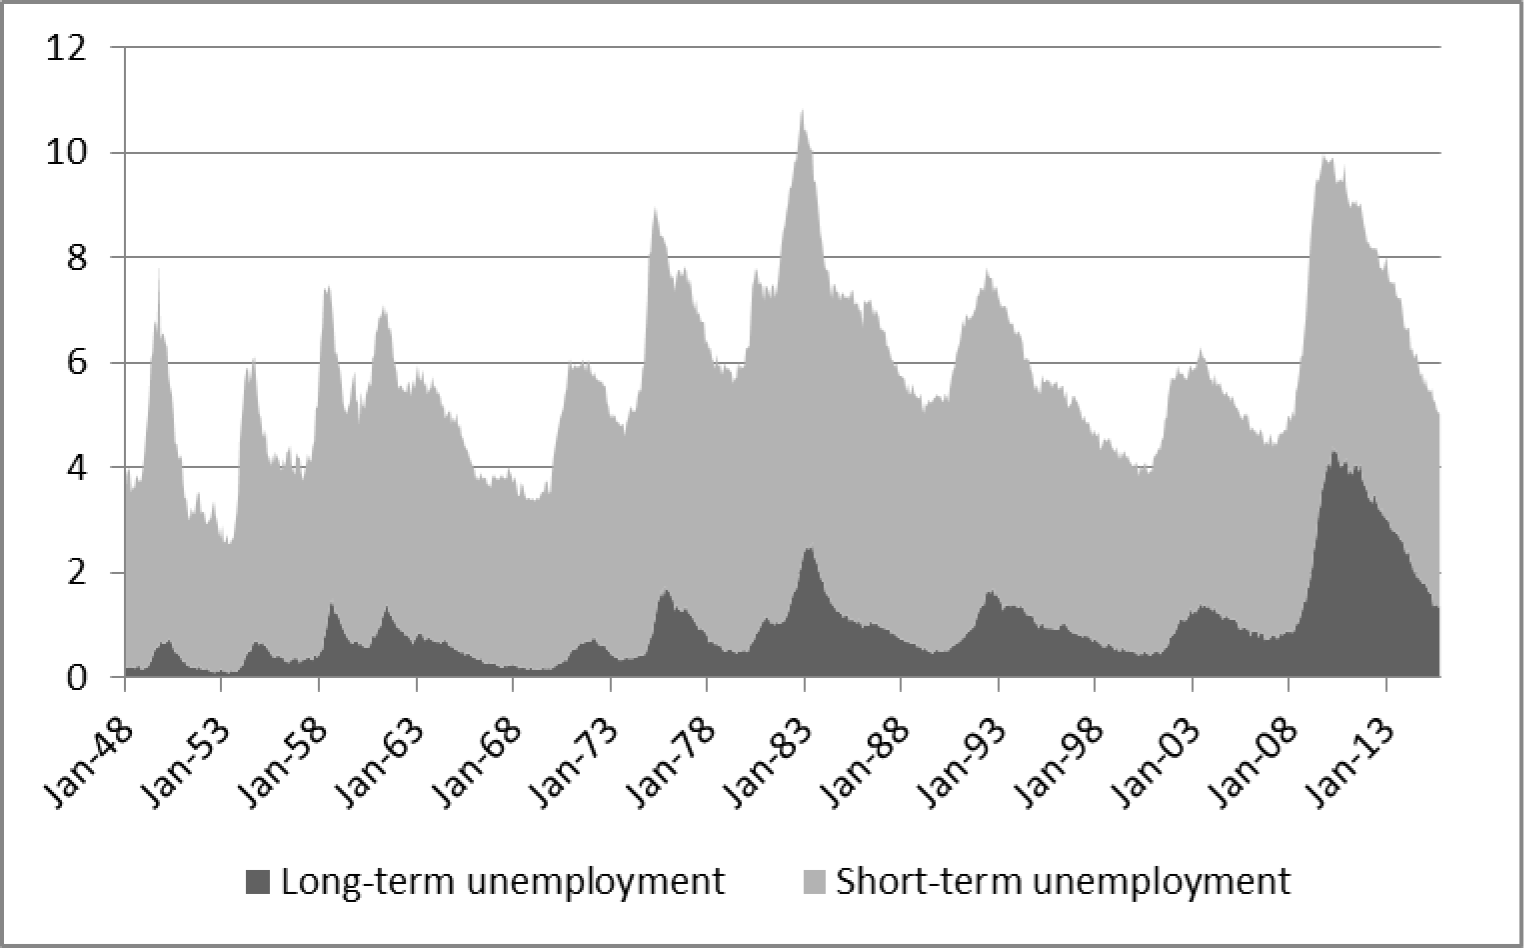 |
Note: The long-term unemployment rate is defined as those unemployed for more than 26 weeks divided by the civilian noninstitutional population over age 16. The short-term unemployment rate is the total unemployment rate minus the long-term unemployment rate. The shaded regions indicate short- or long-term unemployment contributions to the total unemployment rate, which is the top edge of the shaded region. The data span the period from January 1948 to October 2015.
Source: Department of Labor, Bureau of Labor Statistics and authors calculations.
It is also important to keep in mind that, while historically unusual movements in long-term unemployment may have pointed to the possibility that the total unemployment rate overstated slack in recent years, a number of other labor market indicators point in the opposite direction. Most notable among these is the labor-force participation rate, which has been subdued (and declining) in the post-2008 period: While Aaronson et al (2014) attribute the overwhelming majority of the decline in labor-force participation to demographic factors, Erceg and Levin (2014) suggest a larger role for cyclical factors and the possibility that the low level of labor-force participation indicates a substantial degree of "shadow slack". Smith (2014b) discusses a number of other labor-market indicators that may have suggested slack greater-than-that suggested by the unemployment rate in recent years, including the number of employees working part-time for economic reasons and the rate at which workers voluntarily leave their jobs.
Wrapping up
Inflation in the United States has been low. Low inflation is no surprise given the average condition of the economy in recent years indeed, relative to expectations based on the prior U.S. experience with high unemployment in the early 1980s, inflation has been surprisingly high. Key factors include the anchoring of inflation expectations over this period and a "flattening" of the Phillips curve. But the reasons behind such flattening are not clear.
The lowest pace of inflation over a sustained period in a half century has occurred at the same time as evidence that the equilibrium real interest rate may be persistently lower than the norms of recent decades.6 This combination implies that nominal interest rates may remain low by historical standards for some time, and raise the possibility that the U.S. economy could see nominal interest rates near their effective lower bound (of approximately zero) to a substantially greater degree than expected or appreciated in earlier decades. This possibility highlights an important role for research on monetary policy strategies that mitigate the effect of a lower bound on nominal interest rates on price stability and economic activity.7
References
Aaronson, Stephanie, Tomaz Cajner, Bruce Fallick, Felix Galbis-Reig, Christopher L. Smith, & William L. Wascher (2014). "Labor Force Participation: Recent Developments and Future Prospects," Finance and Economics Discussion Series 2014-64. Board of Governors of the Federal Reserve System (U.S.).
Ball, Laurence, & Mazumder, Sandeep, 2011. "Inflation Dynamics and the Great Recession." In: Brookings Papers on Economic Activity (Spring), pp. 337381.
Boivin, Jean & Kiley, Michael T. & Mishkin, Frederic S., 2010. "How Has the Monetary Transmission Mechanism Evolved Over Time?," Handbook of Monetary Economics, in: Benjamin M. Friedman & Michael Woodford (ed.), Handbook of Monetary Economics, edition 1, volume 3, chapter 8, pages 369-422 Elsevier.
Christiano, Lawrence J. & Martin S. Eichenbaum & Mathias Trabandt, 2015. "Understanding the Great Recession," American Economic Journal: Macroeconomics, American Economic Association, vol. 7(1), pages 110-67, January.
Chung, Hess, & Edward Herbst & Michael T. Kiley, 2015. "Effective Monetary Policy Strategies in New Keynesian Models: A Reexamination," NBER Macroeconomics Annual, University of Chicago Press, vol. 29(1), pages 289 - 344.
Coibion, Olivier & Yuriy Gorodnichenko, 2015. "Is the Phillips Curve Alive and Well after All? Inflation Expectations and the Missing Disinflation," American Economic Journal: Macroeconomics, American Economic Association, vol. 7(1), pages 197-232, January.
Daly, Mary C. & Bart Hobijn. 2014. "Downward Nominal Wage Rigidities Bend the Phillips Curve." FRB San Francisco Working Paper 2013-08.
Del Negro, Marco & Marc P. Giannoni & Frank Schorfheide, 2015. "Inflation in the Great Recession and New Keynesian Models," American Economic Journal: Macroeconomics, American Economic Association, vol. 7(1), pages 168-96, January.
Erceg, Christopher J. & Andrew T. Levin, 2014. "Labor Force Participation and Monetary Policy in the Wake of the Great Recession," Journal of Money, Credit and Banking, Blackwell Publishing, vol. 46(S2), pages 3-49, October.
Federal Open Market Committee (FOMC), 2014. "Longer-Run Goals and Policy Strategy," January 25.
Gali, Jordi & Gertler, Mark, 1999. "Inflation dynamics: A structural econometric analysis," Journal of Monetary Economics, Elsevier, vol. 44(2), pages 195-222, October.
Gordon, Robert J., 2013. "The Phillips Curve is Alive and Well: Inflation and the NAIRU During the Slow Recovery." NBER Working Paper No. 19390, August.
Hamilton, James D., Ethan S. Harris, Jan Hatzius, & Kenneth D. West (2015) "The Equilibrium Real Funds Rate: Past, Present, and Future," working paper (San Diego: University of California at San Diego, March).
Johanssen, Ben & Elmar Mertens (2015) "The Shadow Rate of Interest, Macroeconomic Trends, and Time-Varying Uncertainty." Mimeo.
Kiley, Michael T., 2000. "Endogenous Price Stickiness and Business Cycle Persistence," Journal of Money, Credit and Banking, Blackwell Publishing, vol. 32(1), pages 28-53, February.
Kiley, Michael T., 2007. "A Quantitative Comparison of Sticky-Price and Sticky-Information Models of Price Setting," Journal of Money, Credit and Banking, Blackwell Publishing, vol. 39(s1), pages 101-125, 02.
Kiley, Michael T., 2008. "Inflation expectations, Uncertainty, the Phillips curve, and Monetary Policy - Comments," in Fuhrer, Jeffrey et al (eds), Understanding Inflation and the Implications for Monetary Policy: A Phillips Curve Retrospective. The MIT Press, Cambridge, MA.
Kiley, Michael T., 2015. "An evaluation of the inflationary pressure associated with short- and long-term unemployment," Economics Letters, Volume 137, December, Pages 5-9, ISSN 0165-1765, http://dx.doi.org/10.1016/j.econlet.2015.10.005  .
.
Kiley, Michael T., 2015. "What Can the Data Tell Us About the Equilibrium Real Interest Rate?," Finance and Economics Discussion Series 2015-77, Board of Governors of the Federal Reserve System (U.S.).
Krueger, Alan, & Todd Cramer & David Cho, 2014. "Are the Long-term Unemployed on the Margins of the Labor Market." Papered prepared for the Brookings Panel on Economic Activity, March 2021.
Laubach, Thomas & John C. Williams (2015) "Measuring the Natural Rate of Interest Redux." Brookings Institution, October.
Lucas, Robert (1976). "Econometric Policy Evaluation: A Critique". In Brunner, K.; Meltzer, A. The Phillips Curve and Labor Markets. Carnegie-Rochester Conference Series on Public Policy 1. New York: American Elsevier. pp. 1946. ISBN 0-444-11007-0.
Smets, Frank & Rafael Wouters, 2007. "Shocks and Frictions in US Business Cycles: A Bayesian DSGE Approach," American Economic Review, American Economic Association, vol. 97(3), pages 586-606, June.
Smith, Christopher L., 2014a. "The effect of labor slack on wages: Evidence from state-level relationships." Federal Reserve Board FEDS Note, June 2.
Smith, Christopher L., 2014b. "Using cross-state variation to assess the potential for additional improvement in measures of labor market conditions." Federal Reserve Board FEDS Note, June 2.
Stock, James, 2011. "Comment on Inflation Dynamics and the Great Recession." In: Brookings Papers on Economic Activity (Spring), pp. 387402.
Watson, Mark W., 2014. "Inflation Persistence, the NAIRU, and the Great Recession." In: American Economic Review (Papers and Proceedings), May.
1. Address: Board of Governors of the Federal Reserve System, Washington DC 20551; Email: [email protected]; Phone: (1)202-452-2448. The author is Senior Associate Director, Office of Financial Stability and Policy Research, and Senior Adviser, Division of Research and Statistics, at the Federal Reserve Board. The views expressed herein are those of the author, and do not reflect those of the Federal Reserve or its staff. Return to text
2. The FOMC has defined its price objective as a rate of increase in the price index for personal consumption expenditures (PCE) of 2 percent per year (FOMC, 2012). In this note, I use the CPI rather than the PCE price index because measures of expected inflation as measured by the CPI have a somewhat longer history than is available for similar expectation measures for PCE prices. The qualitative and quantitative points emphasized herein do not hinge on the choice of price index used to frame the discussion. Return to text
3. This argument is perhaps best represented by Lucas (1976). Return to text
4. Ball and Mazumder (2011) and Stock (2011) are early examples. Subsequent studies include Gordon (2013), Krueger (2014), and Watson (2014). Return to text
5. Smith (2014a) presents a discussion of the links between short- and long-term unemployment and wages, along with references to related research. Return to text
6. Recent studies include Hamilton et al (2015), Johanssen and Mertens (2015), Kiley (2015), and Laubach and Williams (2015). Return to text
7. For a discussion and analysis, see Chung, Kiley, and Herbst (2015). Return to text
Please cite as:
Kiley, Michael T. (2015). "Low Inflation in the United States: A Summary of Recent Research," FEDS Notes. Washington: Board of Governors of the Federal Reserve System, November 23, 2015. https://doi.org/10.17016/2380-7172.1665
Disclaimer: FEDS Notes are articles in which Board economists offer their own views and present analysis on a range of topics in economics and finance. These articles are shorter and less technically oriented than FEDS Working Papers.