
FEDS Notes
 Print
PrintMarch 26, 2015
The recent slowdown in high-tech equipment price declines and some implications for business investment and labor productivity
David Byrne and Eugenio Pinto1
Investment in high-tech equipment spurred by rapidly falling prices has accounted for an important share of business investment and labor productivity growth since the 1970s (figures 1 and 2).2 During the present recovery, however, spending on high-tech equipment has been lackluster and a marked step-down in labor productivity growth since 2010 has been partly attributed to this weaker impetus from high-tech capital deepening, that is, the increase in high-tech capital services per worker. Labor productivity rose at an average annual rate of just 1 percent from 2010 to 2014 after rising at an average annual rate of 2 percent over the previous 5-year period; the contribution of high-tech equipment capital deepening slipped from 0.3 percentage point to 0.1 percentage point (figure 2). If sustained, the recent tepid pace of high-tech investment would also portend a subdued outlook for labor productivity going forward.
| Figure 1 |
|---|
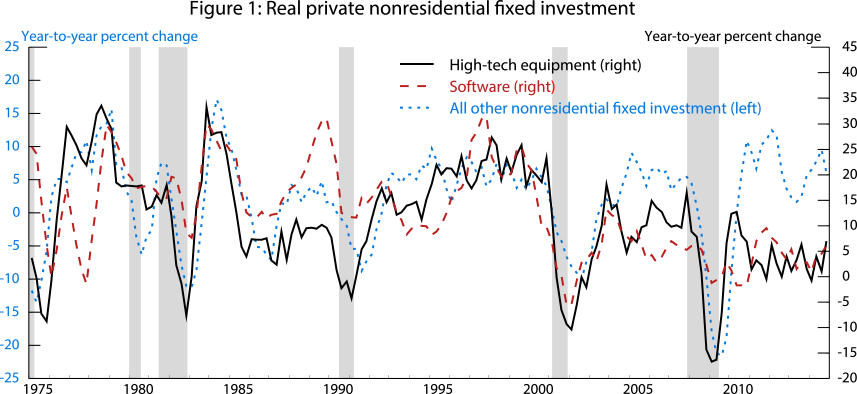 |
Note: shaded regions indicate recessions. Calcuations based on Bureau of Economic Analysis (BEA) and National Income and Product Accounts (NIPA, also commonly referred to as NIPAs) data.
| Figure 2 |
|---|
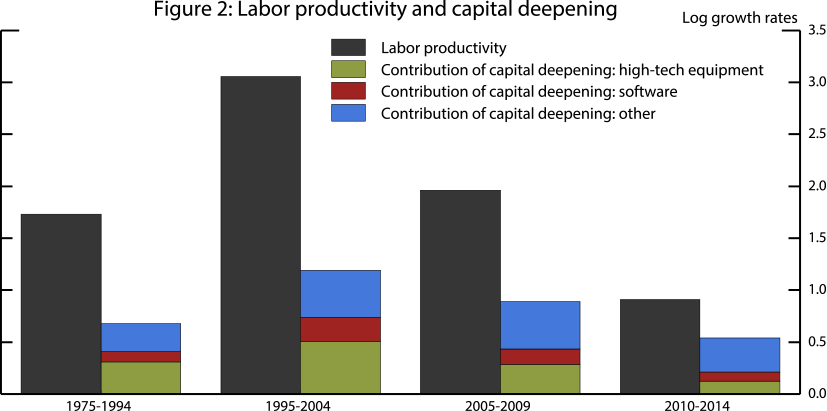 |
Note: Based on John G. Fernald, "A Quarterly, Utilization-Adjusted Series on Total Factor Productivity." FRBSF Working Paper 2012-19 (updated March 2014). Capital deepening constructed with trend hours growth based on a centered 15-year moving average.
From a measurement perspective, the slowing in business spending on high-tech equipment can almost entirely be attributed to a pronounced slowdown in the price index used to deflate current-dollar high-tech equipment investment in the National Income and Product Accounts (NIPAs) (figure 3). And, an anticipated continuation of tepid declines in high-tech prices seems to be an important factor underlying forecasts of slowing high-tech innovation and diminished potential output growth.3
| Figure 3 |
|---|
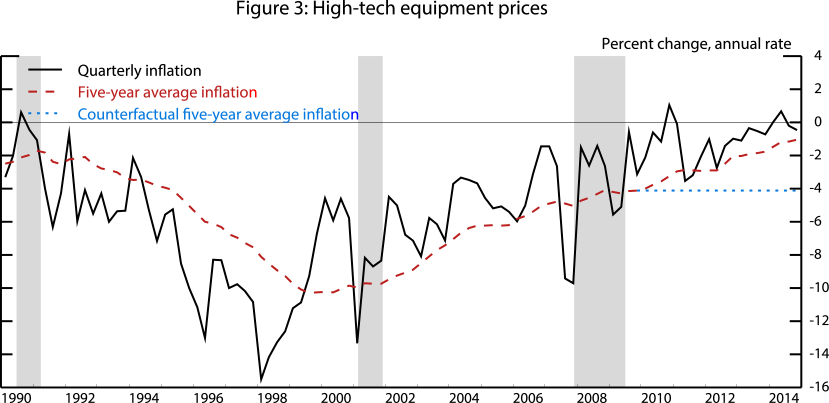 |
Note: High-tech equipment refers to information processing equipment in the NIPAs. Shaded regions indicate recessions. Calculations based on BEA and NIPA data.
In contrast, we believe this slowdown in the NIPA price deflator may be overstated--and business investment therefore understated--as a result of measurement problems caused by a marked shift in computer investment toward imports and less effective efforts to account for rising product quality reflecting, among other factors, the increasing importance of new products and the nature of the import prices data. For this reason, the deceleration of high-tech equipment price declines over the most recent five-year period should not be used as an indicator of slowing technical advance and prospective labor productivity gains well below 2 percent per year without due consideration of these issues.4
To assess the implications of the recent price trends, we consider an alternative scenario where high-tech equipment prices over the past five years continued to decline at a pace similar to that seen over the previous five years (figure 3). Based on this counterfactual shown by the blue dotted line, we estimate that the measured level of real spending on high-tech equipment would be 17 percent higher at the end of 2014 (worth 0.3 percent on the level of real GDP).5 Due to the sharp increase in import penetration of computer equipment in recent years, faster-falling computer prices would significantly raise real computer imports and only slightly increase exports, assuming a symmetric treatment to investment and net exports. Thus, the overall effect on observed GDP would likely be small, as the additional business investment would be largely offset by lower net exports. Similarly, the recent modest labor productivity gains would also not be revised up appreciably, although a portion of the increases in output-per-hour now attributed to total factor productivity would be shifted to capital deepening.
However, the additional business capital would have implications for the outlook for economic activity as it would improve assessments of the supply-side conditions of the economy. In particular, our counterfactual would imply that greater capital deepening would raise the level of trend productivity and potential output by 1/4 percent at the end of 2014 and, if the gap in price declines was carried forward, would raise potential output growth by between 0.1 and 0.2 percentage points per year after 2014. Historically, output has tended to rise at a pace similar to that of productive capital and, in keeping with this notion, the full impact of high-tech capital deepening on productivity has only appeared after a substantial lag, once complementary investment in software, training and other human capital, and intangible capital such as new business processes have been made.6 Thus, our estimated effects above should likely be considerably amplified over time if investment in complementary activities were to be taken into account.7
The slowdown in high-tech equipment price declines and its sources
The high-tech equipment price deflators employed in the NIPAs moved down at an average annual rate of 1 percent over the 5-year period ending in 2014Q4, 3 percentage points less rapidly than over the preceding 5-year period ending in 2009Q4 (figure 3).
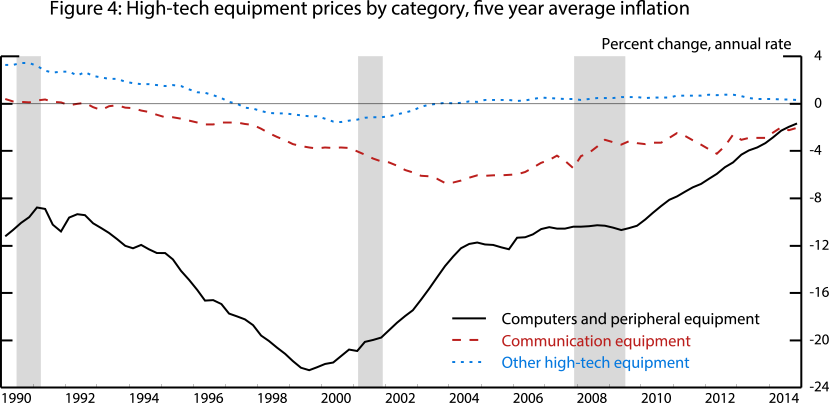
The underlying trends for the major product components of high-tech equipment differed significantly over this ten-year period: Prices for computers and peripheral equipment swung from falling at an average annual rate of 10.6 percent to falling at a rate of 2.3 percent, while the rates of decline for prices of communication equipment and for other high-tech equipment were little changed (figure 4). For this reason, we focus on computers and peripheral equipment, which accounted for more than 80 percent of the slowing of the decline in high-tech equipment prices.
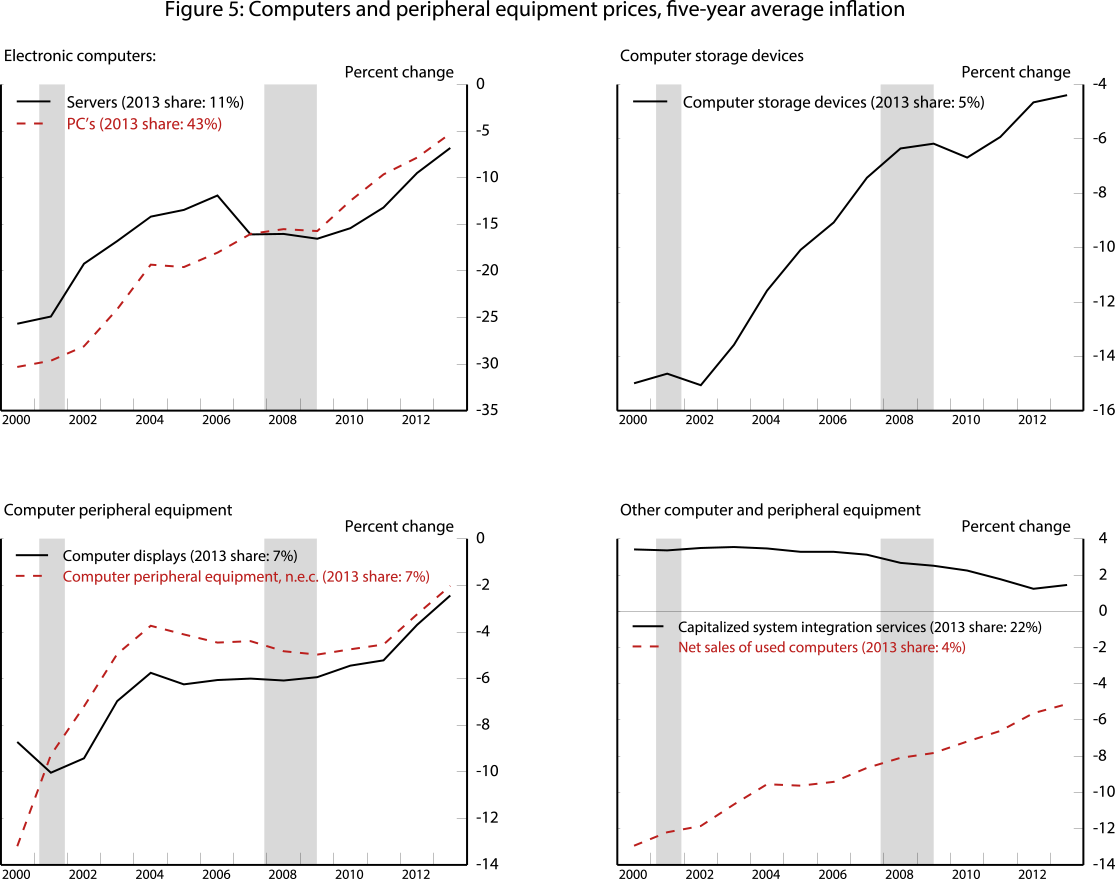
Within computers and peripheral equipment, investment price declines have slowed noticeably since 2009 for all components except capitalized system integration services (figure 5). Most notably, price declines for personal computers (PCs) and for multi-user computers (servers) have slowed markedly and account for almost 90 percent of the slowing in the pace of price declines for computers and peripherals overall.8
The flattening of computer prices is largely attributable to a jump in import penetration. Since 2010, the share of computer investment accounted for by domestic producers has been much lower than it was previously (figure 6), a consequence of the shuttering of some large domestic establishments in 2008-11.9 ,10 Because prices for imported computers have historically and recently fallen at a slower pace than the domestic price measures, this shift has depressed the rate of price declines for computers (figure 7). As shown by the dashed black line, by simply weighting the import and domestic price indexes, one can get very close to the NIPA investment price index.11
| Figure 6 |
|---|
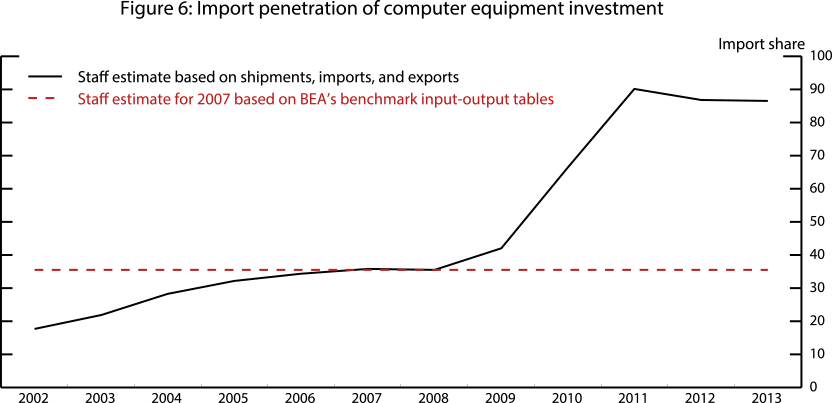 |
Note: Computer equipment includes PCs and servers and excludes peripheral equipment. Calculations based on data from the Census Annual Survey of Manufacturers, the Census and BEA U.S. International Trade in Goods and Services, and BEA Input-Output Tables.
Indeed, keeping the import share at its 2008 value would imply a price decline of computer equipment that is about 4 percentage points larger (from 4 percent to 8-1/4 percent, at an annual rate) on average during 2011-13. Slower-falling prices for domestically produced computers have also been a factor, but as a consequence of the rise in import penetration, their influence is minor in recent history (figure 7). Moreover, it seems likely that the composition of domestically-produced computers has changed dramatically since 2009 and that may have led to a marked narrowing in the gap between the domestic and import computer price indexes. If we adjusted the domestic price index to keep the average gap during the past five years at about its level during the previous five years, the weighted computer equipment price index would fall by an additional 4 percentage points (from 8-1/4 percent to 12-1/4 percent) on average during 2011-13.
| Figure 7 |
|---|
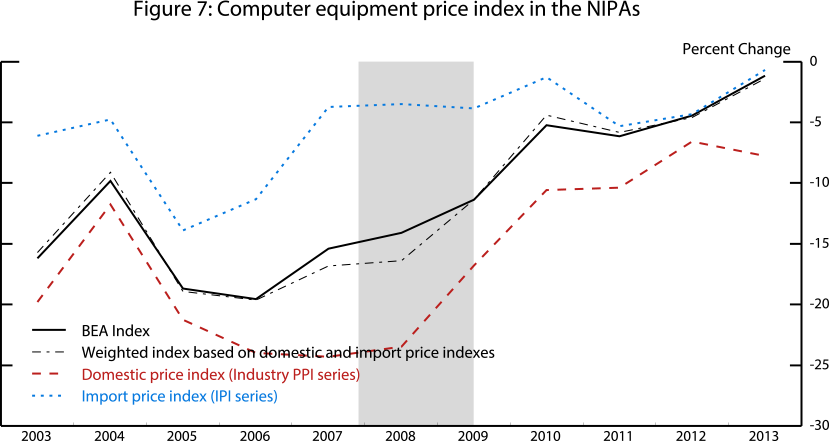 |
Note: Computer equipment includes PCs and servers and excludes peripheral equipment. Shaded region indicates recession. Calculations based on Bureau of Labor Statistics (BLS) price indexes, BEA data, and weights from figure 6.
Measurement challenges for the computer investment price index
Below, we explain how the computer price index used in the NIPAs is constructed and we discuss in some detail several measurement-related issues that cast doubt on the plausibility of recent trends in this index.
Construction of the NIPA computer price investment index
The NIPA computer investment price index is constructed by the Bureau of Economic Analysis (BEA) as a chain-weighted aggregate of Bureau of Labor Statistics (BLS) domestic producer price indexes (PPIs) and BLS import price indexes (IPIs) using relative importance weights derived from commodity flows data. We were able to closely track the computer investment price index by mimicking the BEA methodology and, as expected, the index falls much more slowly in recent years, primarily reflecting the greater influence of the IPI from 2011 forward (figure 7).
Estimation of the BLS price indexes
The BLS PPIs and IPIs used in the computer investment price index are estimated from prices for a sample of individual items as follows.12 An individual item is a specific computer model sold by a particular reporter with certain terms of sale. Item prices in successive months are matched to form price ratios. Because the linked prices are for identical items, these ratios measure price inflation with quality held constant. When an item exits the sample, the price of an item newly selected for inclusion is linked to the exiting item's price after judgmental adjustment for the difference in quality between the items. The item price ratios are aggregated using a weighted geometric mean formula to create a "matched model" price index for the product category.
When sufficient product feature information is available, hedonic regressions of model prices on technical features of the computers can be used to apportion a price change into contributions from quality changes versus price inflation.13 For example, consider an entering PC model with an additional 2 gigabytes of memory priced $100 higher than the otherwise identical exiting model. If the hedonic regression coefficient for 1 gigabyte of memory is $25, the price of the entering model would be reduced by $50 and the remaining $50 difference would be treated as price inflation. In the case of laptop PCs, desktop PCs, and servers, the adjustment of entering item prices to account for quality is informed by hedonic regressions of model prices on technical features of the computers.14
Potential bias from combining import prices and domestic producer prices
The approach used by BEA to construct investment price indexes for the NIPAs--aggregation of PPIs and IPIs--has a subtle shortcoming: When investment shifts from domestically-sourced equipment to comparable imported equipment, any associated price decline is not reflected in the investment price index. That is, the investment price index properly reflects the rates of change in domestic and in import prices, but does not reflect the difference in price levels between these markets. In effect, because the domestic production price and the import price are collected by distinct BLS price programs, identical items that are merely sourced differently are treated as distinct products, and the aggregation of PPIs and IPIs treats the entire discount associated with switching to a lower-cost imported computer as a reflection of inferior quality. Recent research has shown that failing to capture the substitution from domestically-produced to imported goods results in understatement of price declines.15
Potential bias from incomplete quality control in the BLS price indexes
Although laudable, in several respects the BLS efforts to control for quality in their price indexes for domestically-produced and imported computers appear incomplete. These shortcomings make the BLS price measures somewhat unreliable and suggest they may understate the pace of price declines in recent years.16
- Inadequate information on product characteristics: Because observations used in the BLS imported computer index are essentially collected from importers rather than producers, they likely contain insufficient information to employ the hedonic adjustment discussed above.17 In such cases, BLS price analysts judgmentally split the price premium for the entering product into a quality component and a pure price difference component.18 In principle, the choice made by the price analyst may overstate or understate the share of a price premium corresponding to quality difference. That being said, in cases where supporting evidence on characteristics is not available, BLS price analysts may tend to attribute the difference between the prices of entering and exiting items to inflation, rather than quality. In the computer market, where model prices fall over time and new models typically enter with relatively high prices due to new features, this may well lead to understatement of price declines.
- Delayed introduction of new products to the indexes: Innovative computing platforms rapidly gain market share by offering the user better performance at a lower relative price. In practice, delayed incorporation of a new product in a price index can lead to understatement of price declines.19 This appears to have been a significant problem for the BLS import price index in recent years. Specifically, tablet PCs, which penetrated the computer market rapidly in 2010, were not introduced in the import price index until August, 2012, when they had already obtained noteworthy market share.20
- Products that may need further attention: Products other than laptop PCs, desktop PCs and servers may require more careful effort to control for quality. Most notably, the BLS does not estimate a hedonic model for tablet PCs. This limits the options available to price analysts attempting to control for quality in this increasingly important product.
- Indirect control for performance in BLS hedonic models: The hedonic models used by the BLS to account for quality in PCs and servers employ a set of variables corresponding to technical features of the equipment, such as the amount of memory and the speed of the processor, rather than direct measures of the performance of the equipment on tasks of interest to the user.21 Recent work suggests that, particularly in the past five years, direct control for performance, rather than an input-based hedonic specification, produces markedly faster price declines for microprocessors (MPUs).22 Because MPUs are a central component of PCs and servers, this suggests that the same approach may be needed for those platforms as well.
Potential bias from transfer prices in the import price index
The BLS import price index is composed of both market prices and transfer prices, that is, prices from exchanges between affiliated parties (e.g. subsidiaries in a multinational company). Transfer prices accounted for 61 percent of the value of computer and electronic products imports included in the IPI for computers in 2013.23 These prices may be affected by tax avoidance and other corporate strategies to minimize costs.24 However, though the transfer price level may be expected to differ from a hypothetical price established in market competition, it isn't immediately apparent that a bias to the growth rate would be introduced by the inclusion of transfer prices. Nevertheless, it is important to bear in mind that the IPI is to a significant extent a measure of the prices used for internal accounting of inventory investment by computer companies, rather than the market price paid by businesses investing in capital.
1. We thank Christina Hovland at the Bureau of Economic Analysis, and Steve Sawyer and Phil Sturm at the Bureau of Labor Statistics for providing helpful information. We also thank Tyler Hanson for extensive research assistance. Return to text
2. High-tech equipment corresponds to the "information processing equipment" category in the NIPAs and consists of computers and related equipment, communication equipment, electro-medical equipment, instruments, photocopy and related equipment, and office and accounting equipment. Return to text
3. See Mellman and Feroli, "U.S. capital spending: high-tech is low growth," JP Morgan, February 27, 2014; Gordon (2014), "The Turtle's progress: Secular stagnation meets the headwinds," in Teulings and Baldwin, eds. (2014), Secular Stagnation: Facts, Causes and Cures, http://www.voxeu.org/content/secular-stagnation-facts-causes-and-cures; and Fernald (2015), "The Recent Rise and Fall of Rapid Productivity Growth." FRBSF Economic Letter, February 9. Return to text
4. Recent advances in information technology (IT) cannot be assessed by examining high-tech equipment alone, as software currently accounts for a similar share of IT spending. However, only one-fourth of software investment (prepackaged software) features quality-adjusted prices in the NIPAs: after slowing considerably in the early 2000s, price declines of prepackaged software have not decelerated further over the past 5 years (not shown). Return to text
5. This would bring the average annual percent change in real high-tech equipment investment over the current recovery from 5-1/4 percent to 8-1/2 percent, just a bit below the average gains seen in the previous expansion (10 percent). Return to text
6. See Brynjolffson, Hitt, and Yang (2002), "Intangible assets: Computers and organizational capital," Brookings Papers on Economic Activity. Return to text
7. We estimate that the high-tech equipment real capital stock would be 7 percent higher by the end of 2014 and that the high-tech equipment share of capital income would gradually rise, essentially reflecting a boost to the user cost of capital from faster price declines. Accordingly, the level of total real capital services would be 3/4 percent higher at the end of 2014, and would rise 1/4 percentage point per year faster after 2014. Return to text
8. Net sales of used computers also accelerates dramatically. This portion of investment is deflated by a composite index built from, among other pieces, the same price indexes as PCs and servers. Return to text
9. After a wave of offshoring by other companies in the wake of the 2001 downturn, Dell Inc. accounted for the lion's share of U.S. domestic PC production. The company closed plants in Austin, Texas (2008), Lebanon, Tennessee (2009), and Winston-Salem, North Carolina (2010), and shifted production for the U.S. market to Mexico and other offshore locations. A Dell plant in Florida continues to produce highly-specialized PCs. Return to text
10. The import share of storage devices and other computer peripheral equipment have remained little changed since 2008, at about one-half and two-thirds respectively. Return to text
11. We used detailed domestic producer price indexes (PPIs) and import price indexes (IPIs) to create a domestic price index (dashed red line) and an import price index (dotted blue line) for computer equipment. Using the import share in figure 6, we were then able to create a measure of the computer investment price index (dash-dotted black line) which closely tracks BEA's estimate (solid black line). Return to text
12. The same methodology is used for peripheral equipment, except that hedonic indexes are not estimated for use in price adjustment. Return to text
13. Indeed, quality difference could more than account for a higher price for an entering item, in which case the quality-adjusted item price would decline even if the observed item price had increased. Return to text
14. Regressions are performed quarterly with a supplemental dataset. For a description of BLS PPI hedonic adjustment methodology, see Holdway (2001), "Hedonic Models in the Producer Price Index," www.bls.gov/ppi/ppicomqa.htm. The same method is employed for import prices. Return to text
15. See Houseman, Kurz, Lengermann, and Mandel (2011), "Offshoring Bias in U.S. Manufacturing," Journal of Economic Perspectives. Return to text
16. While the bias introduced by these issues is not known, it is worth noting that the "Boskin Commission" found that incomplete quality adjustment and delayed introduction of new products introduced a substantial upward bias to the CPI. See Gordon (2006), "The Boskin Commission Report: A Retrospective One Decade Later," International Productivity Monitor. Return to text
17. The sample of U.S. importers is derived from Custom and Board Patrol consumption entry documents and the detailed products are selected after an interview with a BLS economist. In general, the majority of detailed products cannot be consistently priced over time as nearly 40 percent of monthly observations contain price data for newly introduced products. The proportion of new products is almost certainly much higher for computer equipment and importers probably lack enough knowledge about the detailed specifications of the new products they are importing. Return to text
18. Three options are commonly employed by BLS: (1) link the entering item directly to the exiting item--attributing all of the price difference to inflation, (2) link the first change (the "price relative") in the new item price to the last change in the old item price--attributing all of the price difference to quality, and (3);linking to the "cell relative price", a technique that assumes that price inflation for the entering item equals the average across all observed items in the previous period. Return to text
19. This was dramatically the case for the CPI when cell phones were only introduced to the index long after they had become popular. See Hausman (1999), "Cellular Telephone, New Products, and the CPI," Journal of Business & Economic Statistics. However, if prices of incumbent products adjust quickly to equate quality-adjusted prices to the entering product, the price index may properly reflect the influence of the omitted product. Return to text
20. JP Morgan estimates that the size of the U.S. tablet market was $20 billion for 2012 and accounted for 31 percent of PC sales. See "2014 Tablet Model Update," November 7, 2014. Return to text
21. Whether a particular hedonic regression without controls for directly measured performance can be used to adequately control for quality is an empirical question. See Pakes (2002), "A Reconsideration of Hedonic Price Indices with an Application to PCs," NBER Working Paper No. 8715. Return to text
22. See Byrne, Oliner, and Sichel (2014), "How Fast are Semiconductor Prices Falling?" AEI Economic Policy Working Paper Series. Return to text
23. Related-party trade accounted for 50 percent of the value of imported goods in 2013. See "U.S. Goods Trade: Imports & Exports by Related-Parties 2013 (PDF)," May 6, 2014. Return to text
24. For discussion of transfer prices, see Clausing (2000), "The Behavior of Intrafirm Trade Prices in U.S. International Price Data," www.bls.gov/ore/abstract/ec/ec010010.htm. Return to text
Please cite as:
Byrne, David M., and Eugenio P. Pinto (2015). "The Recent Slowdown in High-Tech Equipment Price Declines and Some Implications for Business Investment and Labor Productivity," FEDS Notes. Washington: Board of Governors of the Federal Reserve System, March 26, 2015. https://doi.org/10.17016/2380-7172.1512
Disclaimer: FEDS Notes are articles in which Board economists offer their own views and present analysis on a range of topics in economics and finance. These articles are shorter and less technically oriented than FEDS Working Papers.
