
FEDS Notes
 Print
PrintDecember 5, 2016
Inflation Perceptions and Inflation Expectations
Alan Detmeister, David Lebow, and Ekaterina Peneva
According to surveys, consumers tend to expect future inflation that is higher than official estimates of current inflation. Inflation expectations of consumers also tend to exceed those of professional forecasters and those inferred from financial-market prices.1 Given the presumed role of inflation expectations in influencing actual inflation, it is important to understand the implications of the survey expectations and whether differences from official estimates contain an important signal. Do survey respondents actually expect inflation to be higher in the future than it is now, or do they think current inflation is higher than official statistics?
Insight may come from better understanding individuals' perceptions of recent inflationwhat consumers think inflation has been in the past. In this note, we discuss new data on consumers' perceptions of recent inflation from the University of Michigan Surveys of Consumers (MSC). Our preliminary results show that survey responses indicate inflation perceptions differ widely across individuals (with a slightly wider distribution than for inflation expectations) but the bulk of responses are between zero and five percent. Most individuals' inflation perceptions are similar to their inflation expectations, with the central tendencies of both distributions a little above official estimates of inflation. On balance, survey respondents do not expect inflation to change in the future relative to the recent past. Inflation perceptions, as with inflation expectations, vary by gender and income, though a correlation between perceptions and age is less clear. Even controlling for demographics, respondents with higher perceived inflation also tend to expect higher inflation, suggesting that changes in inflation perceptions could lead to changes in inflation expectations as well.
Survey results on inflation perceptions
The Federal Reserve contracted the MSC Research Center to include questions on inflation perceptions. The questions were posed in February, May, and August of this year (and will be repeated in November). In this note, we focus on the responses from the February and May surveys but we plan on updating the analysis when we have the responses from all four 2016 surveys. The two new questions:
Past one-year perception: During the past 12 months, do you think that prices in general went up or went down, or stayed where they were a year ago? By about what percent do you think prices went up/down, on the average, during the past 12 months?
Past five-to-ten-years perception: What about prices over the past 5 to 10 years? Do you think prices now are higher, about the same, or lower than they were 5 to 10 years ago? By about what percent per year do you think prices went up/down, on the average, during the past 5 to 10 years?
are worded consistently with the MSC questions on inflation expectations:
One-year ahead expectation: During the next 12 months, do you think that prices in general will go up, or go down, or stay where they are now? By about what percent do you expect prices to go up/down on the average, during the next 12 months?
Five-to-ten-years ahead expectation: What about the outlook for prices over the next 5 to 10 years? Do you think that prices will be higher, about the same, or lower, 5 to 10 years from now? By about what percent per year do you expect prices to go up/down on the average, during the next 5 to 10 years?
Figure 1 shows the distributions of the answers and Table 1 contains summary statistics. (We show data for the February responses only; the results from the May and August surveys are broadly similar.)
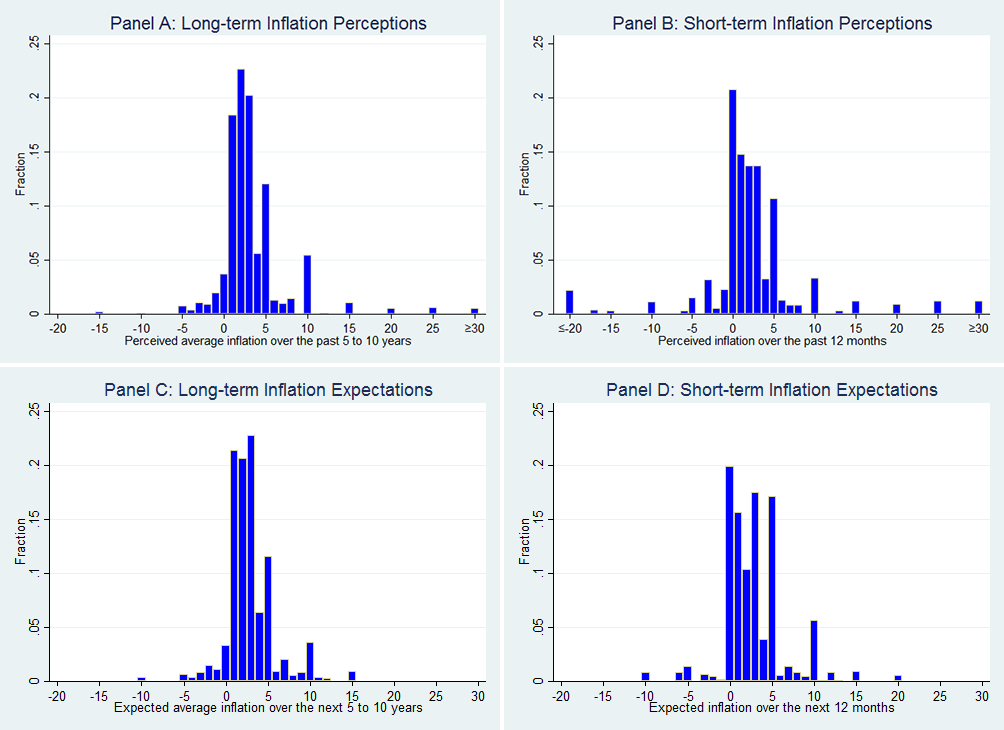 |
Source: University of Michigan Surveys of Consumers. Authors' calculations. Weighted.
As the histograms make clear, for each of the four distributions, the bulk of responses are in the range of 0 to 5 percent. Thus, the responses for inflation perceptions appear broadly similar to those for inflation expectations. That said, the distribution of perceptions is somewhat wider than for expectations, with a substantial minority of respondents perceiving inflation to have been materially outside a 0 to 5 percent range.2 Below we examine the robustness of our results to some modest trimming of outliers.
The central tendencies of the responses for both inflation perceptions and expectations are somewhat higher than the published inflation data (Table 1). This is especially true for the means, as the distributions are slightly skewed to the right; trimming just a few outliers brings the mean, especially for perceptions, down toward the median.3 The median perception of inflation over the past 5-to-10 years, at 2-1/2 percent, is about 3/4-to-1 percentage point higher than officially published inflation over that time, whereas the median perception of inflation over the past 12 months, at 1-3/4 percent, is only about 1/2 percentage point above official estimates of inflation. Of course, inflation over the 12 months ending in February 2016 was relatively low (around 1-1/4 percent), so the fact that the 12-month perceptions are lower than the 5-to-10 year perceptions is consistent with the data.
Adjusting consumers' expectations for 2-1/2 percent long-run inflation by 1 percentage pointthe difference between the median perceived and average published PCE inflation over the past 5 to 10 yearssuggests that consumers' expectations are roughly consistent with officially measured inflation over the next 5 to 10 years that is below the Federal Reserve's objective of 2 percent (for the PCE price index).
For readers who are concerned by even the modest differences between perceived inflation and the published inflation data, we ask you to reflect upon the difficulty of the problem posed to survey respondents. Although some respondents might be familiar with recent published inflation data and base their responses on that knowledge, we surmise that the large majority instead base their responses on their own experiences.4 To do so, such respondents must consider the wide range of prices they encounter, which can and do move quite differently from one another over time. Some items are purchased infrequently; some items will have changed over time so that a direct price comparison is complicated or not meaningful; and pricing of some items (like cell phone service plans) may be quite complex. Even for individuals who pay close attention to the prices they face, performing a rough mental aggregation of all those different price movements is challenging.
| Perceived over past 5-to-10 years | Expected over next 5-to-10 years | Perceived over past 12 months | Expected over next 12 months | |
|---|---|---|---|---|
| 10th Percentile | 0.6 | 0.6 | -2.0 | -0.2 |
| 25th Percentile | 1.4 | 1.3 | 0.1 | 0.6 |
| Median | 2.5 | 2.5 | 1.7 | 2.5 |
| 75th Percentile | 4.4 | 3.9 | 3.5 | 4.7 |
| 90th Percentile | 7.3 | 5.5 | 6.4 | 7.2 |
| Standard Deviation | 4.6 | 2.9 | 6.5 | 3.7 |
| Range 90th-10th | 6.7 | 4.9 | 8.4 | 7.4 |
| Asymmetry (90,10) | 2.9 | 1.1 | 1.0 | 2.0 |
| Mean | 3.4 | 2.9 | 2.5 | 2.9 |
| 2% Trimmed mean | 3.0 | 2.8 | 2.2 | 2.9 |
| Observationsb | 496 | 496 | 493 | 505 |
| Actual CPIc | 1.8 | (last 10 years) | 1.3 | |
| 1.5 | (last 5 years) | |||
| Actual PCE pricec | 1.6 | (last 10 years) | 1.1 | |
| 1.4 | (last 5 years) |
a The mean, median, 25th, and 75th percentile are as reported by the Michigan survey using the survey procedures for imputing missing data and adjusting for extreme responses (see Curtin, 1996). The trimmed mean, 10th, and 90th percentile are authors' calculations, in which we try to replicate the survey procedures for imputing missing data, adjusting for extreme values, and interpolating between integers. Asymmetry (90,10) is defined as (90th percentile - median) - (median - 10th percentile). The trimmed mean is obtained by omitting the largest 2 percent and the smallest 2 percent of the unweighted observations. Return to text.
b Number of people who gave a numeric answer or answered that prices went/will go up/down but did not give a numeric answer. Return to table.
c Through January, 2016. Return to table.
Furthermore, the finding that inflation perceptions tend to be above inflation as measured by the official price indexes may not be surprising for a number of reasons. First, consumers tend to recall price increases more readily than price decreases.5 Second, perceptions of inflation tend to be more heavily weighted toward more frequently purchased items, and over the past 10 or so years, inflation for these items has averaged a little higher than for the overall CPI.6 Finally, consumers' perceptions of inflation may not fully (or at all) adjust for quality changes and shift in consumer preferences in the way that official price indexes do.7
Interestingly, some other attempts to measure inflation perceptions have yielded perceptions that exceed the official inflation statistics by much more than the responses shown here. For recent U.S. experience, estimates from a Zogby poll (2016) conducted in early June of this year showed median inflation perceptions of 10 percent over the past year. Estimates for several European countries are similarly high (see Biau et al., 2010 or Giovane et al., 2009). 8 However, based on a 2008 U.S. survey, Bruine de Bruin et al. (2012) report a median perceived change in prices over the preceding year of 5 percent, not far from the 12-month change in CPI, which was running between 4 and 5 percent for most of that year.
The demographics of long-term inflation perceptions and expectations
Previous researchers have noted that inflation expectations tend to differ systematically for different groups of respondents, varying by gender, age, race, and income.9 Here we examine some of those correlations for both perceptions and expectations of long-run inflation.10 To sidestep the influence of extreme responses in the smaller samples, in Table 2 we only report results for the medians and the trimmed means for the various demographic groups. Consistent with previous studies, we find that women tend to both perceive and expect higher inflation than men, with the difference being fairly sizable for perceived inflation. We also find that inflation perceptions and expectations tend to decline with income, and while inflation expectations are slightly lower for respondents less than 45 years old, perceived inflation is quite similar for the three age groups we consider.
In interpreting these results for different groups of respondents, one must remember that individuals with different consumption profiles, or shopping in different locations, will likely have different experiences with inflation. Thus, differing inflation perceptions could reflect those different experiences, rather than different perceptions of similar experiences.11
| Perceived | Expected | |||
|---|---|---|---|---|
| Median | 2% Trimmed mean | Median | 2% Trimmed mean | |
| Full sample | 2.5 | 3.0 | 2.5 | 2.8 |
| Gender | ||||
| Male | 2.3 | 2.6 | 2.4 | 2.6 |
| Female | 2.8 | 3.7 | 2.6 | 3.0 |
| Race | ||||
| White | 2.5 | 2.9 | 2.5 | 2.7 |
| Nonwhite | 2.6 | 3.4 | 2.4 | 2.9 |
| Income percentiles | ||||
| Bottom quartile | 2.8 | 4.4 | 2.6 | 3.3 |
| Second quartile | 2.6 | 2.7 | 2.5 | 2.7 |
| Third quartile | 2.4 | 2.8 | 2.3 | 2.5 |
| Top quartile | 2.2 | 2.4 | 2.5 | 2.6 |
| Age groups | ||||
| 18-44 | 2.5 | 2.9 | 2.3 | 2.6 |
| 45-64 | 2.5 | 3.1 | 2.6 | 2.9 |
| 65+ | 2.6 | 3.0 | 2.6 | 2.8 |
a The trimmed mean and median for the demographic groups are authors' calculations, in which we try to replicate the survey procedures for imputing missing data, adjusting for extreme values, and interpolating between integers. The trimmed mean is obtained by omitting the largest 2 percent and the smallest 2 percent of unweighted observations. Return to text.
The relationship between inflation perceptions and inflation expectations
Turning back to table 1, the median expectation of inflation, both over the next 12 months and over the next 5-to-10 years, was 2-1/2 percent in Februarya little higher than the median perception of inflation over the preceding 12 months, but right in line with the median perceptions over the past 5-to-10 years. The histograms in figures 2 show that most respondents expect either no change or a very small change in the rate of inflation compared to their perceptions of recent history. The difference between individuals' expected and perceived inflation rates are distributed fairly tightly, and roughly symmetrically, around zero, with more than one-third of respondents expecting zero change in both the short- and the long-term inflation.
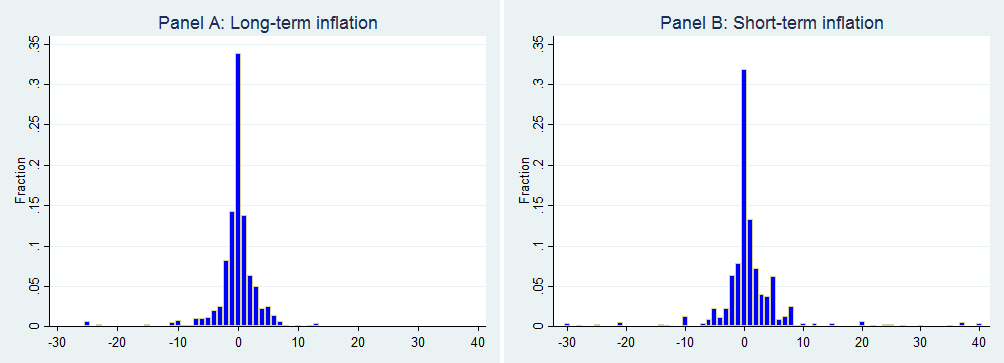 |
Source: University of Michigan Surveys of Consumers. Authors' calculations. Weighted.
To further examine this relationship, figure 3 shows scatterplots of reported inflation perceptions versus inflation expectations, along with simple regression lines. For the 5-to-10 year measures, there is a clear positive correlation (especially when we ignore three outliers with perceived inflation of 25 percent or higher). For the 12-month measures the correlation is weaker given the wider range of responses; but when we limit ourselves to individuals with both perceived and expected inflation that is between negative 10 percent and positive 15 percent (about 95 percent of the respondents who answered numerically the questions on both perceptions and expectations), a strong positive correlation becomes evident.
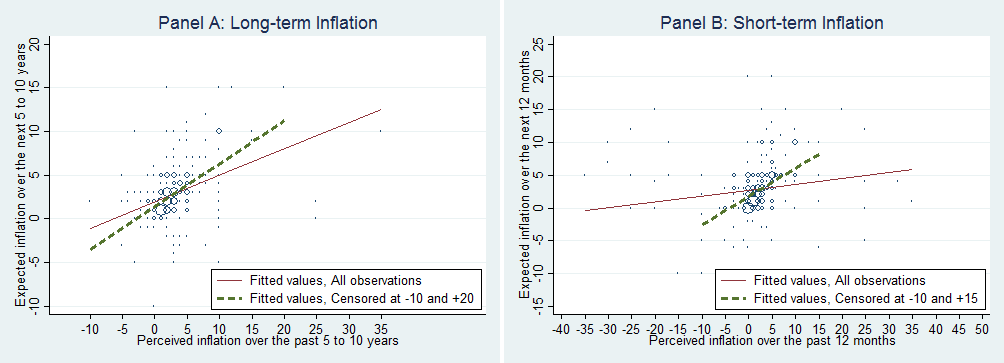 |
Source: University of Michigan Surveys of Consumers. Authors' calculations. Weighted.
From the late 1990s through mid-2014, MSC long-term inflation expectations were fairly stable, averaging about 2.9 percent. However, since mid-2014, these expectations drifted down, reaching a historic low reading of 2.4 percent in October of 2016. Has the downward drift in the Michigan survey's measure of longer-term inflation expectations also been associated with a change in inflation perceptions? Our new questions on inflation perceptions, available only for this year, cannot speak to this issue directly. However, the positive correlation between inflation perceptions and inflation expectations across respondents hints that if inflation perceptions were to drift (in either direction), expectations might follow suit. The simple regressions in Table 3 provide additional evidence on this point, showing that expectations of inflation over the next 5-to-10 years are positively related not only to perceptions of inflation over the past 5-to-10 years, but also to perceptions of inflation over the past 12 months.12 Consumer price inflation has been low since mid-2014, importantly reflecting the decline in crude oil prices and stronger exchange value of the dollar over this period; and as we saw in table 1, in February, respondents correctly perceived inflation to have been lower over the past 12 months than over the past 5-10 years. These results suggest to us that perceptions of recently lower inflation could have contributed to the decline in 5-10 year inflation expectations since mid-2014.13
Dependent variable: 5-to-10 year ahead inflation expectations.
All inflation variables limited to the range [-10, 20]
| Variable | Model 1 | Model 1 significance indicators | Model 2 | Model 2 significance indicators | Model 3 | Model 3 significance indicators |
|---|---|---|---|---|---|---|
| 5-to-10 year inflation perceptions | 0.43 | *** | 0.43 | *** | 0.40 | *** |
| Gender | 0.26 | * | 0.10 | |||
| Income | 0.01 | |||||
| 1 year inflation perceptions | 0.12 | *** | ||||
| Constant | 1.59 | *** | 1.18 | *** | 1.24 | *** |
| Adjusted R2 | 0.22 | 0.23 | 0.27 | |||
| No. of observations | 950 | 911 | 909 | |||
| No. of obs. out of the [-10, 20] range | 5 | 5 | 29 |
*** p<0.01, ** p<0.05, * p<0.1
References
Ashton, M. (2012) "'Real-Feel' Inflation: Quantitative Estimation of Inflation Perceptions." Business Economics. Volume 47, Issues 1. Pp 14-26.
Biau, O., Dieden, H., Ferrucci, G., Fritz, R. and Linden, S. (2010). "Consumers' Quantitative Inflation Perceptions and Expectations in the Euro Area: An Evaluation," Draft for New York Federal Reserve Bank Conference. October
Binder, C. (2015). "Measuring Uncertainty Based on Rounding: New Method and Application to Inflation Expectations," manuscript.
Bruine de Bruin, W., van der Klaauw, W., and Topa, G. (2011) "Expectations of Inflation: The Biasing Effect of Thoughts about Specific Prices." Journal of Economic Psychology, Elsevier, vol. 32(4), pages 834-845.
Bruine de Bruin, W., van der Klaauw, W., Downs, J.S., Fischhoff, B., Topa, G., and Armantier, O. (2010). "Expectations of Inflation: The Role of Demographic Variables, Expectations Formation, and Financial Literacy." Journal of Consumer Affairs 44(2), pages 381-402.
Bruine de Bruin, W., van der Klaauw, W., Downs, J.S., Fischhoff, B., Topa, G., and Armantier, O. (2012). "The Effect of Question Wording on Consumers' Reported Inflation Expectations." Journal of Economic Psychology, Elsevier, vol. 33(4), pages 749-757.
Bryan, M.F. and Venkatu, G. (2001). "The Demographics of Inflation Opinion Surveys." Federal Reserve Bank of Cleveland Economic Commentary Series.
Curtin, R. (1996). "Procedure to Estimate Price Expectations," Manuscript, University of Michigan Survey Research Center.
Georganas, S., Healy, P. and Li, N. (2014) "Frequency Bias in Consumers' Perceptions of Inflation," European Economic Review, 67, 144-158.
Giovane, P., Fabiani, S. and Sabbatini, R. (2008). "What's behind "inflation perceptions"? A survey-based analysis of Italian consumers," Temi di discussione (Economic working papers) 655, Bank of Italy, Economic Research and International Relations Area.
Kaplan, G. and Schulhofer-Wohl, S. (2016). "Inflation at the Household Level." NBER Working Paper 22331.
Meyer, B. and Venkatu, G. (2011). "Demographic Differences in Inflation Expectations: What Do They Really Mean?" Federal Reserve Bank of Cleveland Economic Commentary Series.
Nalewaik, J. (2016). "Inflation Expectations and the Stabilization of Inflation: Alternative Hypotheses." Finance and Economics Discussion Series, 2016-035. Washington" Board of Governors of the Federal Reserve System.
Sahm, C. and Sockin, J. (2016). "'Limited Attention' and Inflation Expectations of Households," FEDS Notes, Board of Governors of the Federal Reserve System (U.S.).
Vlasenko, P., and Cunningham, S. (2015) "Capturing the inflation that people experience: the Everyday Price Index vs the Consumer Price Index" American Institute for Economic Research working paper no. 004, June.
Zogby poll. (2016). "Perceived Inflation Index." http://www.zogbyanalytics.com/news/751-perceived-inflation-index.
1. For example, over the 10 years ending in 2015, on average, median expected inflation over the next 5 to 10 years from the Michigan Surveys of Consumers was about 3 percent while actual CPI inflation was 1-3/4 percent, and the median expected inflation over the next 10 years in the Survey of Professional Forecasters was about 2-1/4 percent for the CPI measure. The 10-year breakeven inflation rate, an indicator of expected inflation derived from yields on Treasury Securities and Treasury Inflation-Indexed Securities, was about 2 percent. Return to text
2. As with inflation expectations, inflation perceptions show heaping of responses at multiples of 5 percent. See Binder (2015) for an interpretation of the round number responses. Return to text
3. Because the responses to these inflation questions are coded in integers, the median and other percentiles of the distribution shown in table 1 are calculated by interpolation (see Curtin, 1996). For example, for purpose of calculating the percentiles, responses of 2 percent are assumed to lie uniformly between 1.5 percent and 2.5 percent. Return to text
4. When Michigan survey respondents are asked whether they recently heard of any "favorable or unfavorable changes in business conditions", only about 4 percent, on average, report having heard news about prices (see Sahm and Sockin, 2016). Moreover, the fact that the expectations/perceptions questions are phrased in terms of changes in "prices in general" (as opposed to "inflation") may make respondents more likely to base their responses on their own personal experiences (see Bruine de Bruin et al., 2012). Return to text
5. Bruine de Bruin et al. (2011) Return to text
6. Vlasenko and Cunningham (2015). For the frequency bias also see Georganas, Healy, and Li (2014). Return to text
7. For example, the Detroit Free Press (January 7, 2016) reported that average new car transaction prices increased 20 percent from 2005 to 2015 according to IHS Automotive. In comparison, the CPI index for new cars, which attempts to adjust for changes like shifts in the types of cars purchased and the addition of improved safety features, rose only 7 percent over the same period. Return to text
8. Ashton (2012) suggests some possible corrections to align perceptions with actual inflation measures. Return to text
9. See, among others, Bruine de Bruin et al. (2010), Bryan and Venkatu (2001), and Meyer and Venkatu (2011). Return to text
10. In these calculations we combine the data for long-term inflation expectations and perceptions from the February and May surveys, thereby providing more observations for each demographic group. The distributions for both long-term inflation perceptions and expectations for those two months are similar. Return to text
11. For example, using scanner data, Kaplan and Schulhofer-Wohl (2016) find that households' inflation rates are quite heterogeneous (with an interquartile range for annualized inflation rates that varies between 6.2 and 9 percentage points). The study also finds that most of the heterogeneity is due to variation in prices paid rather than variation in the consumption baskets. Return to text
12. In these regressions we use data from the February and May surveys and drop observations that are smaller than -10 percent or larger than 20 percent. If, instead, we use all observations, in Model 3, the coefficient on gender increases while the coefficients on long-term and short-term perceptions decline, and all coefficients are statistically significant at least at the 5 percent level. Return to text
13. Whether reductions in expectations contribute to holding down actual inflation is another matter. For a skeptical view, see Nalewaik (2016). Return to text
Please cite as:
Detmeister, Alan, David Lebow, and Ekaterina Peneva (2016). "Inflation Perceptions and Inflation Expectations," FEDS Notes. Washington: Board of Governors of the Federal Reserve System, December 5, 2016, https://doi.org/10.17016/2380-7172.1882.
Disclaimer: FEDS Notes are articles in which Board economists offer their own views and present analysis on a range of topics in economics and finance. These articles are shorter and less technically oriented than FEDS Working Papers.
