
FEDS Notes
 Print
PrintFebruary 3, 2016
Saving for College and Section 529 Plans
Simona Hannon, Kevin Moore, Max Schmeiser, and Irina Stefanescu 1
The past decade has simultaneously witnessed a substantial increase in enrollment at post-secondary institutions and a marked increase in college tuition. Not surprisingly, this trend overlapped with an increased demand for student loans and tax-advantaged educational savings. This discussion focuses on the latter and takes a closer look at the role of 529 plans, which are tax-advantaged savings vehicles specifically designed for financing education. First, we provide some basic information about the evolution and the defining features of these plans, including the demographic and financial information of the families who own them. Second, we describe the financial characteristics of these funds: investment options, investment and administrative fees, and risk-adjusted performance. Our analysis is based on 529-plan-level data from the College Savings Plans Network (CSPN), now summarized in the Federal Reserve Board's Enhanced Financial Accounts, the Survey of Consumer Finances (SCF), and Morningstar.2
1. Evolution and defining features of 529 plans
529 plans are state-sponsored college savings accounts named after section 529 of the Internal Revenue Code, which established the federal rules for these plans. Contributions to these plans are made from after-tax income; earnings on contributions grow tax-deferred and, as long as plan distributions are used for higher-education expenses, earnings remain tax-exempt.3 Typically, 529 plans can be transferred from one beneficiary to another. The investment strategy can change once a year or upon beneficiary change.4 While college savings plans are offered by 49 states and the District of Columbia, few of these plans have residency requirements.5
There are two types of 529 plans: savings plans and prepaid tuition plans. Savings plans offer individuals the option to participate in a state trust, which typically consists of mutual funds or portfolios of mutual funds. Prepaid tuition plans allow the purchase of future academic credits at current costs. In terms of distribution channels, 529 plans can either be direct-sold plans or advisor- or broker-sold plans.
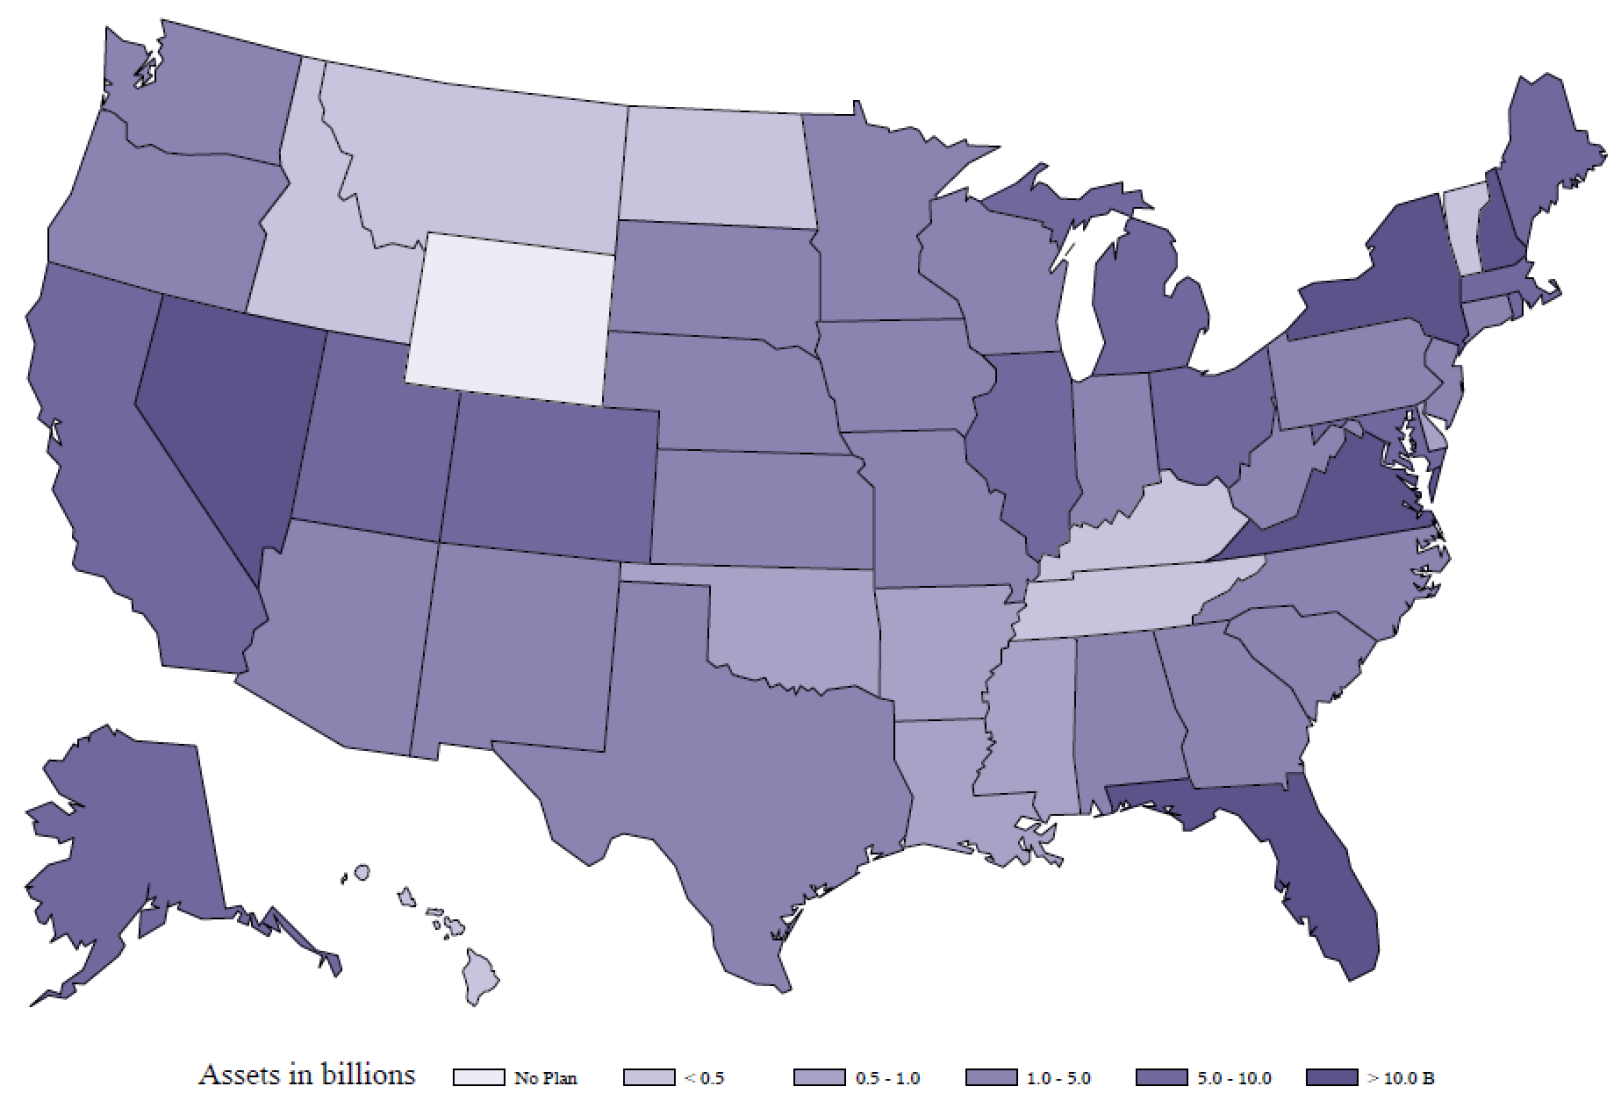
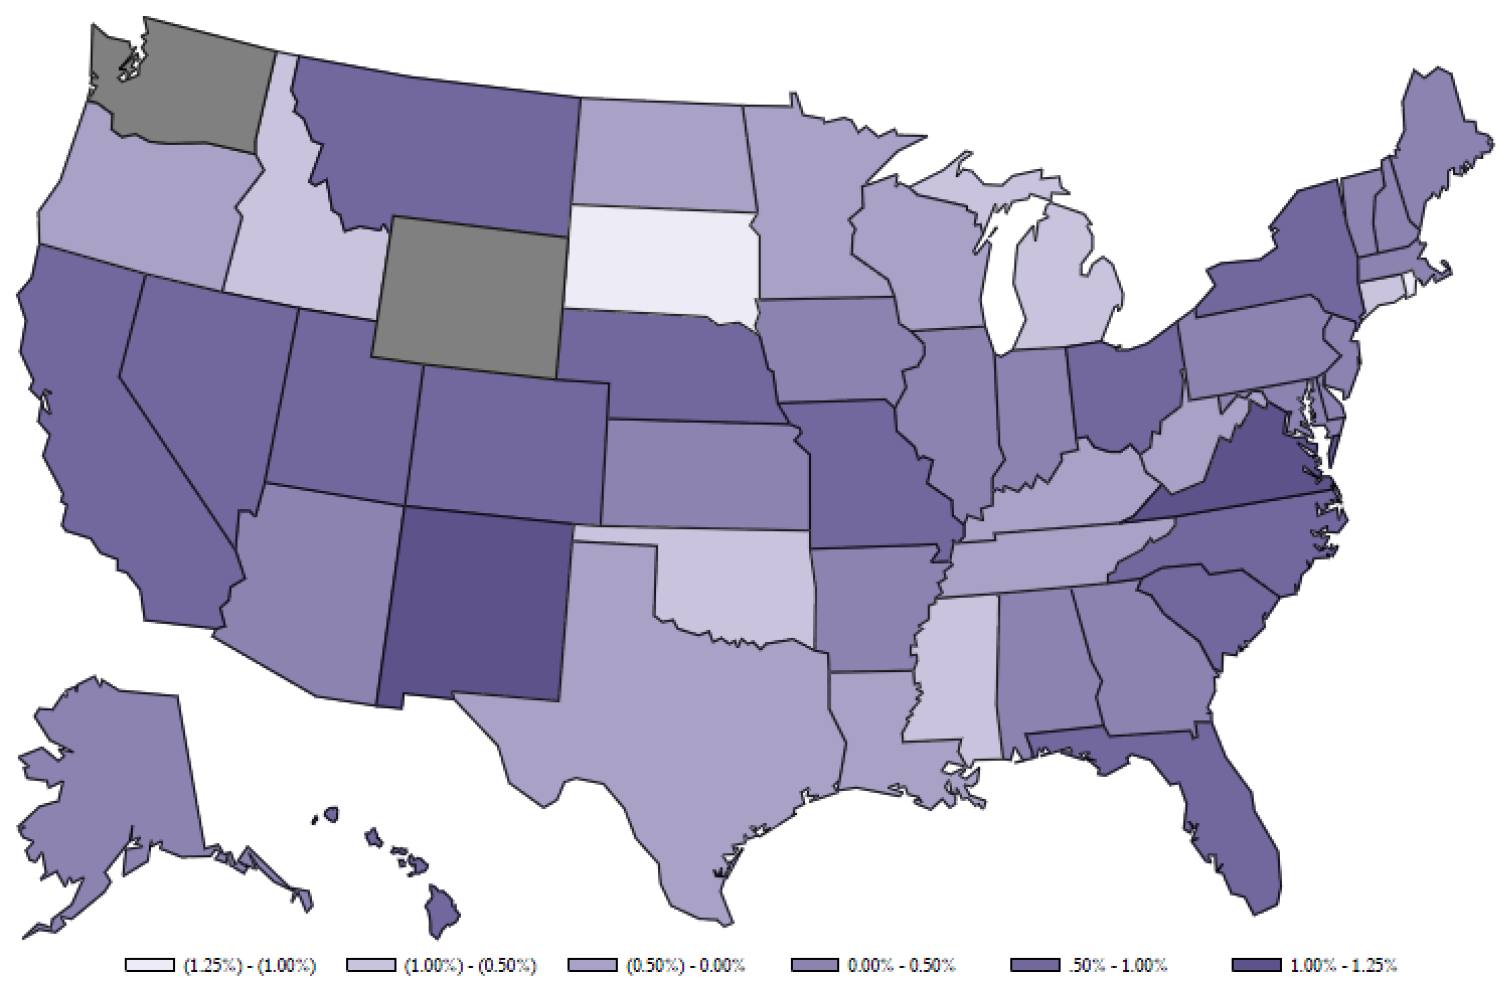
There were 108 unique 529 plans active in 2015, holding in aggregate $258.2 billion in assets. The fraction of prepaid plans is relatively small: Only 20 plans are active, and they hold only $24 billion in assets. Overall, there are 12.3 million accounts open (1.2 million for prepaid plans), and the average balance in each account is about $21,000 ($20,000 for prepaid plans). The size of these plans varies considerably by state, as shown in figure 1.6 529 plans in Virginia, New York, and Nevada collectively hold about 35 percent of all the assets.
2. Distributions out of 529 plans
Figure 2 shows the size of disbursements out of 529 plans relative to grants and student loans. Strikingly, disbursements from 529 plans are very small relative to other sources of college funding. However, in nominal terms, 529 plans' disbursements grew eight-fold, from less than $2 billion in 2004 to about $16 billion in 2014. Given the steep growth of 529 plans assets in the latest years and the approaching date for college enrollment of beneficiaries, the importance of these plans is expected to grow. Debt financing and grant use has steadily increased over this period, likely motivated by financial market developments and changes in borrower demographics.
| Figure 2: Financing education, by source and academic year (billion $) |
|---|
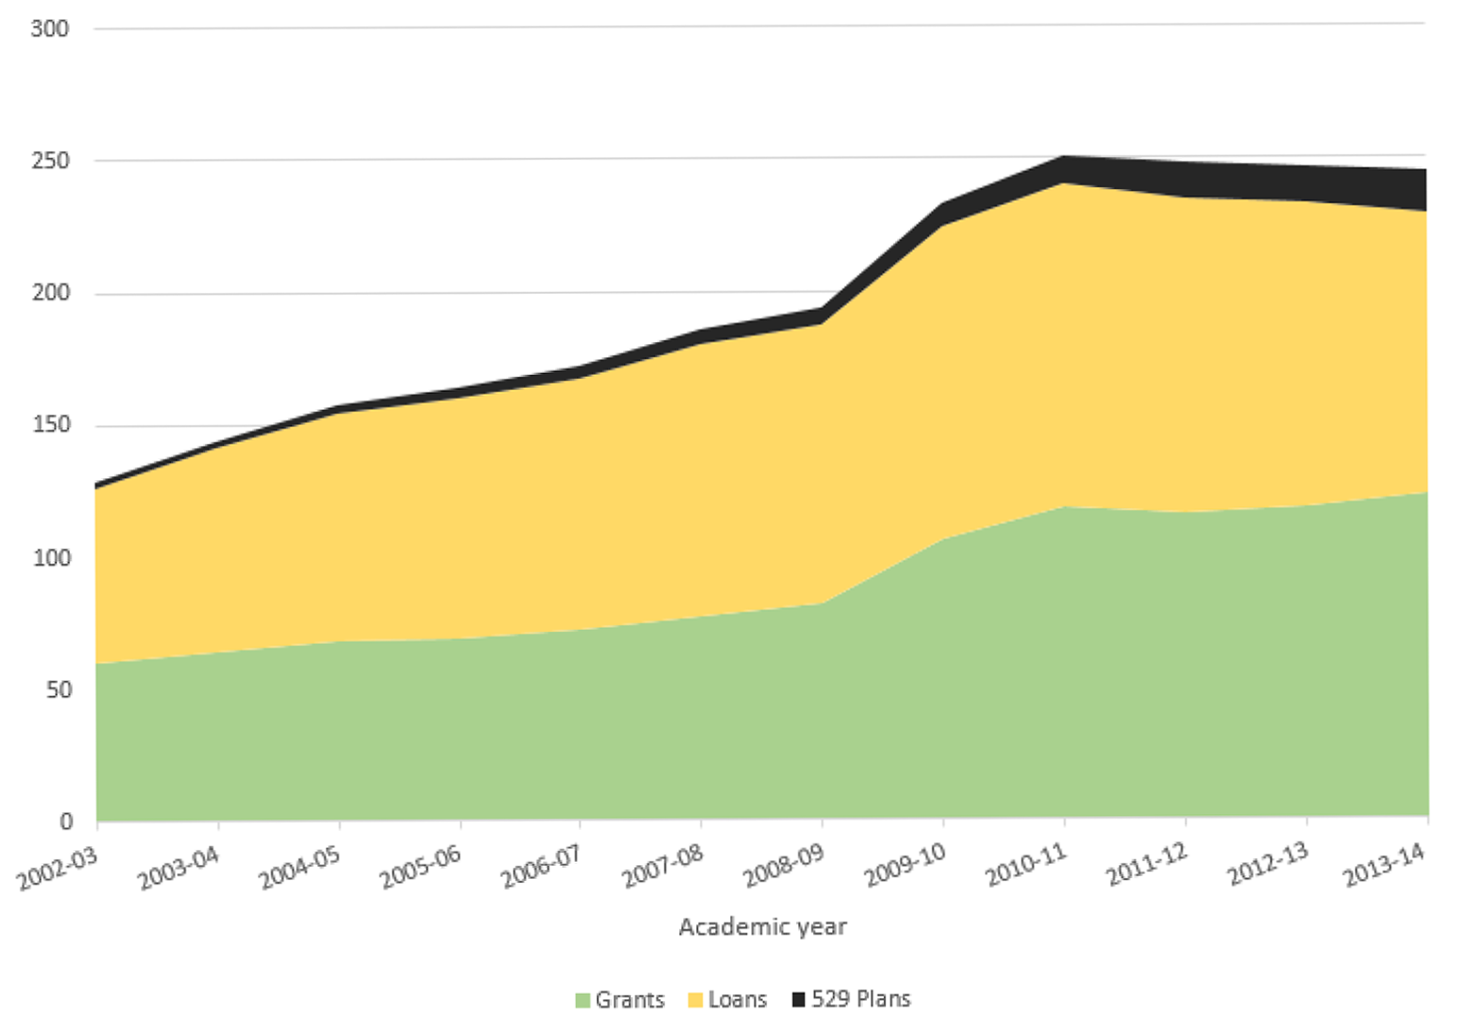 |
Source: CSPN website from 2008 to 2014, Trends in Student Aid publication.
Figure 3 shows that 529 plan assets have generally been growing at the same rate as student loans. The only exception occurred in 2008, when college saving plans' assets dipped with the market. They lost about 20 percent in value, falling from $113 billion in 2007 to $90 billion in 2008. Prepaid plan assets, which are presumed to represent the size of the state liability, grew smoothly over the period, reaching $24 billion (that is, about 10 percent of total 529 plan assets) in 2015.
| Figure 3: 529 plan assets relative to student debt (billion $) |
|---|
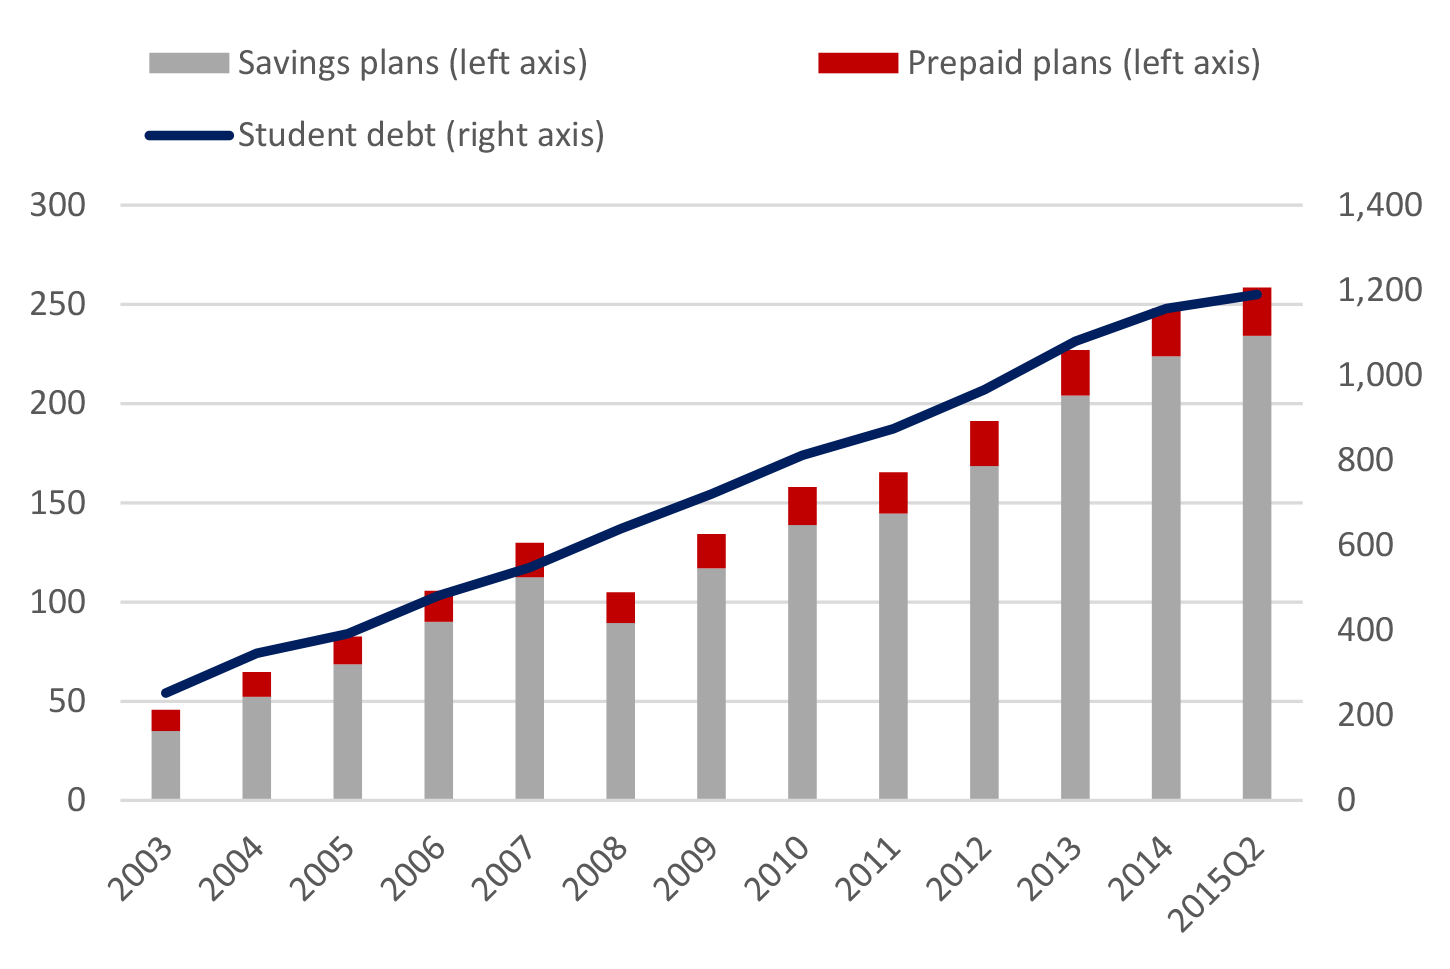 |
Source: For student loans, Federal Reserve Bank of New York Consumer Credit Panel/Equifax. For savings and prepaid plans, Morningstar.
3. Household characteristics: Evidence from the Survey of Consumer Finances
Understanding the characteristics of households holding 529 plans' accounts is important from a policy perspective. To this end, we obtain data on individual account holdings and balances from the SCF.
The SCF data provide snapshots of 529 plans' accounts and account balances by household income, wealth, and age, for the 2007, 2010, and 2013 survey years. We find that only 2.5 percent of all families had 529 college savings accounts in 2013. These families have significantly higher income and wealth than families who do not own such accounts. The distribution of account balances is highly skewed, as the median asset balance is substantially lower than the average.
Table 1 shows the percentage of families with a 529 plan account by percentiles of usual income for each survey year.7 By construction, this measure circumvents the temporary drop of incomes that many families experienced during the financial crisis. Overall, the percentage of households owning 529 plans has decreased over time. Focusing on the years 2007 and 2013 only, we note that all income groups below the 95th percentile experienced declines in 529 plan ownership.8 The only increase in ownership was experienced by families at the top of the income distribution.
| Table 1: Percent of households with a 529 savings account, by usual income percentile |
|---|
| Year | 2007 | 2010 | 2013 |
|---|---|---|---|
| All households | 3.1 | 2.2 | 2.5 |
| Usual income percentile | |||
| 0-49.9 | 0.5 | 0.1 | 0.3 |
| 50-89.9 | 3.8 | 2.3 | 2.9 |
| 90-94.9 | 12.5 | 9.5 | 7.9 |
| 95-100 | 14.8 | 14.9 | 16 |
Source: Survey of Consumer Finances.
Table 2 shows the average balance in a 529 account by income percentile. In contrast to the incidence of 529 plans across the usual income distribution, the average balance in these plans increased substantially for all groups except those above the 90th percentile of the distribution.
| Table 2: Average balance of 529 savings accounts conditional on ownership |
|---|
| Year | 2007 | 2010 | 2013 |
|---|---|---|---|
| All households | $44,100 | $63,000 | $55,900 |
| Usual income percentile | |||
| 0-49.9 | $24,400 | $13,800 | $32,700 |
| 50-89.9 | $20,100 | $20,800 | $25,600 |
| 90-94.9 | $39,500 | $49,600 | $26,900 |
| 95-100 | $103,500 | $127,700 | $119,300 |
Source: Survey of Consumer Finances.
We observe significant variation in account balances within each of the usual income groups, as the median account value (not shown) is approximately 20 percent of the average account value for the lowest income group and approximately 50 percent of the average account value for the other income groups. The substantially higher average than median account value reflects a significant number of high-balance accounts within each income group.
Next, we examine account ownership and the share of 529-plan assets across the household wealth distribution. Tables 3 and 4 show account ownership and account balances, respectively, for 529 plans across various wealth percentile groups. The gradation in account ownership and account balances is equally stark across the wealth distribution as in the income distribution, with substantially greater ownership rates and average account values as one moves up the wealth distribution.
| Table 3: Percent with a 529 savings account, by wealth percentile |
|---|
| Year | 2007 | 2010 | 2013 |
|---|---|---|---|
| All households | 3.1 | 2.2 | 2.5 |
| Wealth percentile | |||
| 0-49.9 | 0.6 | 0.5 | 0.3 |
| 50-89.9 | 4.5 | 2.1 | 3.4 |
| 90-94.9 | 7.1 | 9 | 8.8 |
| 95-100 | 12.8 | 12.7 | 11.2 |
Source: Survey of Consumer Finances.
| Table 4: Average balance conditional on ownership, by wealth percentile |
|---|
| Year | 2007 | 2010 | 2013 |
|---|---|---|---|
| All households | $44,100 | $63,000 | $55,900 |
| Wealth percentile | |||
| 0-49.9 | $2,500 | $6,800 | $3,800 |
| 50-89.9 | $21,300 | $18,700 | $26,200 |
| 90-94.9 | $50,100 | $51,000 | $43,300 |
| 95-100 | $126,700 | $154,000 | $152,300 |
Source: Survey of Consumer Finances.
Similar to the results for usual income groups, the average balance in these plans increased substantially for all groups. However, unlike the results by usual income group, the median account value for each wealth group is relatively close to the average account balance.
Finally, as reflected in table 5, we examined the incidence and account balances for 529 plans by the age of household head. Ownership rates are very similar for households with a head under age 45 or from age 45 to 65, and these rates have remained fairly constant from 2007 to 2013. Rates of account ownership for those over age 65 are generally quite low and have declined since 2007.
| Table 5: Percent with a 529 savings account, by age of household head |
|---|
| Year | 2007 | 2010 | 2013 |
|---|---|---|---|
| All households | 3.1 | 2.2 | 2.5 |
| Age of household head | |||
| < 45 | 3.5 | 2.5 | 3.5 |
| 45 to 64 | 3.5 | 3 | 2.8 |
| 65 or older | 1.6 | 0.4 | 0.5 |
Source: Survey of Consumer Finances.
Interestingly, although the oldest age group has the lowest ownership rates, it has the highest average account balance in 2007 and 2010 (shown in Table 6). The mean account balance for households with a head age 65 or older was $64,400 in 2007, jumped to $97,700 in 2010, and fell back to $47,200 in 2013.
| Table 6: Average balance conditional on ownership, by age of household head |
|---|
| Year | 2007 | 2010 | 2013 |
|---|---|---|---|
| All households | $44,100 | $63,000 | $55,900 |
| Age of household head | |||
| < 45 | $23,600 | $47,700 | $58,700 |
| 45 to 64 | $61,600 | $73,300 | $53,600 |
| 65 or older | $64,000 | $97,700 | $47,200 |
Source: Survey of Consumer Finances.
Households with a head aged 45 to 64 also had sizeable average balances of $61,600 in 2007, $73,300 in 2010, and $53,600 in 2013. For the youngest age group, average account balances increased substantially from 2007 to 2013, rising from $23,600 in 2007 to $58,700 in 2013. Given the fairly constant ownership rate for this group over the period, this result suggests increased saving in 529 plans by account holders in this age group. Median balances (not shown) exhibit a similar pattern as average balances across the age groups.
4. Portfolio allocation, fees, and the performance of 529-plan assets
In this section, we provide several summary statistics on the investment options available to 529-college-saving-plans investors. Our analysis focuses on actual balances accumulated in various asset classes, fund- and plan-level fees, and distribution channels. Our data are extracted from Morningstar, which provides detailed information on portfolio offerings and client choices for college savings plans. Our final sample covers 83 college savings plans, of which 54 plans are direct-sold and 32 plans are advisor-sold.9
529-college-savings-plan administrators typically offer a selection of investment portfolios to their clients. Each portfolio includes either one or several mutual funds. According to Morningstar, the number of portfolios varies from 5 to 345 per plan, with the median plan offering 26 distinct portfolios. Advisor directed plans typically offer significantly larger selections to their clients. Many of the menu portfolios are linked to the age of the beneficiary and offer a gliding path for the equity allocation that is very similar to target date funds.
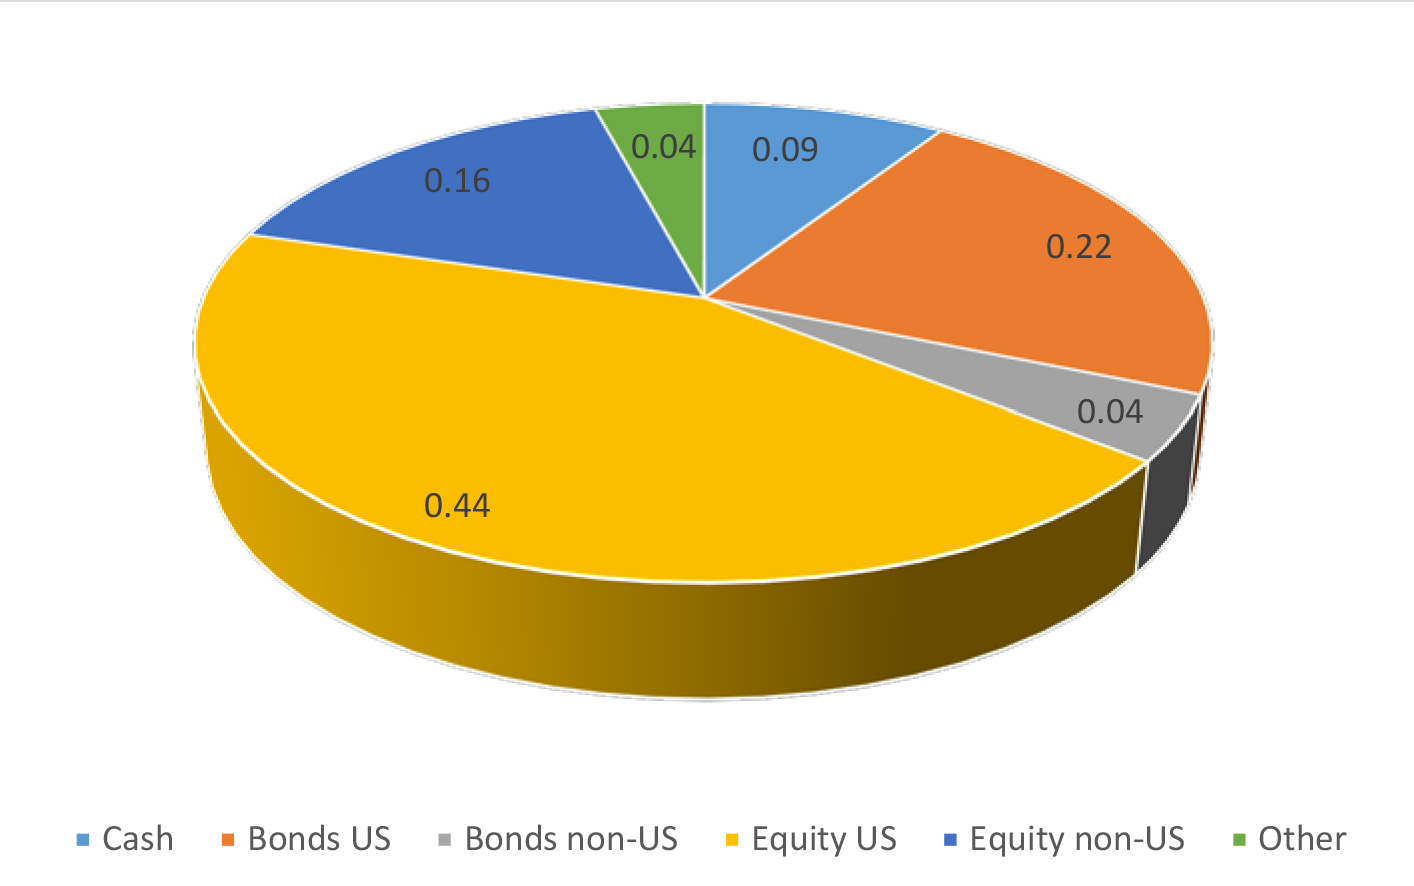
Figure 4 shows the overall asset allocation across various investment categories: a large percentage of 529-plan assets are invested in local and foreign equity (nearly 60 percent), followed by local and foreign bonds (about 25 percent), and cash (about 9 percent).
As shown in Table 7, fees and expenses vary significantly across distribution channels. We find that advisor-sold plans are typically more expensive and have lower performance compared to direct-sold plans. In the overall sample, the asset weighted expense ratio reached 80 basis points.10 Fees are notably larger in the advisor-directed plans, reaching an average of 128 basis points in 2014. For advisor-directed plans, distribution fees and maximum front-load fees reflect the cost of advising-related services. The table reveals that advisor-sold plans appear to be more expensive than direct sold ones across all fee categories.
| Table 7: Asset-weighted fees, as a percentage (2014) |
|---|
| Mean | Min | Max | |
|---|---|---|---|
| Direct (54 plans) | |||
| Expense Ratio | 0.51 | 0.13 | 1.05 |
| Distribution Fee | 0 | 0 | 0.19 |
| Underlying Fee | 0.24 | 0 | 0.93 |
| Max Front Load Fee | 0 | 0 | 0 |
| Program Manager Fee | 0.21 | 0 | 0.72 |
| Trustee Fee | 0.02 | 0 | 0.12 |
| Advisor (32 plans) | |||
| Expense Ratio | 1.28 | 0.58 | 1.88 |
| Distribution Fee | 0.35 | 0 | 0.55 |
| Underlying Fee | 0.58 | 0 | 0.92 |
| Max Front Load Fee | 3.12 | 0 | 5.39 |
| Program Manager Fee | 0.23 | 0 | 0.54 |
| Trustee Fee | 0.04 | 0 | 0.1 |
Source: Morningstar.
We also note significant variation across states. While contributions typically flow towards plans with lower fees, residency requirements constrain final allocations in several states. In figure 5, we show the weighted-average-expense ratios by state, aggregated across both advisor- and direct-sold plans.

Turning to overall performance, Table 8 presents the asset-weighted Sharpe Ratio, which is a measure of return per unit of total risk (or volatility).11 The table shows that advisor-directed plans perform worse than direct-sold plans. This is consistent with the empirical evidence in the mutual-fund literature showing that fees are the major driver for performance.
| Table 8: Asset-weighted Sharpe Ratio (2014) |
|---|
| Mean | Min | Max | |
|---|---|---|---|
| Direct (52 plans) | |||
| 1 year | 1.86 | 0.63 | 26.82 |
| 3 year | 1.31 | 0 | 3.09 |
| 5 year | 0.83 | 0 | 1.91 |
| Advisor (32 plans) | |||
| 1 year | 1.07 | 0.04 | 6.36 |
| 3 year | 1.16 | 0 | 4.59 |
| 5 year | 0.75 | 0 | 3.54 |
| All (84 plans) | |||
| 1 year | 1.56 | 0.04 | 26.82 |
| 3 year | 1.25 | 0 | 4.59 |
| 5 year | 0.8 | 0 | 3.54 |
Source: Morningstar.
Alternative measures for performance, such as portfolio alphas, show similar patterns. Portfolio alpha is commonly defined as the abnormal return in excess of what would be predicted by equilibrium asset pricing models.12 Figure 6 shows significant variation in alphas across states, mirroring the fee structure shown in Figure 5.13
Conclusion
Although 529 plans have increased their presence in the educational-savings space over the past decade, only a very small percentage of families save in these plans, and those who save typically tend to be at the higher end of the income and wealth distributions. The low incidence of 529 plan usage may reflect the limited flexibility of 529 plans relative to other tax-advantaged savings vehicles, such as Individual Retirement Arrangements (IRAs), as well as the relatively high cost and limited investment options provided by these plans. Originally targeted for medium and low income families, these college funds rely on the active investment choices made by participants, many of whom lack financial sophistication. Yet, the advisor-directed plans are relatively more expensive and have a lower performance record.
References:
McCullers, Madeline, and Irina Stefanescu (2015). "Introducing Section 529 Plans into the U.S. Financial Accounts and Enhanced Financial Accounts", Finance and Economics Discussion Series Note, Washington: Board of Governors of the Federal Reserve System, 2014-12-18.
1. We thank Madeline McCullers for excellent research assistance. Return to text
2. CSPN is an affiliate of the National Association of State Treasurers (NAST), a professional organization for state treasurers and other officials with similar responsibilities. CSPN collects and selectively publishes plan-level data. The Federal Reserve Board's triennial Survey of Consumer Finances (SCF) captures information about ownership of 529 education savings directly from individual survey respondents. Morningstar is an independent investment research company that compiles 529 college savings plans information at the portfolio level. It provides current information on assets, providers, portfolio composition, and fees for each plan. Return to text
3. Otherwise, they are taxable and subject to a 10 percent penalty rate. Return to text
4. In order to maintain tax exemption status, the original and subsequent beneficiary should be members of the same family. The majority of states have a limit on the maximum account balance for the beneficiary. Currently, the limits vary between $235,000 and $452,210. Return to text
5. In addition to these state-sponsored plans, there is also a Private College 529 Plan, which provides the option to prepay tuition at more than 270 private colleges. Return to text
6. For more detailed information about the evolution of these plans by state, including closures and terminations (see McCullers and Stefanescu, 2015). Return to text
7. Usual income is designed to capture a version of family income with transitory fluctuations smoothed away in order to approximate the economic concept of "permanent" income. Usual income is measured in the SCF after actual income has been reported, when respondents were given the option to report their usual income if they believe they experienced a temporary deviation. Return to text
8. However, some of these declines are not statistically significant. Return to text
9. The data presented in this section were extracted at the end of August 2015. Return to text
10. The expense ratio is the percentage of fund assets used to pay for operating expenses and management fees, including 12b-1 fees, administrative fees, and all other asset based costs incurred by the fund, except brokerage costs. The distribution fee includes marketing and distribution costs. The front-load fee is the initial, or front-end, sales charge is a one-time deduction from an investment made into the fund. The management fee is the most recently reported actual percentage that was deducted from an investment's average net assets to pay the investment's management. Return to text
11. The Sharpe ratio is defined as the average return earned in excess of the risk-free rate divided by volatility or total risk. Return to text
12. Morningstar uses the following broad asset-class indexes as benchmarks in the computation of plan alphas: S&P500, MSCI EAFE, Morningstar Moderate Target Risk, ML USD Libor 3 Mon, BarCap U.S. Aggregate Bond, and BarCap Municipal. A positive alpha of 1 means that the fund (or portfolio) has outperformed the benchmark by 1 percent. Return to text
13. In the figure, the overall state alpha is calculated based on the previous three years monthly returns series. For state with multiple plans we present asset-weighted averages. Return to text
Please cite this note as:
Hannon, Simona M., Kevin B. Moore, Irina Stefanescu, and Max Schmeiser (2016). "Saving for College and Section 529 Plans," FEDS Notes. Washington: Board of Governors of the Federal Reserve System, February 3, http://dx.doi.org/10.17016/2380-7172.1684
Disclaimer: FEDS Notes are articles in which Board economists offer their own views and present analysis on a range of topics in economics and finance. These articles are shorter and less technically oriented than FEDS Working Papers.
