
FEDS Notes
 Print
PrintDecember 22, 2016
Where Should Online Peer-to-Peer Markets Thrive?
Jenny Schuetz 1
The rapid growth of firms such as Uber, Airbnb, and Task Rabbit has attracted considerable attention – and controversy – from the media, policymakers and researchers. These firms, which provide online platforms to link workers producing goods or services directly with consumers, are often referred to as "peer-to-peer markets", the "gig economy", or the "sharing economy". To date, relatively little empirical research has been published on the size, scope or impacts of online peer-to-peer (P2P) markets, most likely because of data constraints. For peer-to-peer markets to emerge and thrive, there need to be favorable conditions for both supply and demand: potential workers find the wages provided sufficiently attractive to offer their time or other resources, and consumers are willing to pay for the goods and services. Most of the existing academic research and policy debate centers around the labor market implications: whether alternative work arrangements, including online P2P markets, are more or less desirable for workers. Less attention has been paid to the consumer implications, namely, how the availability of goods and services through these markets affects the well-being of consumers.2
This note considers the potential for spatial variation in the size and composition of online P2P markets from both the labor market and consumer perspectives. Some P2P platforms create virtual markets that do not require spatial proximity between workers and consumers, while others require direct personal interactions. What local area characteristics might lead workers to offer their labor through online platforms, instead of or in addition to traditional work arrangements or offline intermediaries? How do local factors affect consumers' demand for goods and services delivered through decentralized markets, relative to bricks-and-mortar establishments? How do spatial patterns of P2P workers and consumers vary by the good or service offered? In this note, I review the existing academic literature, lay out several testable hypotheses, and present some descriptive analysis based on a new survey of workers who earn income through online P2P markets.
Definition and context of peer-to-peer markets
For the purposes of this paper, I borrow Katz and Krueger's (2016) definition of online P2P markets: online platforms that serve as intermediaries for individuals selling goods or services directly to consumers (p. 15). This segment represents a small share of the broader range of activities designated as "alternative work arrangements", which includes independent contractors, temporary help agency workers, contract workers and on-call workers, although estimates of how large this market share is vary considerably across the few previous surveys (Bracha and Burke 2015, Katz and Krueger 2016).
To illustrate what firms and activities are designated as P2P markets, Table 1 shows a list of firm names, which I have categorized by good or service provided. This is by no means a comprehensive list, but gives some indication of the product categories in which online P2P markets operate.3 Potential spatial patterns in these markets may vary by differential importance of proximity between producers and consumers. For food, transportation and most personal care services, both the worker and the consumer must be located in the same geographic area. For temporary accommodation, consumers choose products or providers in a particular location, but the consumers themselves may be drawn from almost anywhere. For many professional services, finance, media, and general marketplaces, in-person interactions between sellers and consumers are not necessary, so spatial proximity is less relevant.
| Product category | Firm name | Headquarters location | Year founded |
|---|---|---|---|
| Accommodation | |||
| Airbnb | San Francisco CA | 2008 | |
| Homeaway | Austin TX | 2005 | |
| VRBO | (acquired by Homeaway) | 1996-2006 | |
| Finance | |||
| Lending Club | San Francisco CA | 2006 | |
| Prosper | San Francisco CA | 2006 | |
| Food | |||
| Caviar | San Francisco CA | 2012 | |
| Feastly | San Francisco CA | 2012 | |
| GrubHub | Chicago IL | 2004 | |
| Instacart | San Francisco CA | 2012 | |
| UberEats | San Francisco CA | 2014 | |
| Marketplace | |||
| craigslist | San Francisco CA | 1995 | |
| eBay | San Jose CA | 1995 | |
| Etsy | Brooklyn NY | 2005 | |
| Media | |||
| Pond5 | New York NY | 2006 | |
| Shutterstock | New York NY | 2003 | |
| YouTube | San Bruno CA | 2005 | |
| Personal services | |||
| Amazon Services | Seattle WA | 2015 | |
| Care.com | Waltham MA | 2007 | |
| FancyHands | New York NY | 2010 | |
| Handy | New York NY | 2012 | |
| HomeJoy | San Francisco CA | 2010 | |
| Postmates | San Francisco CA | 2011 | |
| Sittercity | Chicago IL | 2001 | |
| Task Rabbit | San Francisco CA | 2008 | |
| Professional services | |||
| Fiverr | Tel Aviv, Israel | 2010 | |
| HourlyNerd | Boston MA | 2013 | |
| Mechanical Turk | Seattle WA | 2005 | |
| Upwork | Mountain View CA | 2015 | |
| Transportation | |||
| Getaround | San Francisco CA | 2009 | |
| Lyft | San Francisco CA | 2012 | |
| RelayRides | San Francisco CA | 2009 | |
| Sidecar | San Francisco CA | 2011-2015 | |
| Uber | San Francisco CA | 2009 | |
Notes: Headquarter locations and founding dates assembled from company websites. Categories assigned by the author. Feastly was founded in Washington DC before moving its headquarters to San Francisco. RelayRides was originally founded in Boston.
Table 1 also illustrates the clustering of firm headquarters in a few large metropolitan areas: over half the firms are headquartered in the San Francisco Bay Area, with smaller concentrations in New York City, Chicago and the Boston metropolitan area. Many new firms offer their services in a few pilot locations before expanding to a broader market, so the location of headquarters is likely to influence spatial patterns for some product markets.
Existing literature on spatial distribution of P2P markets
To date there is little empirical work on most aspects of online P2P markets, including the spatial distribution. A few studies have attempted to estimate the impacts of individual P2P firms on traditional firms in the same product space, and include some descriptive information about spatial patterns. Two papers have examined the relationship between local area characteristics and the entry timing of Craiglist (one of the older P2P markets) across U.S. counties and metropolitan areas. Kroft and Pope (2014) find that Craigslist postings for employment and housing expand more rapidly in MSAs with larger and denser populations, as well as a higher college-educated share. Similarly, Seamans and Zhu (2013) find that Craigslist is more likely to enter populous counties with younger, more highly educated, more affluent residents. A contrasting result for growth of Airbnb is found by Zervas et al (2015); among Texas cities, the volume of Airbnb rentals is uncorrelated with population size, although the authors do not explicitly examine which city-level characteristics correlate with Airbnb presence. Similarly, Hall and Krueger (2015) document wide variation in the growth rates of Uber drivers across 20 large MSAs over time, but do not attempt to explain cross-MSA differences. Two papers map car-sharing locations and usage rates across neighborhoods in the San Francisco Bay area, illustrating that this service is not evenly distributed over space, but offer little analysis of the underlying reasons for spatial variation (Cervero et al 2007; Fraiberger and Sundararajan 2015).
How might local area characteristics correlate with labor supply and product demand?
Although prior research offers few insights into why some local areas may be more attractive for online P2P markets, it is possible to develop some hypotheses based on the predicted local labor supply and consumer demand. To do this, I draw on a slightly wider set of papers that examine (a) P2P worker motivations and observable characteristics; and (b) consumer motivations and observable characteristics for relevant product markets.
Labor supply
Unsurprisingly, the primary motivation for most workers who offer their services through P2P markets is to earn more income. Surveys of workers in online P2P firms including Uber, Airbnb, RelayRides and Mechanical Turk find that the need for additional income leads workers to join these platforms (Bracha and Burke 2013, Hall and Krueger 2015, Paolacci et al 2010, Robles and McGee 2016, Schor 2015). Several of the surveys note that P2P work is often undertaken as a second, part-time job to supplement other income sources; the relatively flexible schedule makes P2P work particularly attractive as secondary employment (Bracha and Burke 2013, Hall and Krueger 2015). In product markets that rely on renting out physical assets (such as Airbnb and car-sharing services), P2P markets enable owners to monetize underused assets (Horton and Zeckhauser 2016). A few surveys also find that workers in P2P markets derive non-monetary benefits, such as enjoyment of the work itself, social interaction with consumers, skill building and networking (Bracha and Burke 2013, Paolacci et al 2010, Schor 2015). While P2P work is not a full-time job for most participants, the earnings form a non-trivial share of total income for many workers (Bracha and Burke 2013, Hall and Krueger 2015).
Given the range of industries and occupations represented among P2P firms, it seems probable that workers will vary in their demographic and economic characteristics, although as yet only a few studies provide tangible evidence. Hall and Krueger (2015) find that Uber drivers are demographically more similar to the general population than to taxi drivers and chauffeurs. Notably, half of Uber drivers are under age 40 and three quarters have attended some college and/or earned a bachelor's degree. From a survey of Mechanical Turk workers, Paolacci et al (2010) find that two-thirds are female, that they are slightly younger than the U.S. population overall, and are more likely to have completed higher education. Fraiberger and Sundararajan (2015) find that providers of Getaround shared cars in San Francisco are more likely to be below median income.
Collectively, the existing research suggests several hypotheses for which geographic areas might have more favorable labor supply conditions for the growth of online P2P markets. First, areas with weak labor markets may lead more households into offering their services or assets on online platforms, either in lieu of or to supplement traditional jobs. Second, the flexibility offered by online platforms may enable relatively skilled workers to live in high amenity locations and provide their services remotely (similar to prior experience with independent contractors). This will apply mostly to platforms that do not require direct contact between workers and consumers (for instance, Upwork or Fiverr). Third, areas that have strong historic traditions of entrepreneurship may have higher participation in P2P firms. This could result from cultural norms around self-employment and risk-taking, or may result from tangible (but difficult to observe) support for independent workers, such as availability of shared freelancing work spaces, financing from local banks, or the availability of technical advice on starting a business. To the extent that education is correlated with technical ability or comfort using online platforms, regions with higher shares of college educated residents (and those with STEM backgrounds) may also have higher worker involvement in online P2P markets.
Consumer demand
Much less empirical research exists on the consumer side of P2P markets. Most firm-specific surveys firms have been conducted of workers, not consumers. An exception is Cervero et al's (2007) study of City CarShare users in San Francisco.4 They find that City CarShare is used mostly for shopping, leisure trips and personal business, rarely for commuting to work. In the absence of City CarShare, users predicted that many of the shopping trips would not have been made. City CarShare largely substituted for public transit for recreation and personal business trips. This implies that lower transaction costs (travel time) are the primary advantage of City CarShare. Horton and Zeckhauser (2016) conduct a Mechanical Turk survey to poll the predicted likelihood of ownership versus rental for a variety of goods (vacation homes, boats, specialized tools, etc.). The predicted frequency of usage and respondents' incomes are the most important in the hypothetical decisions whether to own these goods (active rental or "sharing" markets do not exist for many of the goods presented to survey respondents). A few studies have estimated demographic and economic profiles of P2P consumers, mostly focused on car sharing services. Fraiberger and Sundararajan (2015) find that users of shared cars through Getaround tended to be lower-income households. Cervero et al (2007) find that City CarShare users are demographically similar to the San Francisco population overall, but tended to be smaller households with fewer owned cars per household. In a survey of Zipcar users in Boston, Bardhi (2012) estimates that about half are full-time students, nearly half have incomes under $20,000, and 85 percent are under age 30.
One question about the consumer demand is whether online P2P platforms create markets for new goods and services not previously available, or whether they mostly reduce the costs or improve the quality of previously available goods and services. The "marketplace" platforms (Craigslist, eBay, Etsy) may well expand the set of physical goods that consumers can find, relative to availability in local bricks-and-mortar stores, particularly for highly specialized or rare items (limited vintages or productions). One of the innovations of the personal and professional service websites is the increased separability or divisibility of services being offered. That is, instead of hiring a full-time personal assistant, consumers can use platforms such as FancyHands to contract out a limited number of tasks or purchase a fixed quantity of an assistant's time. Many of the P2P platforms offer reduced search costs for consumers looking for particular goods and services, sometimes with the added insurance benefit that the platform has vetted providers' quality or safety (Einav et al 2015). Two of the product segments that have faced the greatest controversy, temporary accommodation (Airbnb) and transportation (Uber, Lyft), offer services that are widely available through traditional markets (hotels and taxis), but often at substantially reduced prices (Zervas et al 2015). There are several plausible reasons why those firms could offer lower prices: they may have lower overhead and fixed costs than traditional providers; the firms' profit margins may be smaller; the combined wage and benefit compensation to workers may be lower; because they are not subject to the same regulations as traditional providers, their operating costs may be lower.
Moving from individual motivations for using online P2P markets, several hypotheses are implied for which geographic areas should have strong aggregate demand. As with traditional retail, population density is important for all goods and services that are delivered directly to consumers (Schuetz et al 2012). This is particularly true for items with short shelf lives or delivery windows, such as restaurant meals and groceries. Any of the services whose primary contribution is reduced transaction costs will be particularly valuable to consumers with high incomes but little leisure time. Many of these services essentially outsource tasks traditionally undertaken by women in opposite-sex households, so may be more valued in locations with high female labor force participation rates. Demand for some goods and services may reflect idiosyncratic local characteristics. Temporary accommodation services will be more in demand in places with seasonal or temporary shocks to short-term visitors: host cities for political conventions, music festivals, sporting events or university graduations, for instance. Extrapolating from the individual consumer surveys, usage rates of car sharing or ride-sharing services should be more prevalent in cities with lower rates of car ownership or high costs of car ownership and driving (including parking, insurance and maintenance costs), or with limited or unreliable public transit networks. Finally, certain P2P markets may grow in response to local regulatory barriers imposed on traditional providers, or more generally in localities with high entry barriers for producers (Einav et al 2015, Horton & Zeckhauser 2016). This would include locations with high business taxes, cumbersome regulations for starting formal businesses, formal or de facto supply caps (i.e., limits on cab medallions or liquor licenses). Airbnb and ride-sharing services have been under particular scrutiny for avoiding local regulations on hotels and taxicabs (Benner 2016; Hardy 2016; Siddiqui 2016; Sullivan 2014). Apartment rental websites such as Craigslist may have higher consumer value in cities where real estate brokers charge rental fees or restrict access to multiple listing service postings.
Data and descriptive analysis
In Fall 2015, the Federal Reserve Board conducted a survey of Entrepreneurship and Informal Work Activities (EIWA) among a nationally representative sample of nearly 7000 adults.5 In the EIWA survey, all respondents were asked several "screener" questions to determine whether they earned money through a variety of activities that could be conducted either through an online intermediary or through offline contacts (i.e. selling goods at flea markets or providing child care services). Respondents who answered yes to at least one screener question were then asked follow-up questions about the type and frequency of those activities, including whether they had have received payment for a number of online activities, identified by firm/platform name. For purposes of this analysis, all respondents who reported having earned income through any alternative work arrangement (online or offline) are referred to as "alternative workers". The subset of alternative workers who reported some income from one of the designated online P2P platforms are referred to as "P2P workers". Some respondents indicated in the screener questions that they earned income from online activities, but did not select any of the P2P platforms; these respondents are classified as "Online other". This section presents descriptive results from the survey responses about participation in P2P work, demographic characteristics of P2P workers, and the intensity of P2P activities. No information is available about consumers of these goods and services. Unfortunately, the sample size constrains geographic analysis below the Census Division or any detailed analysis by firm or product type.
As shown in Table 2, of the entire sample, 33 percent had earned some money through alternative work arrangements. Nearly eleven percent of the total sample and 32 percent of the alternative workers earned some income through online P2P platforms.6 Among P2P workers, participation was highest in the marketplace segment (85.5 percent), followed distantly by professional services (13.2 percent), transportation (9.0 percent), personal services (6.7 percent), and temporary housing (4.0 percent).
| All respondents | Alternative workers | Metro | Non-metro | Diff. | significance indicator | |
|---|---|---|---|---|---|---|
| Alternative work | 0.330 | 1.000 | 0.333 | 0.317 | 0.016 | |
| Online P2P | 0.106 | 0.318 | 0.111 | 0.085 | 0.026 | *** |
| Online other | 0.083 | 0.252 | 0.083 | 0.083 | 0.000 | |
| Offline | 0.142 | 0.431 | 0.140 | 0.150 | -0.010 | |
| n = | 6,898 | 2,483 | 5354 | 1541 | ||
| Online P2P workers | ||||||
| Housing | 0.040 | 0.046 | 0.008 | 0.038 | *** | |
| Marketplace | 0.855 | 0.852 | 0.870 | -0.018 | ||
| Personal services | 0.067 | 0.058 | 0.111 | -0.053 | ||
| Professional services | 0.132 | 0.121 | 0.183 | -0.062 | ||
| Transportation | 0.090 | 0.090 | 0.091 | -0.001 | ||
| n = | 701 | 566 | 135 |
Notes: Author's calculations using the Federal Reserve Board's 2016 Entrepreneurship and Informal Work Activities (EIWA) Survey. Alternative workers are defined as those earned any income from non-traditional work arrangements. P2P workers are respondents who earned any income from specified online P2P platforms. The product categories correspond to firms shown in Table 1. Online other respondents indicated earning income from online activities, but not specifically through P2P platforms. Metro indicates respondents live in a metropolitan statistical area (micropolitan areas are counted as non-metro). *, ** and *** indicate statistical significance at the 0.10, 0.05 and 0.01 levels.
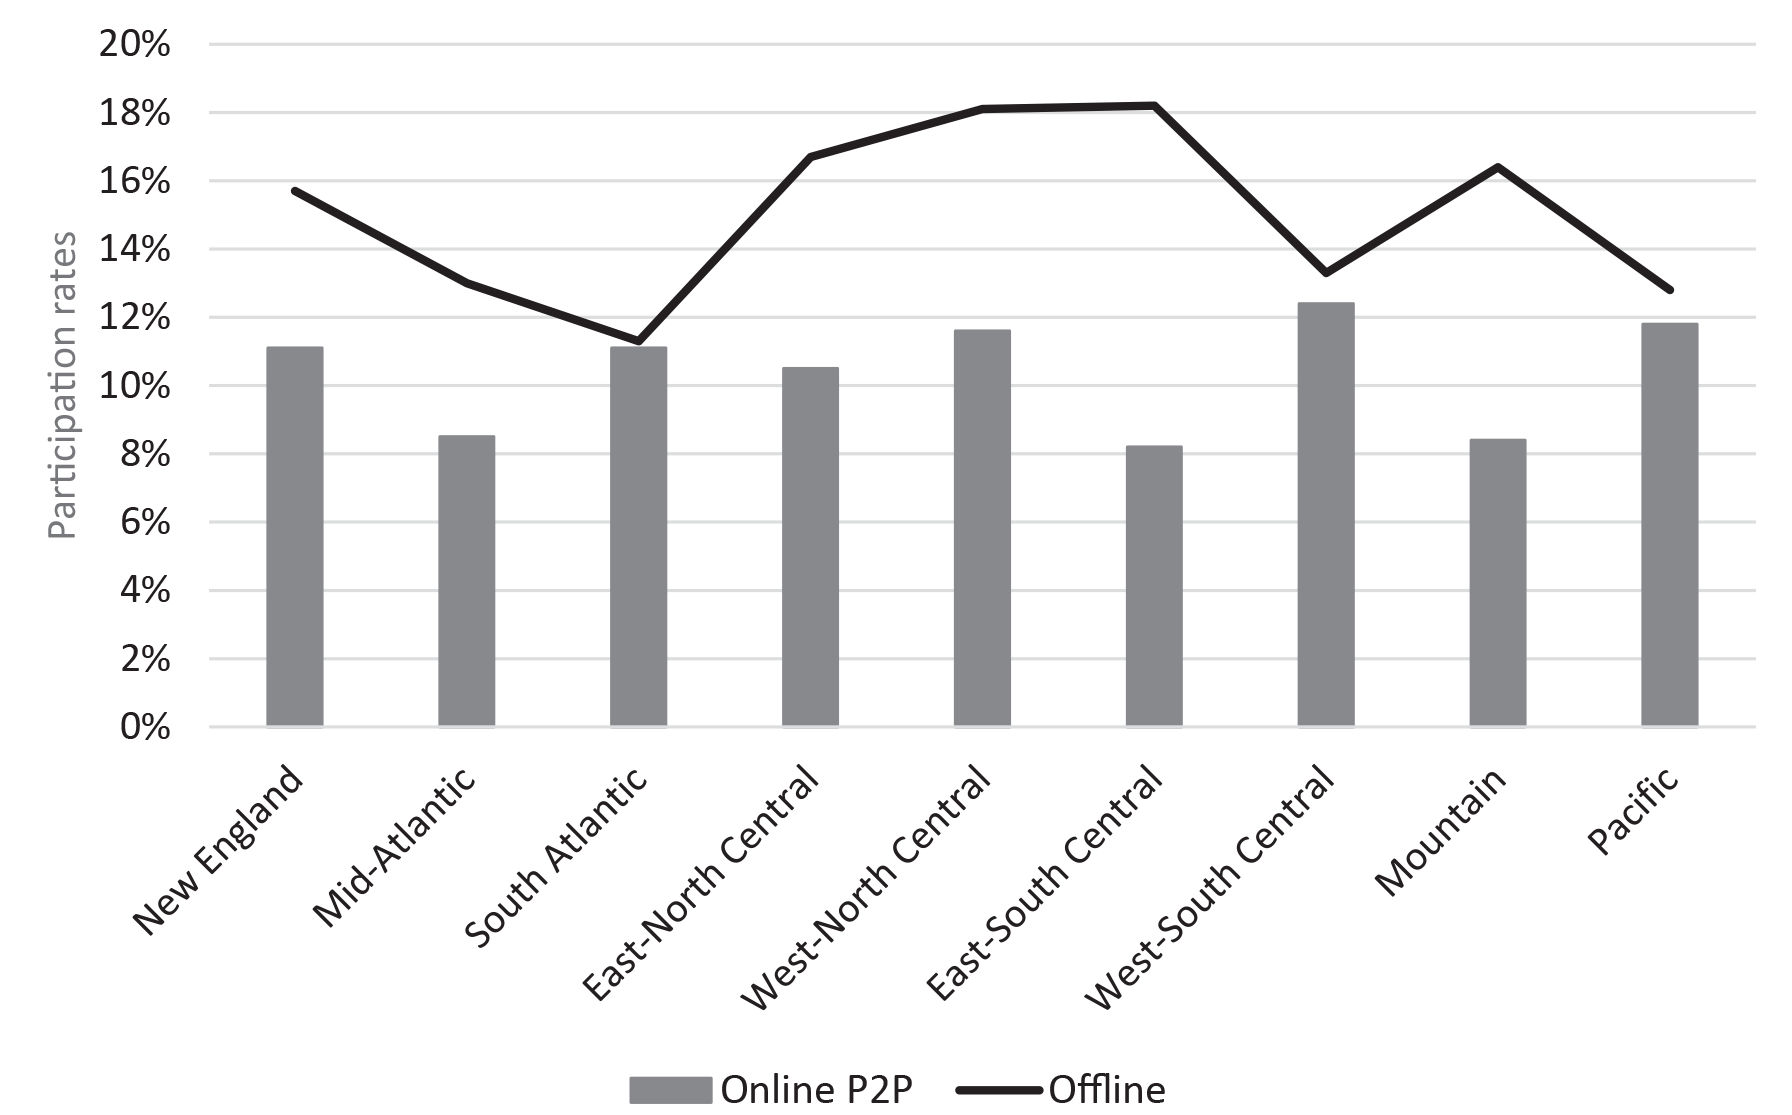
Participation in online P2P markets was somewhat higher in metropolitan areas than outside MSAs, while participation in offline alternative work was slightly (but not statistically) lower in metro areas. The only product segment in which the difference between metro and non-metro respondents is statistically significant is the Housing segment, a gap of nearly four percentage points. The incidence of P2P and offline alternative work varies somewhat across Census Divisions (Figure 1). The share of P2P workers ranges from about 8 percent in the East-South Central and Mountain regions to about 12 percent in the West-South Central and Pacific regions. Offline alternative work is highest in the East-North Central and West-North Central regions (18%) and lowest in the South Atlantic region (11%). Participation in online P2P and offline alternative work at the Census Division level are negatively correlated (correlation coefficient of -0.3).
Significant demographic and economic differences exist between online P2P workers, offline alternative workers, and traditional workers.7 Online P2P workers are less likely than alternative or traditional workers to be black, and more likely than offline and traditional workers to be other race/ethnicity (mostly Asian). While just under half of online P2P workers and traditional workers are women, nearly two-thirds of offline alternative workers are female. Both P2P and offline alternative workers skew younger than traditional workers: two-thirds of P2P workers are under age 45, as are 51 percent of alternative workers, compared to about 40 percent of traditional workers. P2P workers are significantly more likely to have completed college (37%) than either offline alternative (23%) or traditional workers (30%). P2P workers are less likely to than traditional workers to have annual incomes below $40,000 and more likely to have incomes over $100,000.
| P2P | Offline | Traditional | P2P - Offline | P2P - Offline significance indicator | P2P - Traditional | P2P - Traditional significance indicator | Offline - Traditional | Offline - Traditional significance indicator | |
|---|---|---|---|---|---|---|---|---|---|
| White | 0.66 | 0.64 | 0.67 | 0.019 | -0.007 | -0.026 | * | ||
| Black | 0.08 | 0.14 | 0.12 | -0.051 | *** | -0.033 | ** | 0.018 | |
| Hispanic | 0.16 | 0.16 | 0.14 | -0.001 | 0.015 | 0.016 | |||
| Other | 0.10 | 0.07 | 0.07 | 0.033 | * | 0.025 | ** | -0.008 | |
| Female | 0.49 | 0.66 | 0.49 | -0.170 | *** | -0.004 | 0.166 | *** | |
| 18-29 yrs | 0.33 | 0.27 | 0.17 | 0.058 | *** | 0.159 | *** | 0.101 | *** |
| 30-44 yrs | 0.35 | 0.22 | 0.23 | 0.129 | *** | 0.120 | *** | -0.010 | |
| 45-59 yrs | 0.21 | 0.26 | 0.28 | -0.055 | -0.075 | ** | -0.020 | ||
| 60+ yrs | 0.11 | 0.24 | 0.31 | -0.132 | *** | -0.204 | *** | -0.071 | *** |
| Less than HS | 0.11 | 0.16 | 0.11 | -0.051 | *** | 0.003 | 0.054 | *** | |
| High school | 0.21 | 0.29 | 0.31 | -0.086 | *** | -0.109 | *** | -0.023 | * |
| Some college | 0.31 | 0.31 | 0.27 | -0.005 | 0.035 | *** | 0.039 | ** | |
| College/graduate | 0.37 | 0.23 | 0.30 | 0.141 | *** | 0.071 | *** | -0.070 | *** |
| < $25,000 | 0.13 | 0.22 | 0.17 | -0.097 | *** | -0.047 | 0.050 | *** | |
| $25,000-39,999 | 0.11 | 0.14 | 0.13 | -0.030 | * | -0.020 | 0.010 | ||
| $40,000-74,999 | 0.25 | 0.26 | 0.26 | -0.012 | -0.017 | -0.005 | |||
| $75,000-99,999 | 0.17 | 0.13 | 0.16 | 0.037 | * | 0.006 | -0.031 | ** | |
| $100,000+ | 0.34 | 0.24 | 0.27 | 0.103 | *** | 0.079 | ** | -0.024 | *** |
| n = | 701 | 1002 | 4647 | ||||||
Note: Author's calculations using the Federal Reserve Board’s 2016 Entrepreneurship and Informal Work Activities (EIWA) Survey. *, ** and *** indicate statistical significance at the 0.10, 0.05 and 0.01 levels.
Online P2P workers were asked how much time they spent on these various income-generating activities, and what share of their monthly income derived from the activities. Table 4 shows the summary statistics for P2P workers, by metro area status and product segment. On average, participants spent about 17 hours per month and earned around 12.5 percent of monthly income.8 Hours worked were slightly higher for P2P workers in metropolitan areas than outside MSAs, with no geographic difference in share of monthly income. Broken out by product segment, P2P transportation workers spent the most time (30.6 hours per month) and relied on it for the largest share of income (42.3 percent). P2P workers in the Marketplace, Personal Services and Housing categories spent around 17 hours per month, with Marketplace sellers deriving the smallest income shares (10.9 percent) and Housing providers the largest (31.6 percent). Sample sizes for product types other than the marketplace segment are very small, so these numbers should be interpreted cautiously.
| Hours/month | % monthly income | n = | |
|---|---|---|---|
| All P2P workers | 17.3 | 12.5 | 680 |
| Metro | 17.7 | 12.5 | 604 |
| Non-metro | 15.3 | 12.3 | 85 |
| Marketplace | 17.2 | 10.9 | 583 |
| Professional services | 20.4 | 23.7 | 76 |
| Transportation | 30.6 | 42.3 | 38 |
| Personal services | 17.2 | 28.2 | 34 |
| Housing | 17.3 | 31.6 | 20 |
Note: Author's calculations using the Federal Reserve Board's 2016 Entrepreneurship and Informal Work Activities (EIWA) Survey. Product categories assigned based on firm names from Table 1. N is the number of participants with non-missing values for "hours spent" and "income earned".
Hours spent and income earned also vary somewhat by participant age and education (Table 5). The incidence of offline alternative work and online P2P work are highest among respondents under age 45. For both age segments, online P2P work is slightly more frequent among college educated respondents. Among P2P workers, young non-college-educated respondents reported spending the most hours (22.5 per month) and receiving the highest share of monthly income (13.6) from alternative activities. Young college educated workers spent on average seven fewer hours but earned nearly the same income share as non-college educated. This likely reflects differences in the type of work undertaken online by those with and without college degrees; unfortunately the sample size is too small to estimate cross-tabs by age, education and product segment. Older college educated workers reported the smallest income share earned from online P2P work, despite working similar hours; it is possible that some of these respondents are retired and derive income from pensions or other assets, in additional to online P2P work. Exploring the relative composition of the labor force by product segment is an interesting area for future research.
| Offline | Online P2P | ||||
|---|---|---|---|---|---|
| Participation | Participation | Hours/month | % income | n | |
| < 45 yrs, no college | 0.42 | 0.14 | 22.5 | 13.6 | 105 |
| < 45 yrs, college | 0.41 | 0.17 | 15.7 | 13.3 | 289 |
| 45+ yrs, no college | 0.24 | 0.05 | 15.8 | 12.7 | 96 |
| 45+ yrs, college | 0.27 | 0.08 | 16.1 | 9.5 | 190 |
Note: Author's calculations using the Federal Reserve Board’s 2016 Entrepreneurship and Informal Work Activities (EIWA) Survey. No college category includes those with less than high school degree and high school graduates who have not attended college. College includes those who attend some college but did not graduate, and respondents who earned a bachelors, graduate or professional degree. N is the number of online P2P workers with non-missing values for "hours spent" and "income earned".
Discussion
This note adds to the small but growing literature on online P2P markets, considering the potential for participation among both workers and consumers. Although P2P markets use online platforms, many of the goods and services offered through these platforms require direct engagement between workers and consumers, suggested that different spatial patterns in these markets may emerge. Analysis of data from a new household survey confirms several findings from prior research: a non-trivial share of U.S. households are contributing labor to P2P markets, and for many participants, this activity constitutes a substantial portion of working hours and income. The lack of widely available data on P2P participation (and other alternative work) makes it difficult to estimate the scope of these markets, as well as possible impacts on workers and consumer well-being. Most existing research focuses on worker implications, although equally important questions are present on the consumer side. Services offered through online P2P platforms have the potential to increase quality of life by reducing transaction costs for many daily activities. This could be particularly valued by time-constrained households and women, who traditionally undertake many of these activities for their families. The emergence of some P2P services may reflect attempts to circumvent cumbersome local regulations of particular product markets. Local governments contemplating new regulations of online P2P firms should consider the potential impacts on both consumers and workers.
References
Bardhi, Fleura, and Giana M. Eckhardt. 2012. "Access-based Consumption: The Case of Car Sharing". Journal of Consumer Research 39(4): 881–98.
Benner, Katie. 2016. Airbnb Sues Over New Law Regulating New York Rentals. New York Times.
Bracha, Anat and Mary A. Burke. 2014. "Informal Work Activity in the United States: Evidence from Survey Responses." Federal Reserve Bank of Boston, Working Paper No 14-13.
Cervero, Robert, Aaron Golub and Brendan Nee. 2007. City CarShare: Longer-Term Travel Demand and Car Ownership Impacts. Transportation Research Record 1992(1): 70-80.
Edelman, Benjamin, Michael Luca and Dan Svirsky. 2016. Racial Discrimination in the Sharing Economy: Evidence from a Field Experiment. Forthcoming: American Economic Journal: Applied Economics.
Einav, Liran, Chiara Farronato, Jonathan Levin. 2015. "Peer-to-Peer Markets." NBER Working Paper No. 21496.
Fraiberger, Samuel P., and Arun Sundararajan. 2015. "Peer-to-Peer Rental Markets in the Sharing Economy." NYU Stern School of Business Research Paper.
Hall, Jonathan and Alan Krueger. 2015. An analysis of the labor market for Uber's driver-partners in the United States. Princeton University, Industrial Relations Section Working Paper #587.
Hardy, Quentin. 2016. Daily Report: Airbnb Faces a New York Shutdown. New York Times.
Horton, John J., and Richard J. Zeckhauser. 2016. "Owning, Using and Renting: Some Simple Economics of the "Sharing Economy" NBER Working Paper No. 22029
Katz, Larry and Alan Krueger. 2016. The Rise and Nature of Alternative Work Arrangements in the US, 1995-2015. NBER Working Paper.
Kroft, Kory and Devin Pope. 2014. Does Online Search Crowd Out Traditional Search and Improve Matching Efficiency? Evidence from Craigslist. Journal of Labor Economics 32(2): 259-303.
Paolacci, Gabriele and Chandler, Jesse and Ipeirotis, Panagiotis G. 2010. Running Experiments on Amazon Mechanical Turk. Judgment and Decision Making 5(5): 411-419.
Robles, Barbara and Marysol McGee. 2016. Exploring Online and Offline Informal Work: Findings from the Enterprising and Informal Work Activities (EIWA) Survey. Finance and Economics Discussion Series 2016-089. Washington DC: Board of Governors of the Federal Reserve System.
Schor, Juliet B. 2015. The Sharing Economy: Reports from Stage One. Boston College Working Paper.
Schuetz, Jenny, Jed Kolko and Rachel Meltzer. 2012. Are Poor Neighborhoods "Retail Deserts"? Regional Science and Urban Economics 42(1): 269-285.
Seamans, Robert and Feng Zhu. 2013. Responses to Entry in Multi-sided Markets: The impact of Craigslist on Local Newspapers. Management Science 60(2): 476-493
Siddiqui, Faiz. 2016. Maryland Public Service Commission Could Decide Future of Uber and Lyft in the State. Washington Post.
Sullivan, Gail. 2014. Wars on Private Taxis and Tesla Show Transportation Ripe for Disruption. Washington Post.
Todisco, Michael. 2015. Share and Share Alike? Considering Racial Discrimination in the Nascent Room-Sharing Economy. Stanford Law Review.
Zervas, Georgios, Davide Proserpio and John Byers. 2015. The Rise of the Sharing Economy: Estimating the impact of Airbnb on the hotel industry. Boston University working paper.
1. The analysis and conclusions set forth are solely the responsibility of the author, and do not indicate concurrence by the Board of Governors of the Federal Reserve System. Return to text
2. Some research investigates the potential for discrimination against consumers through online platforms, particularly with regard to Airbnb (Edelman et al 2016, Todisco 2015). There is also a fairly substantial theoretical literature on P2P activities that focuses on market design issues, such as quality signaling by producers, branding, and mechanisms for reducing search costs. Return to text
3. The product categories assigned here are by necessity somewhat broad and subjective. For instance, Craigslist includes postings for temporary accommodation as well as various personal services. The transportation companies listed in Table 1 exclude firms such as Car2Go and ZipCar, where the firm owns both the vehicles and the online platform, but includes Uber and Lyft, where the cars are owned by drivers. Return to text
4. City CarShare is operated by a non-profit organization and is distinct from Enterprise's CarShare program. Although City CarShare and Zipcar do not meet the definition of P2P platforms, because the assets are owned by a central entity rather than by individual owners, studies of these firms offer useful information on consumer demographics and motivations for equivalent P2P markets. Return to text
5. The survey included an oversample of households with incomes under $40,000. All results here are weighted based on income and demographics to be representative of the overall U.S. adult population, as well as to account for the oversample design. Robles and McGee (2016) provide additional analysis and details on the EIWA survey methodology. Return to text
6. Bracha and Burke (2015) find more than half of all informal workers are performing internet based tasks. Katz and Krueger (2016) find smaller incidence of both all informal and online, limiting their questions to three online platforms, but their survey asks about the primary source of income, while Robles and McGee (2016) find substantial evidence that alternative work supplements primary jobs among EIWA respondents. Return to text
7. The demographic comparisons exclude "Online other" respondents, because it is unclear whether they are participating in online P2P platforms that were not included in the survey, or performing online work that more closely approximates traditional jobs. Return to text
8. Bracha and Burke (2015) find that, on average, alternative workers with part-time jobs spend 15 hours per month on various side activities. Full-time workers spend 9 hours per month on alternative work arrangements. Return to text
Please cite as:
Schuetz, Jenny (2016). "Where Should Online Peer-to-Peer Markets Thrive?," FEDS Notes. Washington: Board of Governors of the Federal Reserve System, December 22, 2016, https://doi.org/10.17016/2380-7172.1894.
Disclaimer: FEDS Notes are articles in which Board economists offer their own views and present analysis on a range of topics in economics and finance. These articles are shorter and less technically oriented than FEDS Working Papers.
