
IFDP Notes
 Print
PrintSeptember 28, 2016
The Effects of Demographic Change on GDP Growth in OECD Economies
Jinill Kim 1
1. Overview
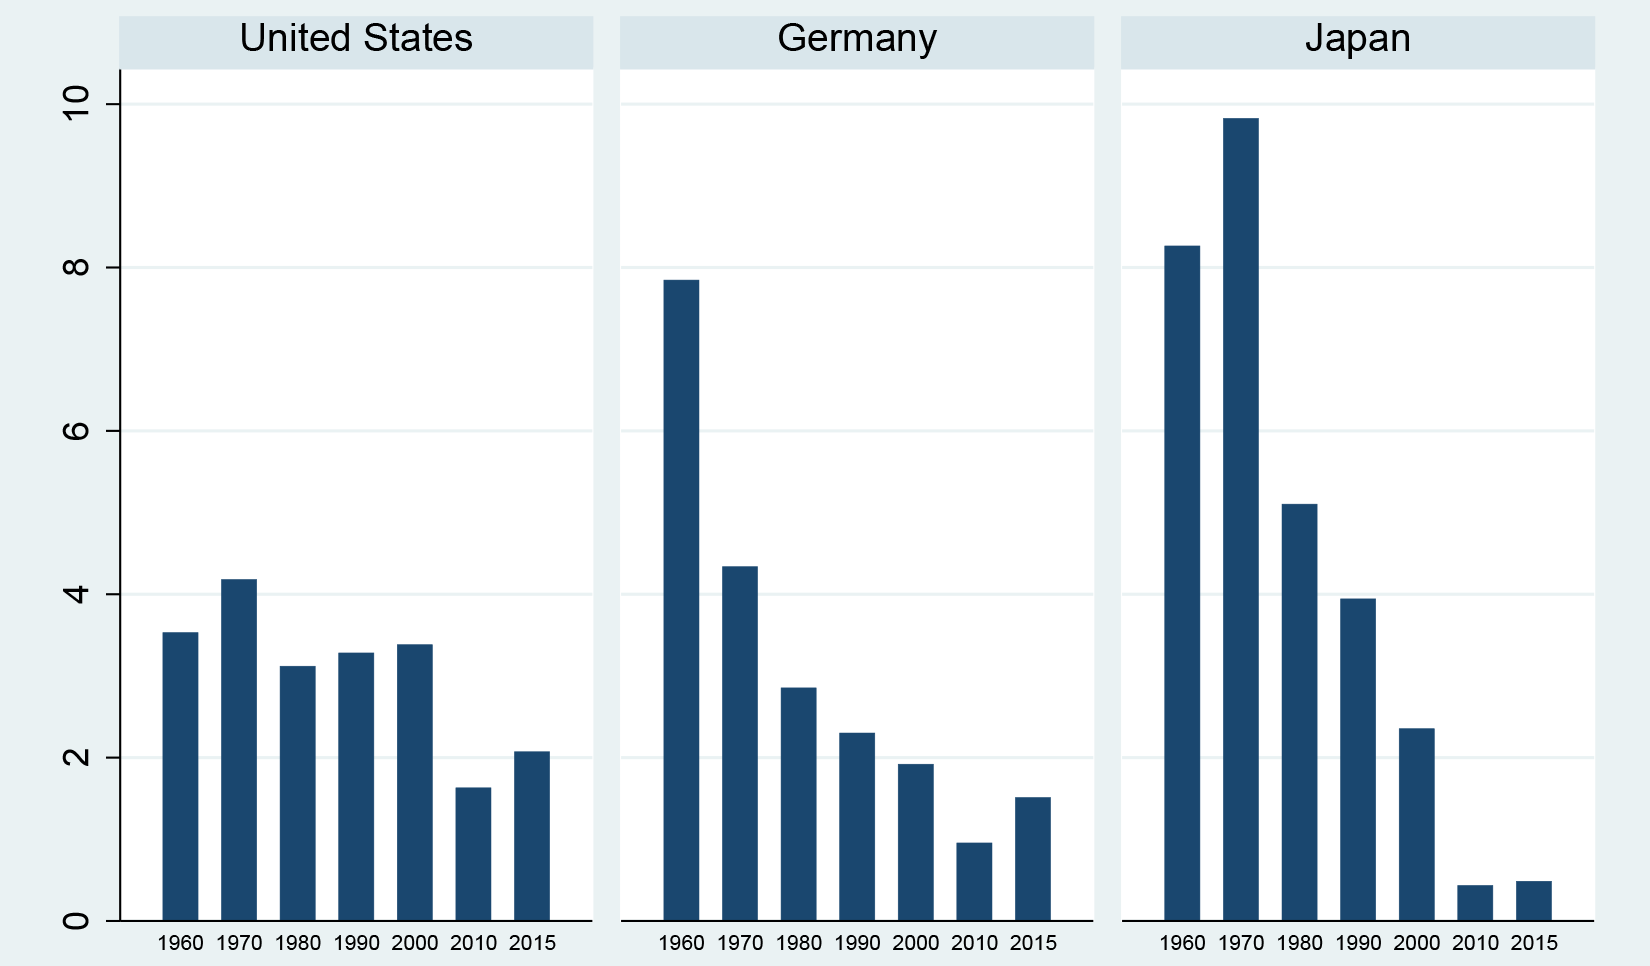
There has been a downward trend in economic growth in a number of advanced economies over the past few decades, with the slowdown particularly evident in the case of Japan. (Figure 1 shows GDP growth by decade in the United States, Germany, and Japan.) This note assesses how much of this growth slowdown can be accounted for by demographic changes. Specifically, we estimate how a changing age structure of the population (between four groups--ages 0-14, 15-39, 40-64, and 65+) has affected GDP growth using cross-country data for 18 advanced OECD countries. We then use United Nations (UN) population forecasts to project the consequences of a changing age structure for future GDP growth. We find that demographic changes account for a significant portion of the downward trend in economic growth of these countries during the past decade, including in Japan and the United States. Moreover, the continuation of the shift toward an older population is likely to be an important factor dampening GDP growth in OECD economies over the next couple of decades.2
 |
|
* Each bar represents average GDP growth rate in the decade ending in the year noted on the horizontal axis. The final bar represents the average GDP growth rate from 2011-2015. Return to figure.
2. Demographic Trends and Potential Implications for GDP Growth
Demographic factors have sometimes occupied center-stage in the discussion of the sources of economic growth. In the 18th century, Thomas Malthus made the pessimistic forecast that GDP growth per capita would fall due to a continued rapid increase in world population. However, fertility rates instead plunged beginning in the 1960s. The global fertility rate (defined as births per woman), which was between 5 and 6 before 1950, declined below 3 in 2000 and is projected to be only around 2 by 2050. Correspondingly, the growth rate of the total world population, about 1-3/4 percent in 1950, decreased to below 1-1/4 percent in 2000, and is projected to stay barely positive due to a longer life expectancy by 2050.3 The slowing population growth has been accompanied by a dramatic and ongoing rise in the proportion of the population aged 65 and over, a compositional shift that has important implications for economic growth and fiscal sustainability. The share of the world's total population over the age 65 rose from 5 percent in 1950 to above 8 percent in 2000, and is expected to nearly double to around 15 percent by 2050.
Demographic changes can affect GDP growth through several channels. First, lower growth in population directly implies reduced labor input. Second, lower population growth has an indirect potentially negative impact on individual labor supply insofar as it leads to higher tax rates which reduce the incentive to work. Third, under the life-cycle hypothesis, consumption smoothing through the lifetime would imply that people move from being net borrowers in their youth to being net savers in their working years and finally to dis-savers in their elderly years. Therefore, if the share of elderly in the population rises, aggregate savings would fall, leading to lower investment growth, and, in turn, lower GDP growth.
One study that analyzes the importance of demographic change for global economic growth was presented in the September 2004 issue of the World Economic Outlook by the International Monetary Fund, IMF (2004).4 Using a large multi-country panel regression framework relating economic growth to the age structure of the population, this study found that a 1 basis-point increase in the share of working-age (15 to 64) population would increase per capita real GDP growth (in PPP terms) by as much as 8 basis points.5 Conversely, a 1 basis-point increase in the share of elderly population (65 and up) would decrease economic growth by about 4 basis points.6 In contrast to the IMF study and others, this note has a narrower geographical coverage as it focuses only on advanced OECD economies but has more up-to-date coverage, with data going through 2010.7
3. Empirical Effects of Demographic Factors on Growth in OECD Countries
In this note, we assume that the level of real per-capita GDP depends on demographic variables as well as other variables according to the relation:
$$$$y{}_{it} = X{}_{it} \beta {}_{it} + \alpha{}_{1} p {}_{1it} + \alpha {}_{2}p {}_{2it} + ... + \alpha {}_{J}p {}_{Jit}$$$$,
where $$y{}_{it}$$ is the level of GDP of country i at time t, and $$X{}_{it}$$ captures relevant variables other than demographics. $$p{}_{jit}$$ is the fraction of the j-th age group in the total population (hence $$\Sigma {}_{j} p {}_{jit } = 1$$) and $$ \alpha {}_{j}$$ represents the influence of the j-th demographic group on the level of GDP. (Note that the above equation constrains the effect of changes in population composition to be equal across OECD economies).
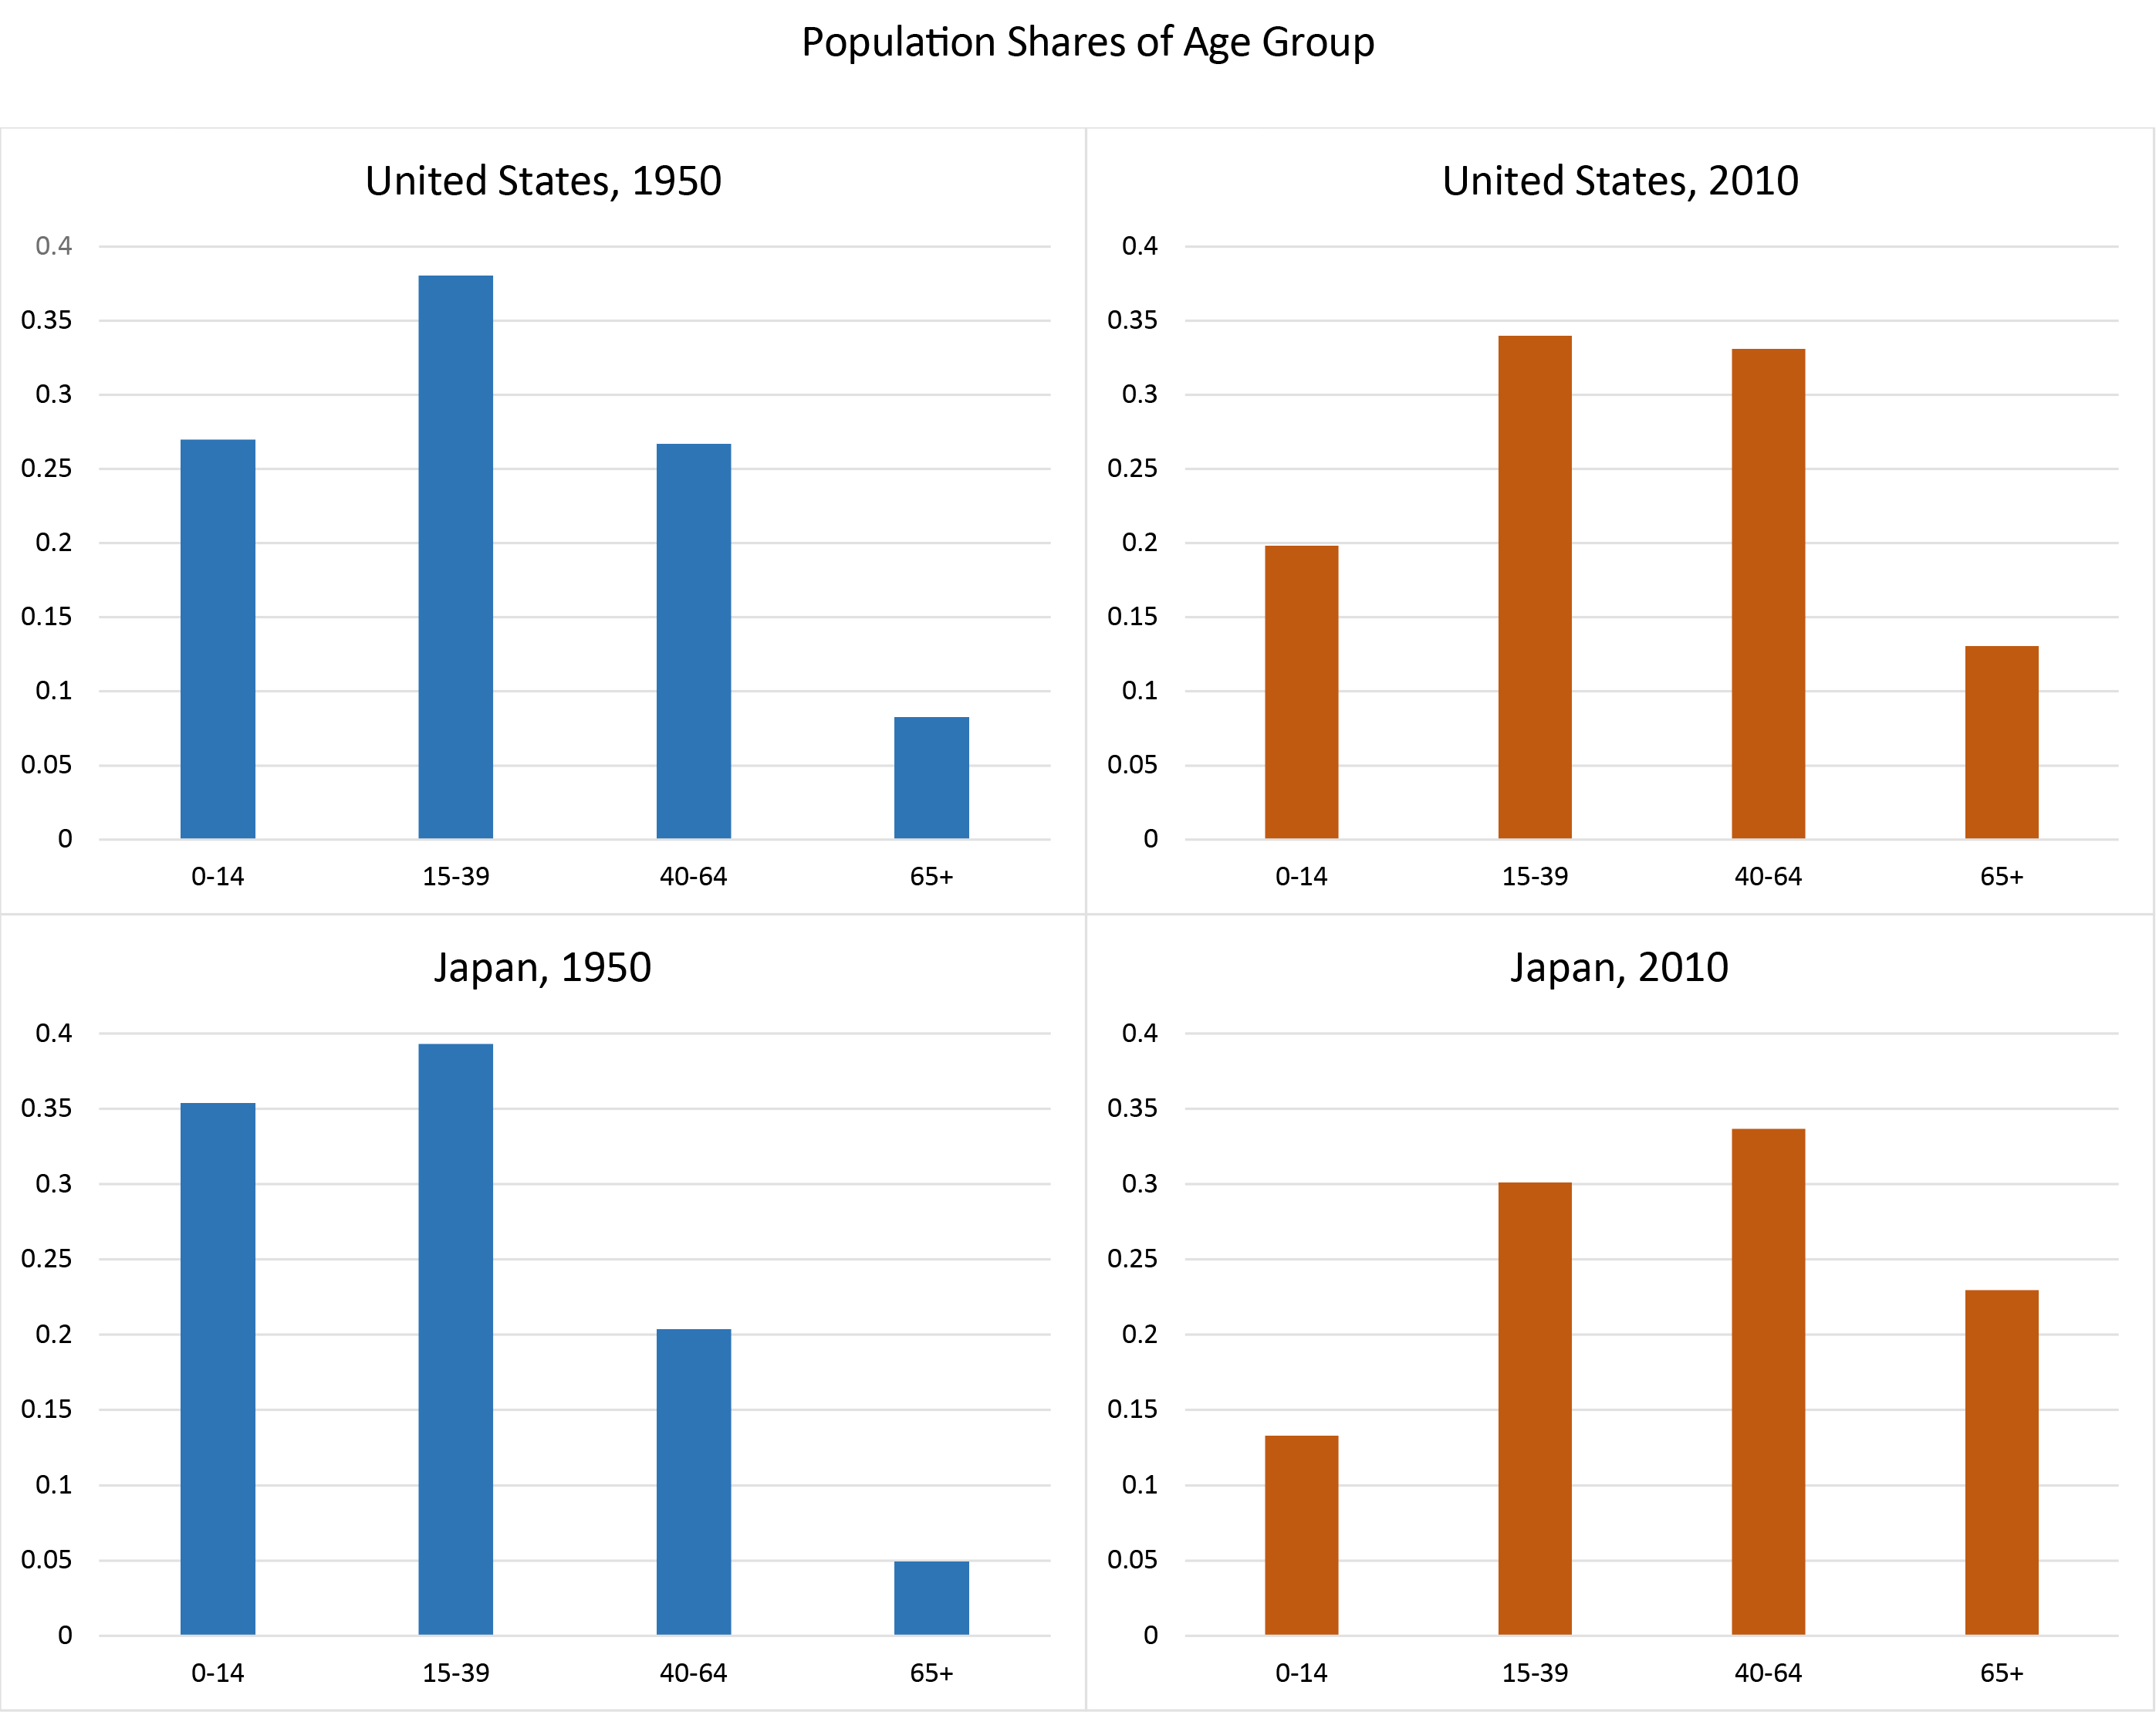
To illustrate demographic evolution in the post-war period, the upper panels of Figure 2 plot how the age structure of the population has changed in the United States between 1950 and 2010. As can be seen in the upper left panel, the shares of the U.S. population in age groups 0-14, 15-39, 40-64 and 65+ in 1950 were about 25 percent, 40 percent, 25 percent and 10 percent, respectively. The upper right panel shows the noticeable population ageing that has occurred in the United States during the last sixty years. By 2010, the youth (0-14) and young adult (15-39) population share had dropped by over 10 percentage points, while the elderly population share had risen by around 5 percentage points.
As is well known, Japan has gone through a much more dramatic ageing process. At the end of World War II, Japan was a very "young" country--with a much younger composition of population than the United States. As shown in the lower left panel of Figure 1, each of the 0-14 and 15-39 age groups accounted for more than 35 percent of the total population in 1950, while only one in four people was older than age 40. Sixty years later, less than half of the population was under 40 years old; about one in three people was between ages 40 and 64, and nearly one in four was older than 65. Many studies have documented that this rapid ageing in Japan has been an important factor accounting for the downward trend in Japanese GDP growth.
Turning to our statistical analysis, our baseline GDP regression is estimated in growth rates as a panel regression of 18 OECD countries over 5-year intervals, as follows:
$$$$g {}_{it} = c {}_{i} + b {}_{t} + \alpha {}_{1} \Delta p {}_{ } {}_{1it} + \alpha {}_{2} \Delta p {}_{2it} + ... + \alpha {}_{J} \Delta p {}_{Jit} {}_{ } + e {}_{it }$$$$
Note that $$g {}_{it}$$ is the annual average per-capita GDP growth rate of country i over a five-year span, $$t$$, (for example 0.03 for 3 percent annual growth rate between 2000 and 2005); $$c {}_{i}$$ is the country-specific constant term capturing the persistent cross-country differences in GDP growth; $$b {}_{t}$$ is a time dummy for each 5-year period that accounts for differences in growth across the 5-year periods that are common to all the OECD countries; and $$e {}_{it} {}_{ }$$ is a country-specific regression residual. The first 5-year interval used in the estimation runs from 1951-55, and the last interval runs from 2006-2010.8
| $$ \alpha {}_{2}$$ | $$ \alpha {}_{3}$$ | $$ \alpha {}_{4}$$ |
|---|---|---|
| 0.14 (0.076) | 0.28 (0.088) | -0.19 (0.14) |
* Standard errors in parentheses. Return to text.
To facilitate interpretation of the coefficients as the effects of a shift toward one population group from the others, the age sensitivity coefficients are normalized to sum to zero (i.e. $$ \Sigma {}_{j} \alpha {}_{j } = 0$$). With this constraint, the three coefficients for the 15-39, 40-64, and 65+ age groups are estimated to be 0.14, 0.28, and -0.19, respectively, as shown in Table 1. The coefficient on the 0-14 age group is obtained as -0.23, the negative of the sum of the other three coefficients due to the zero constraint mentioned above. As expected, an increase in the population share of the young and elderly population tends to lower the growth rate of GDP while an increase in the population in the two groups between 15 and 65 years old would tend to boost the GDP growth rate. These coefficients have the interpretation that, for example, other things being equal, a 1 percentage point shift in the share of population aged between 40 and 64 to the age group 65 and above would reduce GDP growth by 0.47 percentage point (i.e. -1*.28+1*-.19= -.47).9 Compared to the worldwide growth regression results found in the IMF (2004) study, our OECD regressions indicate that the elasticity of economic growth to demographic changes is an order of magnitude smaller.
We next use these coefficient estimates to help gauge how a changing age composition has affected GDP in the OECD economies, beginning with Japan. Japan underwent big swings in both demographics (discussed earlier and shown in more detail in the top panel of Figure 3) and economic growth: Japan's annual GDP growth rate exceeded 5 percent until early 1970s--averaging nearly 10 percent between 1965 and 1970--before moving down to a 2-5 percent range in the 1970s and the 1980s and then to barely positive growth starting in the 1990s.
The middle panel of Figure 3 plots the contribution of demography to Japanese growth; this contribution is broadly positive before 2000 but sharply negative since then--as might be expected given the rapid ageing of Japan's population. Note that the effects of demographics on Japanese GDP growth are most prominent in the current decade (middle panel of Figure 3), with the drag on GDP growth -2 percentage points over the 2011-2015 interval due to the rapid exit of the baby boom generation from the workforce (note the rising share of the elderly population in the topmost panel). Looking forward, the population age structure is not expected to change as much over the next 15 years, so the effects on GDP growth are smaller. However, the population share of the elderly is expected to show a renewed ascent in the 2030s (reflecting high birth rates around 1970) which accounts for the drop in the GDP growth projections around 2040.
The lower panel of Figure 3 presents implications of these results for the level of GDP, with the level of 2010 GDP normalized to 100. Japan's real GDP in the 1990s was higher than in 1950 by about one third due to demographic factors (rising from about 80 percent of 2010 GDP to about 110 percent of 2010 GDP). However, demographic changes also caused GDP to decrease by over 20 percent from its peak to 2015, and GDP is projected to fall significantly further through 2050.10
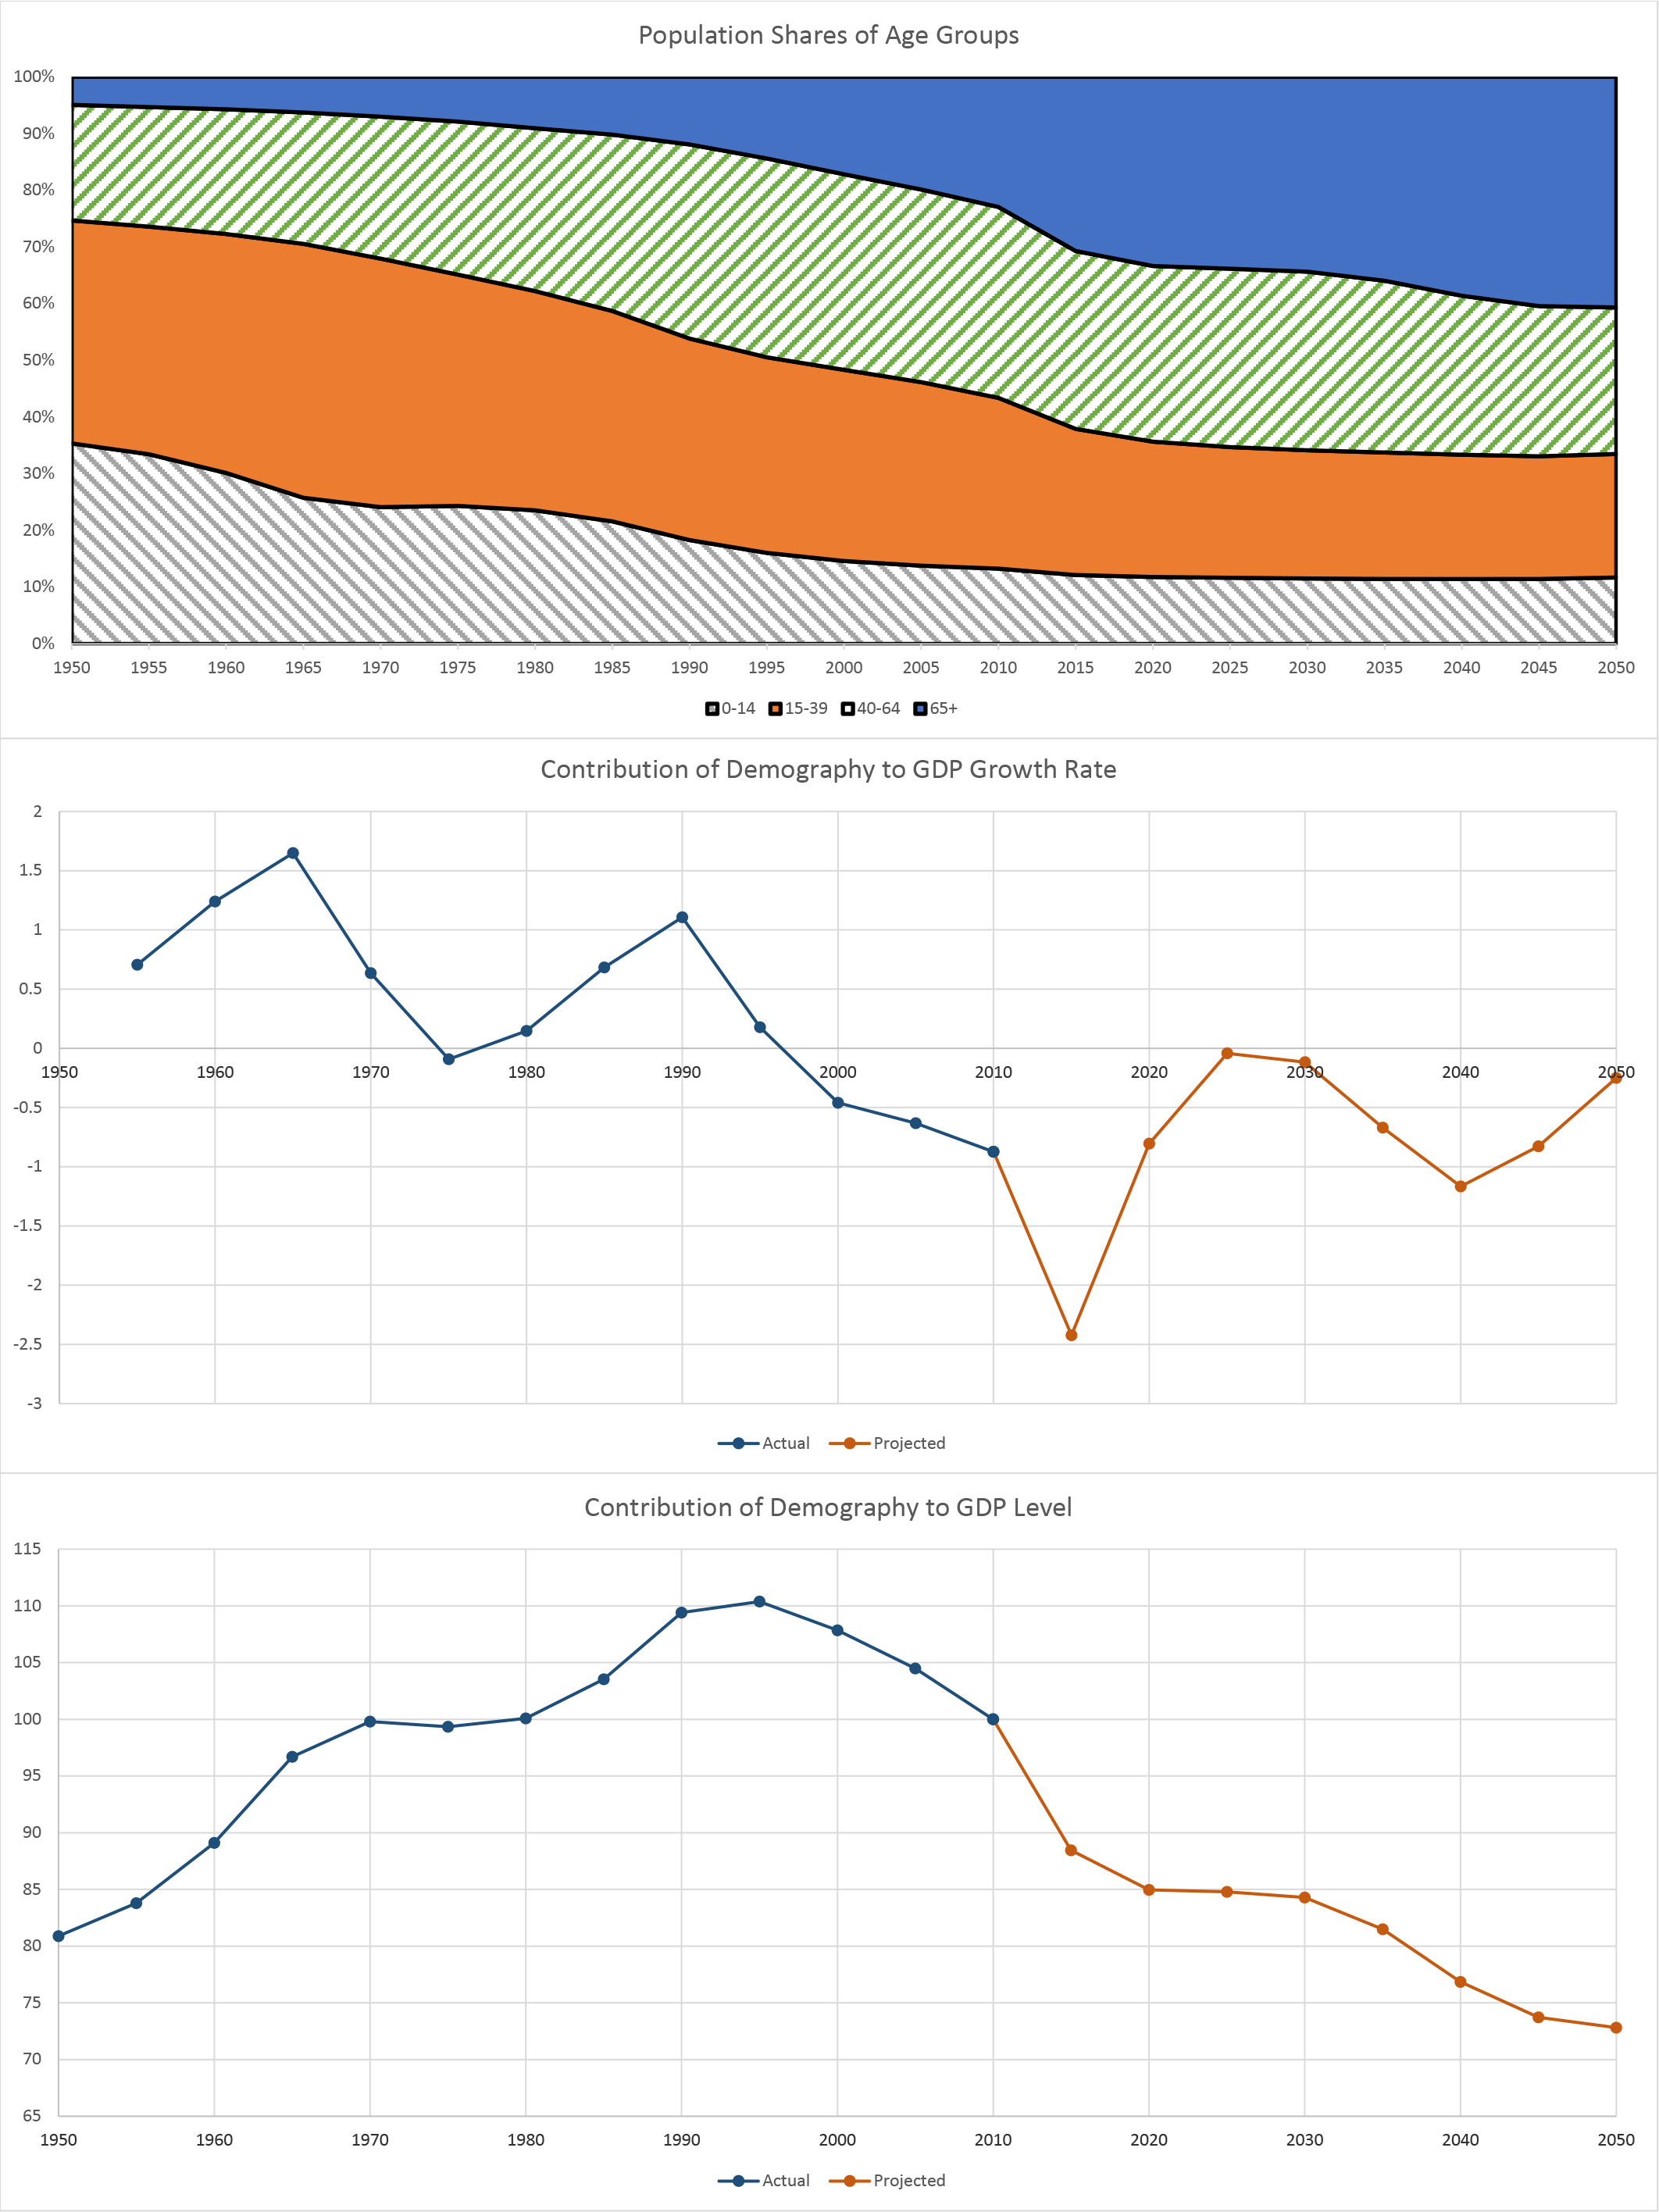
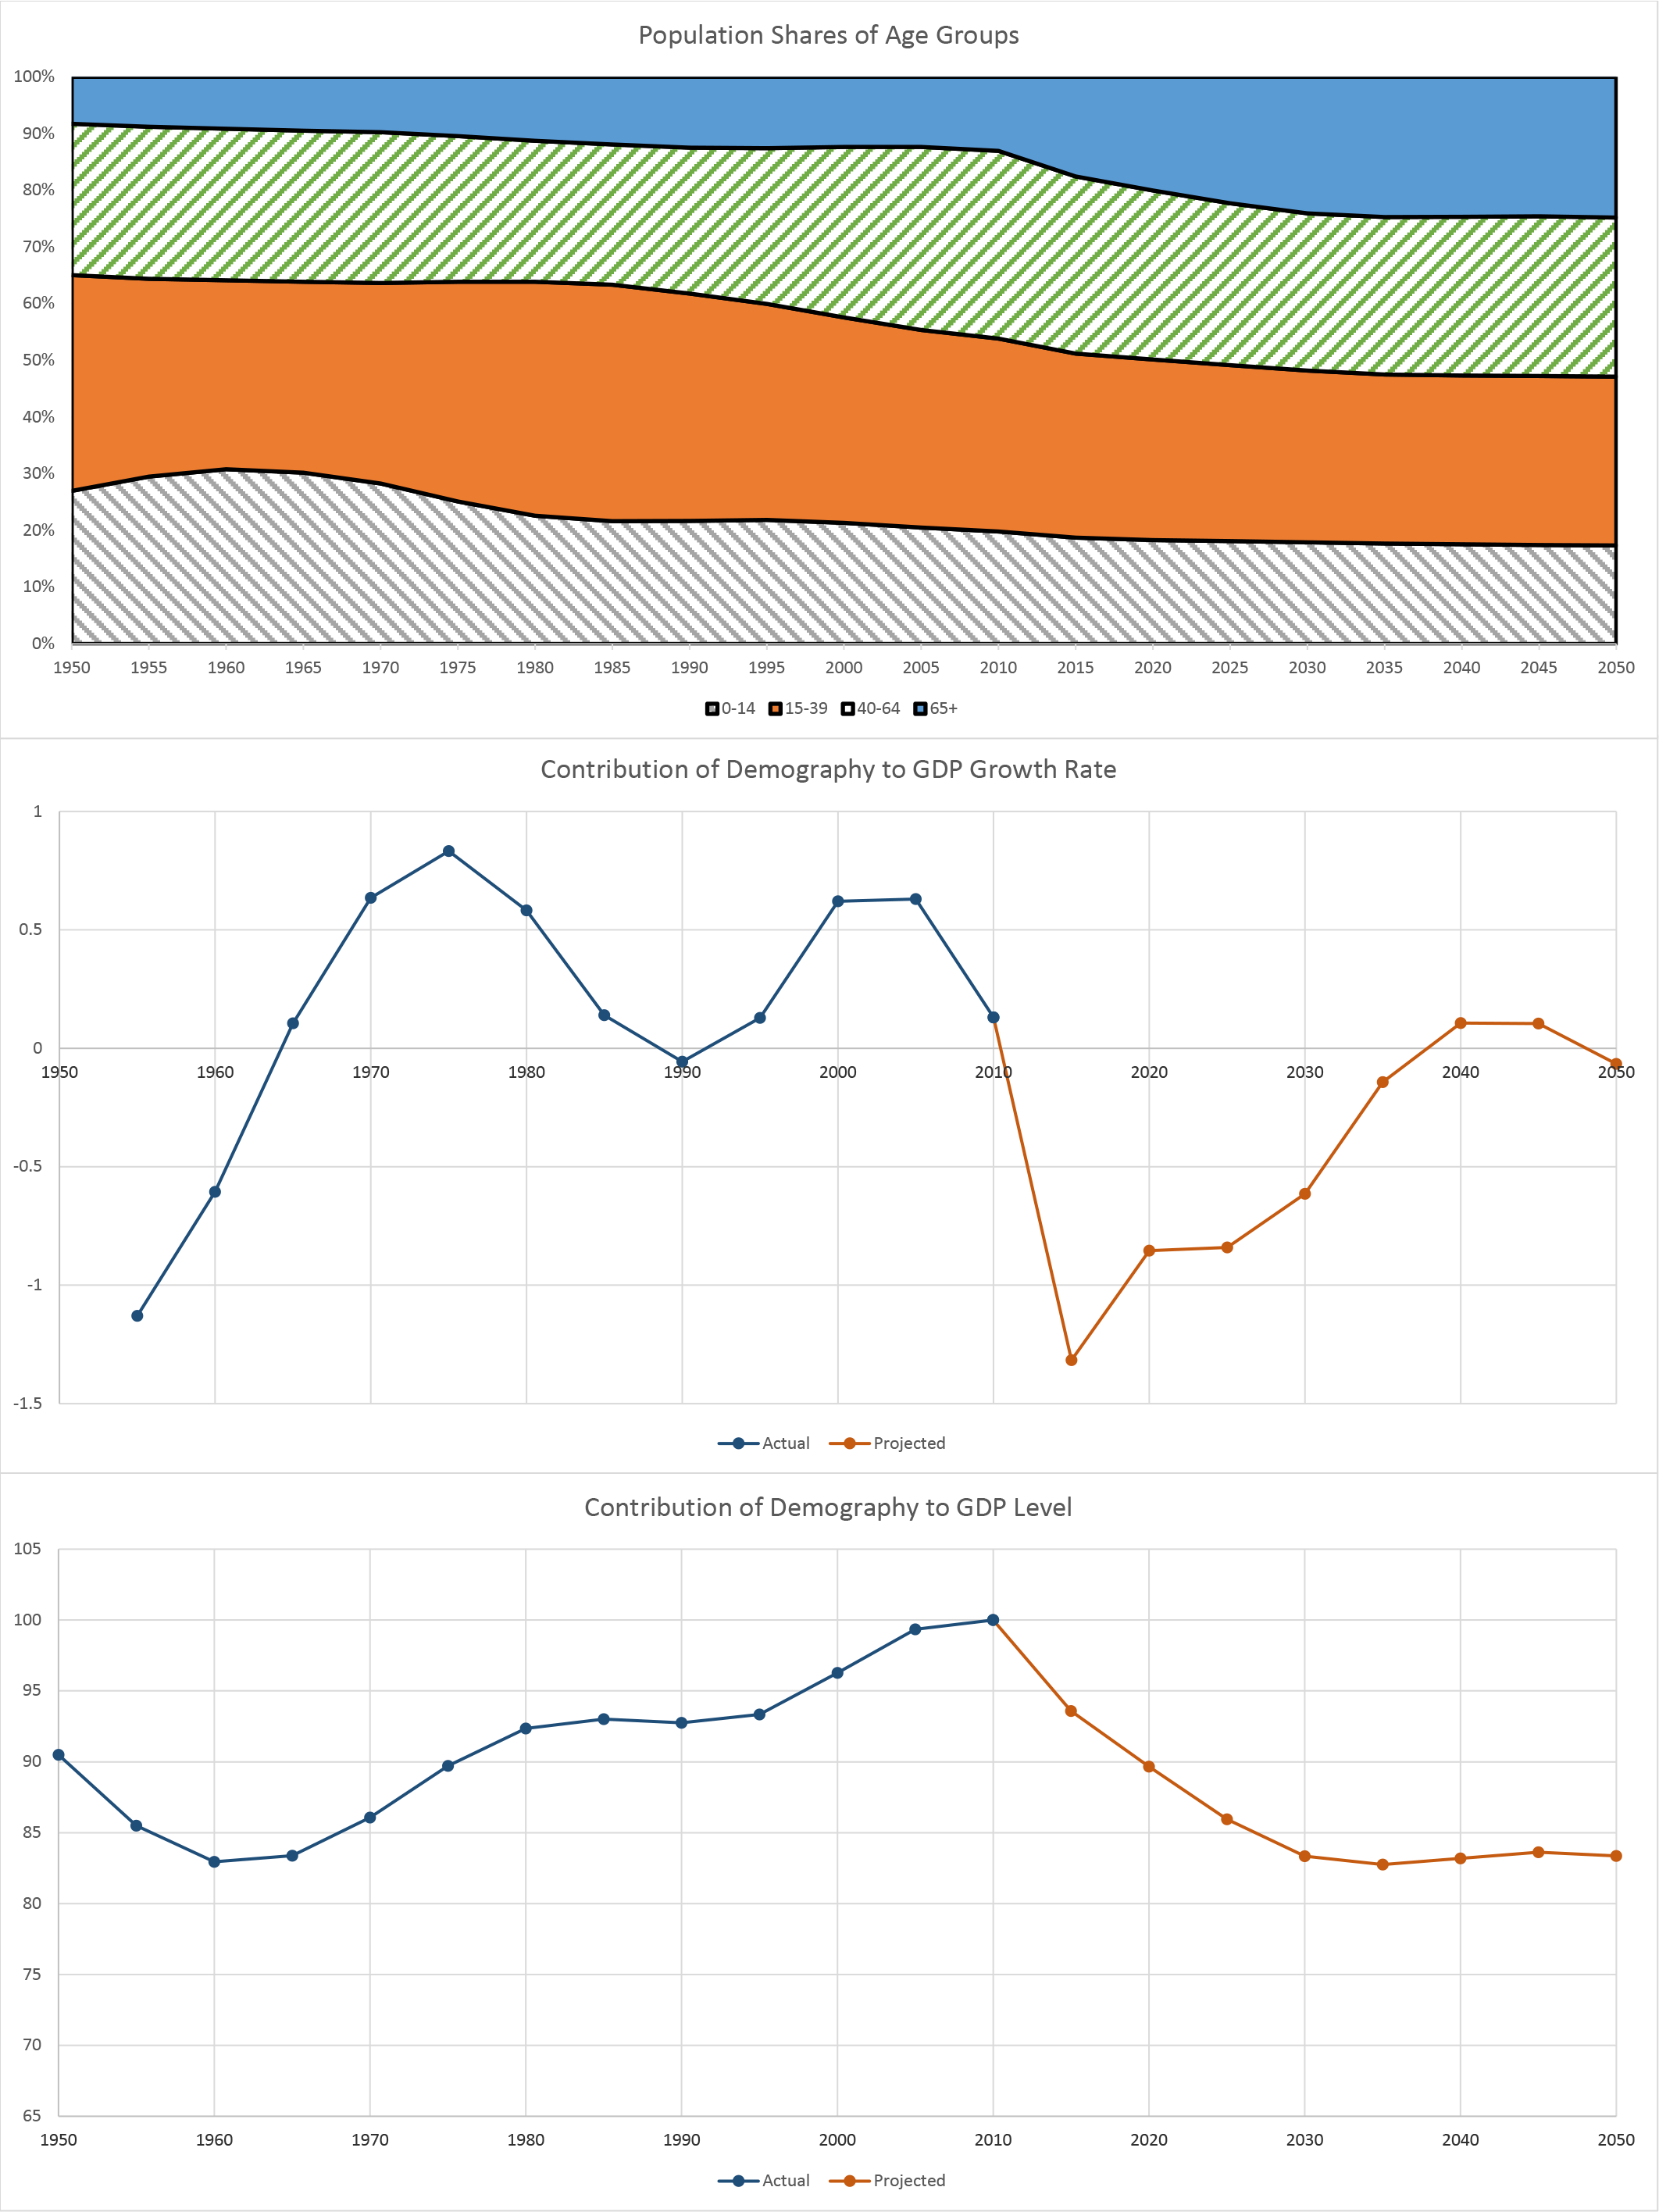
Figure 4 presents a parallel analysis for the United States, with the upper panel showing the evolution of the age structure of the population, and the lower panels showing the effects of demographic shifts on GDP growth (the middle panel) and the level of GDP (lower panel). As can be seen in the middle panel, age-related demographic change boosted U.S. growth between the 1960s and first decade of this century, albeit by less than 1 percentage point per year, on average (see middle panel). However, as in Japan, the share of the U.S. population older than 65 rose substantially between 2010 and 2015--accounting for an estimated drag on U.S. GDP growth of 1 percentage point based on our estimated regression coefficients. Because the ageing process in future years is not as dramatic as in the recent period, the effects on U.S. GDP growth dies out, oscillating around zero in the later part of the projection.
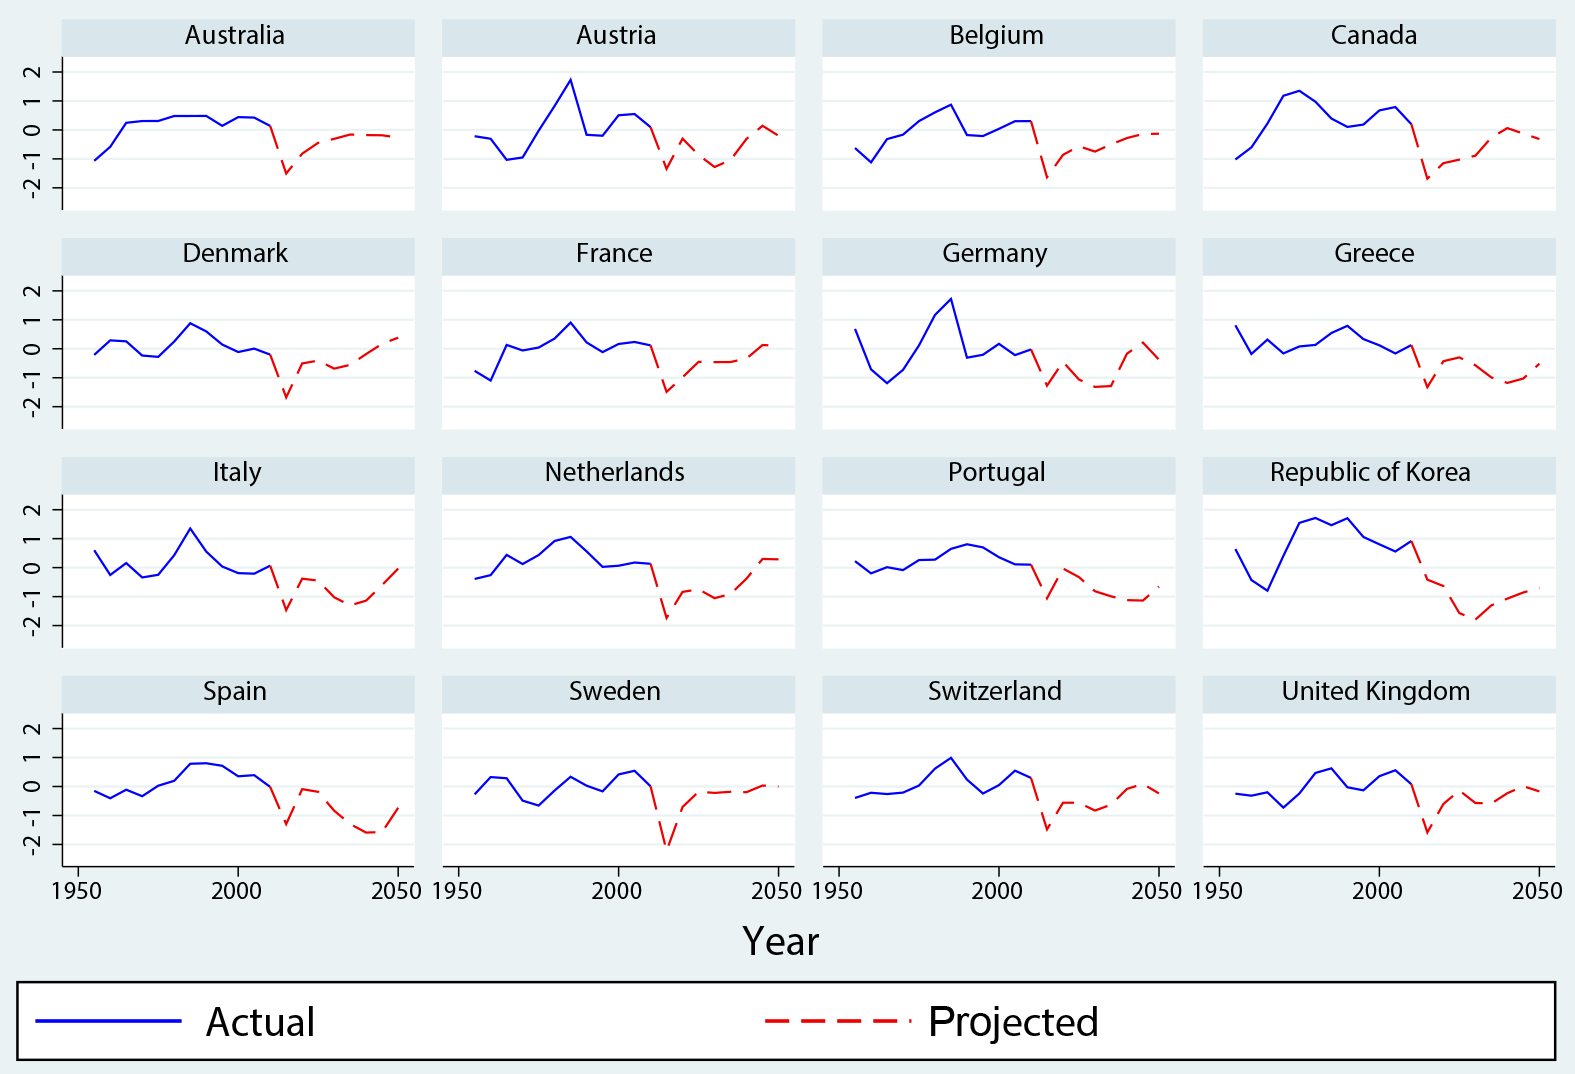
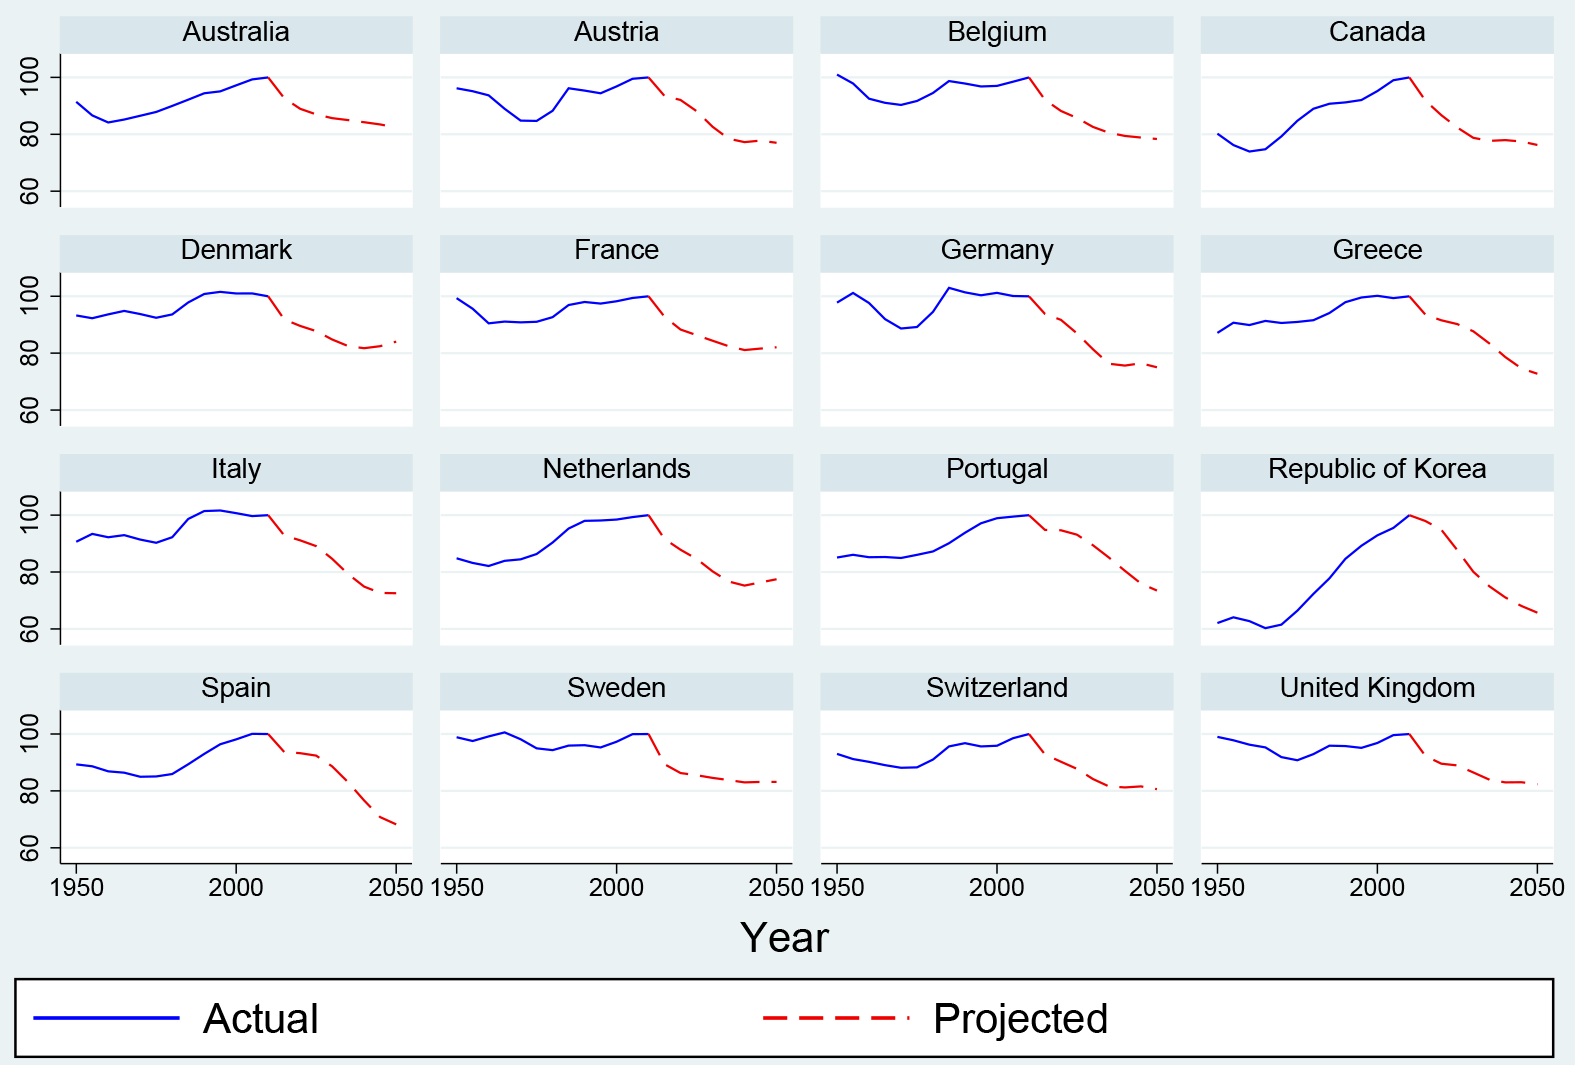
Turning to the effects of demographic changes in other OECD countries, Figure 5 depicts the contribution of demography to GDP growth (as in the middle panels of Figures 3 and 4) in the other 16 OECD countries in the sample. In most countries, the effects of demography on GDP growth rates are broadly negative in the projection period--as big as -2 percentage points in Canada during this decade and in Korea during the 2020s. Figure 6 illustrates the striking implications of this for the level of GDP. For most of the 16 OECD countries plotted, the effect of the demographic factors is to make GDP levels peak in 2010 and then turn much lower by 2050, the end of the projection period.11
We would urge some caution in interpreting these estimates because they do not capture all potentially important demographic influences. In particular, the panel estimation does not take into account cross-country differences in labor-force participation rates or movements over time of the participation rate within a country. Behavioral responses including greater female labor force participation and policy reforms, such as an increase in legal age of retirement, can mitigate the negative effects from ageing.
Moreover, although easier than forecasting economic variables, demographic projection has its own uncertainties built in.12 As is true with any projection, United Nations (2014) includes many different scenarios that depend on assumptions about fertility rates (high, low, constant) and life expectancy. The projected paths for the growth rate in Figures 3-6 are based on the median projection for demographic changes. When we use scenarios derived under alternative assumptions, the effects on GDP growth rates implied by our regressions can differ noticeably.
4. Conclusion
This note has evaluated the effects of demographic changes on economic growth performance of OECD countries and found that demographic changes account for a significant portion of growth slowdown in several of these economies in recent years. Predictions of the model using population projections by age group also suggest that demographics factors will continue to restrain GDP growth for a few years at least in most cases.
References
Carvalho, C., Ferrero, A., and Nechio, F. (2016), Demographics and Real Interest Rates: Inspecting the Mechanism, Federal Reserve Bank of San Francisco Working Paper, 2016-05.
Fair, R. and Dominguez, K. (1991), "Effects of the Changing U.S. Age Distribution on Macroeconomic Equations," American Economic Review, 81(5): 1276-1294.
International Monetary Fund (2014), World Economic Outlook: Recovery Strengthens, Remains Uneven, Washington, D.C.
International Monetary Fund (2004), World Economic Outlook: The Global Demographic Transition, Washington, D.C.
Rachel, L., and Smith, T. (2015), "Secular Drivers of the Global Real Interest Rate," Staff Working Paper, No. 571, Bank of England.
United Nations (2014), World Population Prospects: The 2012 Revision, Methodology of the United Nations Populations Estimates and Projections, Working Paper No. ESA/P/WP 235.
World Bank Group (2016), Global Monitoring Report 2015/2016: Development Goals in an Era of Demographic Change, Washington, DC: World Bank.
1. Professor, Korea University. This note was written while the author was visiting the International Finance Division of the Board of Governors of the Federal Reserve System. It has benefited from the helpful assistance of Alex Mechanick. Return to text
2. This note focuses on GDP growth performance. Related work has analyzed the influence of demographic factors on real interest rates, including studies by the IMF (2014), Rachel and Smith (2015), and Carvalho, Ferrero, and Nechio (2016). Return to text
3. Demographic analysis indicates that the fertility rate that would keep the population constant is about 2.1. All population projections in this note are from United Nations (2014). Return to text
4. Demographic issues were also the focus of the 2004 Jackson Hole symposium "Global Demographic Change: Economic Impacts and Policy Challenges." One of the papers--presented by Ralph Bryant, and entitled "Cross-Border Macroeconomic Implications of Demographic Change"--used a structural modeling approach to assess the effects of some of the demographic factors listed in the preceding paragraph. Return to text
5. The IMF study split the total population into three age groups. The three-group classification is consistent with the popular use of the youth dependency ratio (share of ages 0-14 in the total population) and the elderly dependency ratio (the share of ages 65+ in the total population), with the middle group sometimes called the share of the "working-age" population. In contrast, Fair and Dominguez (1991) classified the population into more than a dozen age categories, and estimated how changes in the age structure of the population affect aggregate consumption. Return to text
6. A World Bank study, World Bank Group (2016), examined the impact of demographic changes on achieving development goals. Return to text
7. The regressions in IMF (2004) included additional explanatory variables but excluded the time-fixed effects. Return to text
8. Both the data on GDP growth and population shares used in the regressions come from the United Nations (2014). Return to text
9. In general, the overall quantitative result would depend on how the other two shares are affected in this experiment. Return to text
10. Our projection relies on United Nations (2014) forecasts, which are based on their 2012 revision. Return to text
11. For Denmark, Germany, and Italy, the peak happens earlier, in the late 20th century. Return to text
12. Projections are also revised over time, and the revisions could influence the behavior of economic variables including fiscal variables and interest rates. Return to text
Please cite as:
Kim, Jinill (2016). "The Effects of Demographic Change on GDP Growth in OECD Economies," IFDP Notes. Washington: Board of Governors of the Federal Reserve System, September 28, 2016. https://doi.org/10.17016/2573-2129.22
Disclaimer: IFDP Notes are articles in which Board economists offer their own views and present analysis on a range of topics in economics and finance. These articles are shorter and less technically oriented than IFDP Working Papers.
