
IFDP Notes
 Print
PrintApril 6, 2016
The relationship between oil prices and inflation compensation
Alejandro Perez-Segura and Robert J Vigfusson 1
Between June 2014 and February 2016, oil prices declined from $115 per barrel to near $30 per barrel (the purple line in Figure 1). Over the same period, long-run inflation compensation, often used as a proxy for long-run inflation expectations, narrowed from 2.45 percent to 1.38 percent (the black line in Figure 1). Long-run inflation compensation is measured by the difference (or spread) between the yields for standard ten to five year-ahead Treasury bonds less the same spread between the yields on ten to five year Treasury inflation-protected securities (aka TIPS). (See Gürkaynak, Sack, and Wright, 2008 for details.) Long-run inflation compensation reflects not only market participants' expectations for future inflation, but also investors' risk aversion to losses resulting from inflation and also different market conditions for TIPS relative to that for nominal Treasuries.
| Figure 1: The Puzzling Common Decline in Inflation Compensation and Oil Prices |
|---|
 |
Note: Inflation compensation calculated using 10 year and 5 year nominal and inflation adjusted U.S. Treasury securities. Oil prices are measured using the front-month futures contract for Brent oil.
Noting the common decline in oil prices and long-run inflation compensation, many people have claimed that lower oil prices have contributed to the decline in inflation compensation. Although lower oil prices today should result in lower inflation over the next year, a current decline in oil prices should not reduce inflation five to ten years in the future.2 If inflation compensation is declining because of changes in inflation expectations, the claim that lower oil prices today reduce inflation compensation for a horizon of five to ten years ahead is puzzling. To resolve this puzzle, some have proposed that both oil prices and inflation compensation are responding to a common factor, such as a deterioration in the outlook for global economic activity.3
Although the theory that oil price movements and inflation compensation are both responding to a common factor is appealing, to-date analysts have provided very little empirical evidence about its plausibility. In this note, we provide new empirical evidence supporting this conjecture that changes in the outlook for global economic activity explain the co-movement between oil prices and inflation compensation. In particular, we present an empirical strategy to identify changes in oil prices that are a response to economic activity (demand-induced) and changes in oil prices that are responding to oil-specific developments (supply-induced). Our main finding is that demand-induced oil price declines can explain most of the move in inflation compensation. As a consequence, economists would do well to pay less attention to oil prices and more attention to macroeconomic factors in explaining the decline in inflation compensation.
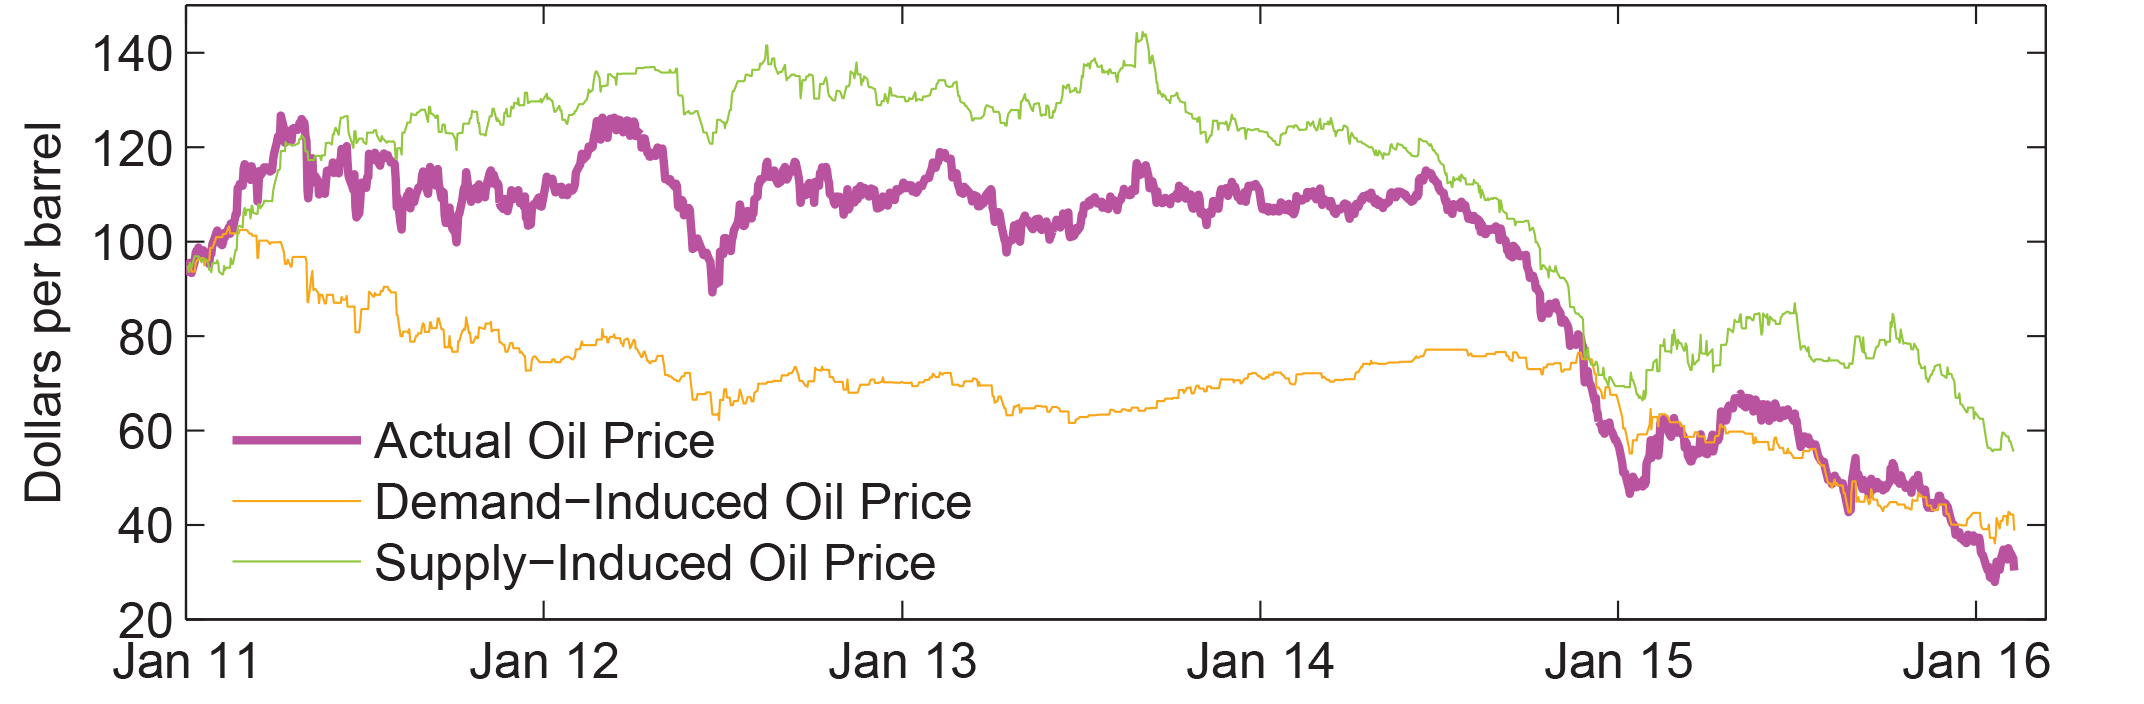
Identifying Demand-induced and Supply-induced Oil Price Changes
To better determine the underlying economic factors that may be driving the link between oil prices and inflation compensation, we classify daily oil price changes into "supply-induced" and "demand-induced" movements. We base our classification on a simple identifying assumption that links movements in oil prices with movements in equity and metals prices. Our assumption is that increases in oil supply (either actual or prospective) should cause oil prices to decline. However, since these lower oil prices should improve overall economic prospects, equity and metals prices should increase4 . Conversely, worsening economic prospects for global demand should cause all three prices to decline. Based on these assumptions, a daily change in oil prices is defined as "demand-induced" if it has the same sign as the contemporaneous changes in both equity and metals prices. All other price changes are defined as "supply-induced".5
The decomposition of oil into demand-induced and supply-induced changes is reported below in Figure 2. The purple line in the figure is the actual price of oil (the Brent front-month futures price). The green line is how oil prices would have evolved over time if subject to only supply-induced changes, while the orange line shows how oil prices would have evolved if subject to only demand-induced changes. The results match contemporaneous reports. The sharp increases in oil prices in early 2011 and 2012 related to events in Libya and Iran are clearly identified as supply-induced changes. In addition, much of the sharp decline that occurred during the summer and early fall of 2014 is identified as a supply-induced change. For much of 2015 and into early 2016, demand induced changes have played a much more important role, which is in line with press reports.
Empirical Evidence
To establish the relationship between changes in inflation compensation and oil prices, we start with a simple daily regression. We report results for inflation compensation (measured as the difference between the nominal and real 5-year yields, 5-years ahead). As the explanatory variable, we use the contemporaneous change in log oil prices (measured as front-month futures quotes for Brent oil) from January 2011 through June 2014. The benefit of ending the sample in June 2014 is that developments in inflation compensation since then are explored as an out-of-sample exercise. In this regression, a one percent move in oil prices causes inflation compensation to move in the same direction by about 0.6 basis points (HAC robust T-statistics are reported below the coefficients).
$$$$\Delta \text{inflation compensation} = \underset{-0.48}{-0.001} + \underset{4.34}{0.61}\Delta \text{ln(oil}) + \varepsilon$$$$
A response of 0.6 basis points (i.e. just over 5/1000 of a percent) may sound miniscule. However, because Brent oil prices have declined from $115 per barrel to around $30, the cumulative log change in oil price is large, thus this regression model would attribute 80 of the observed 107 basis point decline in inflation compensation to oil price changes.
Our next regression tests whether inflation compensation responds differently to demand- versus supply-induced oil price changes. In particular, we create a dummy variable D, which is equal to one on days when the oil price change is demand-induced (i.e. both metals prices, measured using the GSCI metals index, and equity prices, measured using the S&P 500 index, moved in the same direction as oil prices). The resulting estimated equation is
$$$$\Delta \text{inflation compensation} = \underset{-0.30}{-0.00} + \underset{5.23}{1.09}D\Delta \text{ln(oil}) \underset{-1.33}{-0.24}(1-D)\Delta \text{ln(oil}) + \varepsilon$$$$
On average, when an oil price decline is associated with both lower metals and equity prices, inflation compensation moves in the same direction by almost 1.1 basis points for every log-percentage point change. On all other days, inflation compensation moves in the opposite direction of the oil price change. Although this negative coefficient is not statistically significant, the sign is consistent with theory that supply-induced increases prices are a negative drag for economic activity, which could reduce far-dated inflation expectations. Using a Wald Test, we reject the hypothesis that the coefficients on demand-induced and supply-induced changes are equal. The results are consistent with an interpretation that inflation compensation changes are not affected by oil price changes directly, but rather by revisions to perceptions of economic growth.
Although this decomposition is intuitive, there remains a slight puzzle. Although our model explains 65 of the 107 basis point decline in inflation compensation from June 2014 to now, it did not do well in the subinterval in the second half of 2014. Between July and December 2014, inflation compensation declined 44 basis points, but our model would have predicted only a 7 basis point decline. The model's inability to match the decline in inflation compensation from mid-2014 results from the model attributing the sharp decline in oil prices in 2014 to being mostly supply-driven, which in our specification does not reduce inflation compensation. Even though we missed over the subinterval, overall our model does well because inflation compensation moved higher in early 2015 and demand-induced changes played a greater role in moving oil prices in the 2015.
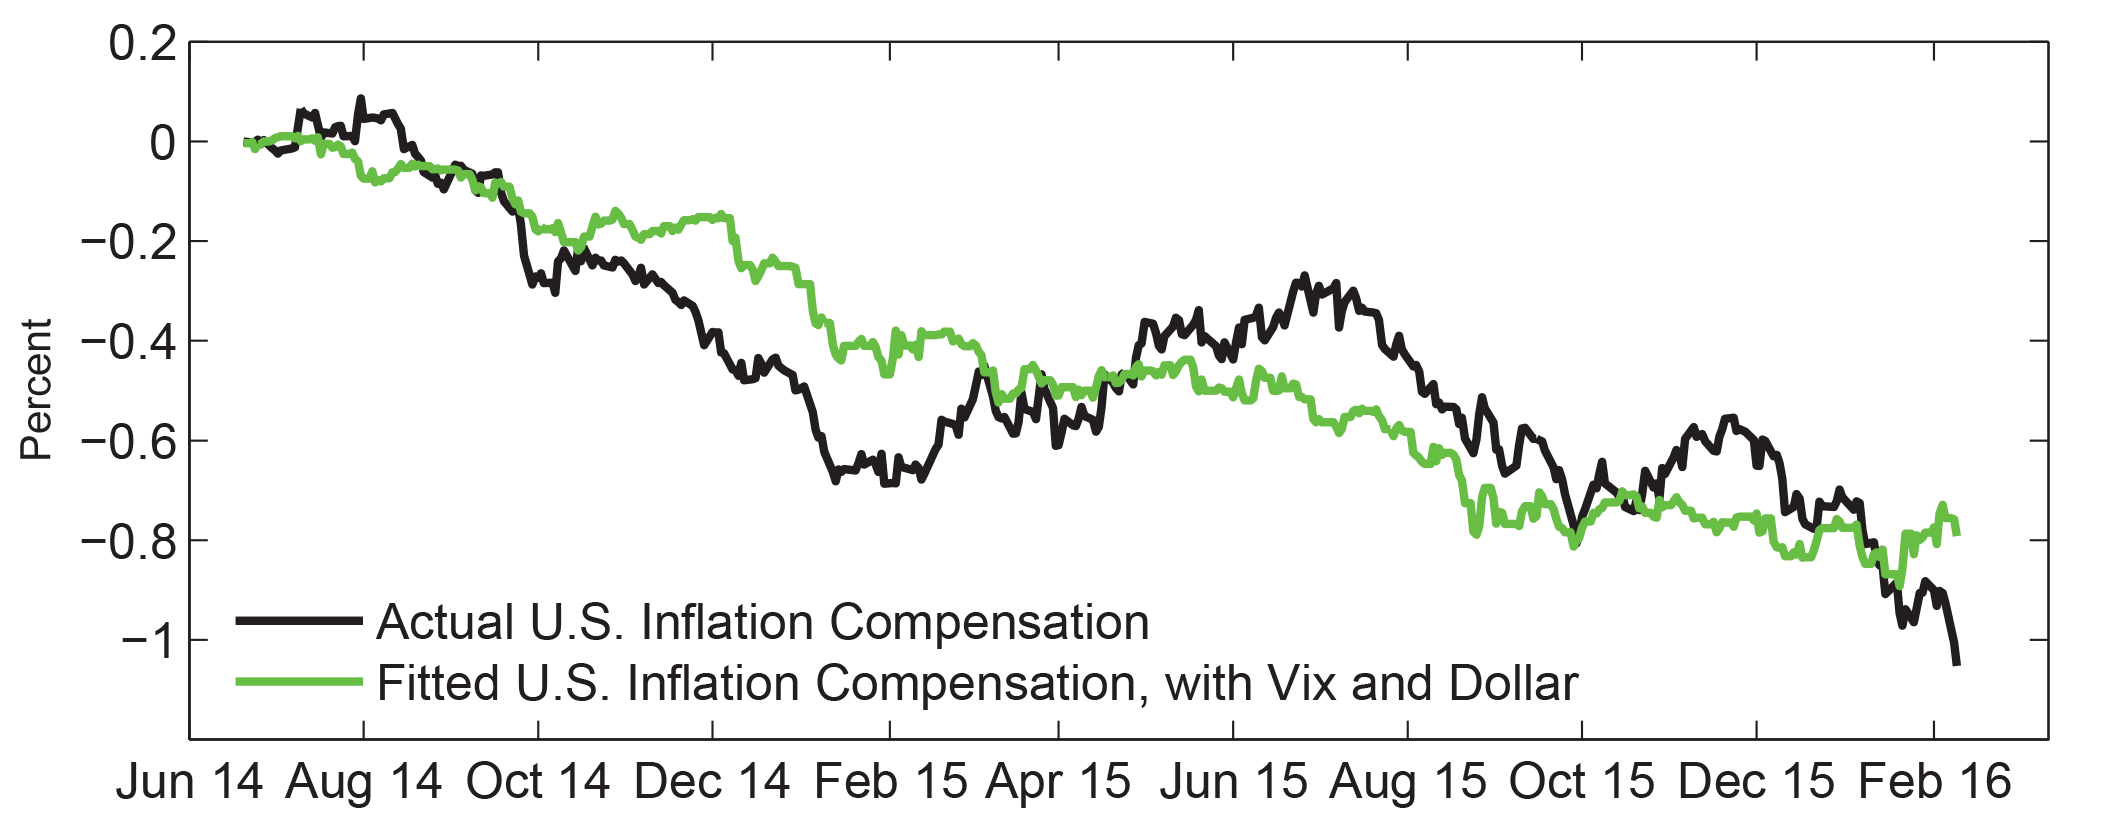
It is possible that what we call demand-induced changes may reflect changes in investors' risk aversion rather than changes in the economy's risk prospects. As such, to better approximate changes in risk sentiment, we augmented the model with a measure of financial market volatility (the VIX) and also the exchange value of the dollar. The new regression is similar to the original regression, but now both the VIX and the dollar also contribute to fitting changes in inflation compensation.
$$$$\Delta \text{inflation compensation} = \underset{-0.50}{-0.00} + \underset{2.82}{0.53}D\Delta \text{ln(oil}) \underset{-0.92}{-0.16}(1-D)\Delta \text{ln(oil}) \underset{-3.21}{-0.11}\Delta \text{ln(VIX}) \underset{-2.53}{-1.66}\Delta \text{ln(Dollar}) + \varepsilon$$$$
With the additional variables, our new model explains 76 of the 107 basis point decline in inflation compensation between June 2014 and February 2016. As indicated by the smaller coefficient on demand-induced oil price changes, some of the decline in inflation compensation that we attributed to demand-induced changes has instead been attributed to either the VIX or the dollar. The new model better explains what happened in the second half of 2014, predicting 26 of the 44 basis point decline between July and December 2014. In addition, as shown in Figure 3, the model (green line) and the data (black line) meet in the spring of 2015 and track closely for the remainder of 2015. Only since the start of 2016 have the model and the data again seem to diverge as inflation compensation moved lower.
Conclusions.
Our empirical results suggests that only demand-induced oil price declines cause large declines in inflation compensation. One question that still remains is why high frequency changes in assessments of growth should impact the outlook for economic performance sufficiently to move inflation expectations five to ten years out. Elliot, Jackson, Raczko, and Roberts-Sklar (2015) hypothesize that one reason may be an expectation by market participants that central banks will be constrained by the zero lower bound. If so, this suggests that as we move away from the current era of the zero lower bound, the responsiveness of inflation compensation to oil price changes may decline.
Another implication of our work is that if the decline in oil compensation since June 2014 has been demand-driven, then a tightening of supply conditions that pushes up the price of oil could further depress inflation compensation. Although the estimated coefficient on supply-induced changes is not statistically significant, the coefficient is negative. By operating through standard macroeconomic channels, higher oil prices resulting from reduced oil supply could be a drag on economic activity both now and in the future, reducing inflation compensation even more.
References
Blanchard, Olivier (2016, January 17). The Price of Oil, China, and Stock Market Herding, Retrieved from http://blogs.piie.com/realtime/?p=5341
Elliott, David, Chris Jackson, Marek Raczko and Matt Roberts-Sklar (2015, October 20). Does oil drive financial market measures of inflation expectations? Retrieved from http://bankunderground.co.uk/2015/10/20/does-oil-drive-financial-market-inflation-expectations/
Groen, Jan, Kevin McNeil, and Menno Middeldorp (2013, March 25). A New Approach for Identifying Demand and Supply Shocks in the Oil Market, Retrieved from http://libertystreeteconomics.newyorkfed.org/2013/03/a-new-approach-for-identifying-demand-and-supply-shocks-in-the-oil-market.html 
Gürkaynak, Refet S., Brian Sack, and Jonathan H. Wright, 2008, "The TIPS Yield Curve and Inflation Compensation" FEDS working paper 2008-05 Retrieved from http://www.federalreserve.gov/pubs/feds/2008/200805/200805abs.html
Hamilton, J. D. (2003). "What is an Oil Shock?" Journal of Econometrics, 113, 363398.
Kilian, Lutz. (2009). "Not All Oil Price Shocks Are Alike: Disentangling Demand and Supply Shocks in the Crude Oil Market." American Economic Review, 99(3): 1053-69.
Kocherlakota, Narayana (2016, January 14). Information in Inflation Breakevens about Fed Credibility, Retrieved from https://sites.google.com/site/kocherlakota009/home/policy/thoughts-on-policy/1-14-16
Sussman, Nathan and Osnat Zohar (2015, September 16). Oil prices, inflation expectations, and monetary policy, Retrieved from http://www.voxeu.org/article/oil-prices-inflation-expectations-and-monetary-policy
1. The views in this paper are solely the responsibility of the authors and should not be interpreted as reflecting the views of the Federal Reserve System. Return to text
2. Movements in the slope of the futures curve since June 2014 actually suggest that oil prices might be expected to boost inflation in the coming years. Between June 2014 and now, the futures curve for oil delivered five to ten years in the future went from downward sloping (predicting falling oil prices and hence a drag on inflation) to upward sloping (predicting rising oil prices and hence a boost to inflation). Return to text
3. A Bank of England report by Elliot, Jackson, Raczko, and Roberts-Sklar (2015) reviews the issues. Likewise, Kocherlakota (2016) describes how moves in inflation compensation (or as he refers to them inflation breakevens) can reflect either changes in inflation forecasts or inflation risk premium. Return to text
4. This identification is inspired by a long line of academic papers, including Hamilton (2003) and Kilian (2009), that find that oil price increases (resulting either from supply or precautionary-demand shocks) are bad for economic growth. In recent weeks, some have claimed that supply-driven oil price changes are causing equity prices to move in the same direction, which would be counter to our identification strategy. However, this claim is contentious (see Blanchard 2016) and, even if this relationship were to have changed in 2016, it would not have affected the empirical estimation whose sample period ends in June 2014. Return to text
5. In terms of related work that looks at demand and supply changes to oil prices, we would like to highlight two related papers. Groen, McNeil, and Middeldorp (2013) also use financial markets to distinguish between supply and demand changes to oil prices. However, their method for using financial market information is different and, to our knowledge, their decomposition has not been applied to inflation compensation. Sussman and Zohar (2015) also attempt to distinguish between supply and demand changes to oil prices by identifying common factors of price changes in oil, metals, and agricultural commodities. However, their empirical results find that demand and supply shocks have similar effects on U.S. inflation compensation. In contrast, our identification finds a large difference between the effects of demand-induced and supply-induced oil price changes on inflation compensation. It would seem likely that their finding results from their use of monthly data, whereas we used daily data, which should provide a finer discrimination between demand and supply effects. Return to text
Please cite as:
Perez-Segura, Alejandro, and Robert J. Vigfusson (2016). "The Relationship Between Oil Prices and Inflation Compensation," IFDP Notes. Washington: Board of Governors of the Federal Reserve System, April 06, 2016. https://doi.org/10.17016/2573-2129.19
Disclaimer: IFDP Notes are articles in which Board economists offer their own views and present analysis on a range of topics in economics and finance. These articles are shorter and less technically oriented than IFDP Working Papers.