FEDS Notes
August 30, 2019
The Distributional Financial Accounts
Michael Batty, Joseph Briggs, Karen Pence, Paul Smith, and Alice Volz
Overview
The Distributional Financial Accounts (DFAs) provide quarterly measures of the distribution of aggregate U.S. household wealth, beginning with the third quarter of 1989. They are derived from the integration of two data products produced by the Federal Reserve Board: the Financial Accounts of the United States, which provide quarterly data on aggregate balance sheets of major sectors of the U.S. economy, and the Survey of Consumer Finances (SCF), which provides comprehensive triennial microdata on the assets and liabilities of a representative sample of U.S. households. The DFAs combine the SCF's rich distributional information with the Financial Accounts' quarterly national accounting framework in a manner that is consistent with both data sets. The DFAs are released about a week after the quarterly publication of the Financial Accounts.1
The DFA project is a major addition to the Enhanced Financial Accounts (EFA) initiative, which seeks to expand the scope of the Financial Accounts by adding information from new data sources.2 Our goal is to make the DFAs a useful source of timely data for policy makers, analysts, and researchers, and to contribute to the growing field of research on the wealth distribution of the United States.
This Note describes briefly how the DFAs are constructed and highlights some of their key features. A detailed description of the construction of the data and findings can be found in the FEDS working paper Introducing the Distributional Financial Accounts of the United States.3
Construction of the DFAs
The fundamental concept of the project is to apply the distribution of household wealth as measured in the SCF to aggregate household wealth as measured in Table B.101.h of the Financial Accounts.4 In particular, the DFAs allocate each line of Table B.101.h to four percentile groups of wealth: the top 1 percent, the next 9 percent (i.e., 90th to 99th percentile), the next 40 percent (50th to 90th percentile), and the bottom half (below the 50th percentile). Future releases of the DFAs will allocate Table B.101.h to groups based on income, education, and other household characteristics.
Because the two underlying datasets use somewhat different wealth concepts and are measured at different frequencies, there are three key steps in constructing the DFAs. The first step is to adjust the wealth concepts and measures used in the SCF in order to obtain household balance sheets comparable to the Financial Accounts.5 The second step is to transform the triennial SCF measure into a quarterly measure by (1) interpolating the balance sheet for each wealth-percentile group for each quarter between SCF surveys, and (2) forecasting these balance sheets for each quarter beyond the most recent SCF survey and through the most recent quarter of Financial Accounts data. The final step is to calculate the shares of assets and liabilities held by each wealth group in the quarterly, reconciled SCF data, and then distribute the Financial Accounts aggregates by applying these shares. Full details of the approach are provided in the FEDS paper.
Key Features of the DFA Data
Figure 1 shows the time series of aggregate household wealth since 1989, broken down into the four wealth groups described above. Figure 2 presents the same data in terms of shares of total wealth held by each of the four percentile groups. Combined, these figures illustrate three key features of the DFAs.
First, the DFAs provide a new measure of the distribution of household wealth, based on a comprehensive integration of disaggregated household-level wealth data with official aggregate wealth measures. Like other studies of the wealth distribution, the figures show a substantial difference in the amount of wealth held by the top of the distribution and the bottom. For example, the wealth of the top 1 percent (purple area at the top of the figure) is considerably larger than that of the bottom 50 percent (red area at the bottom of the figure), with this difference increasing significantly over the last 30 years. In terms of shares, the top 1% owned about 31% of total wealth in the first quarter of 2019, while the bottom half owned about 1%. These findings are generally consistent with other studies, although the overall level of wealth inequality implied by the DFAs is a bit lower than that observed in some other research.6
A second key feature of the DFA dataset is its quarterly frequency, making it useful for studying the business cycle dynamics of wealth inequality. For example, the figures show that the top 10 percent of the distribution (the top two categories combined) experienced larger increases in wealth during the mid-2000s and larger decreases (in dollar terms) at the start of the Great Recession. These dynamics are typically difficult to observe in detail with other data sets because peaks and troughs often fall between times of measurement.
Finally, a third important feature of the DFAs is their timeliness. The data in Figures 1 and 2 extend through the first quarter of 2019, making the DFAs a "near-real-time" measure of the wealth distribution, which makes it more useful for understanding how changes in the wealth distribution could affect the economic outlook.7 Taken together, these three features of the DFAs help provide new information about the evolution of the U.S. wealth distribution over time.
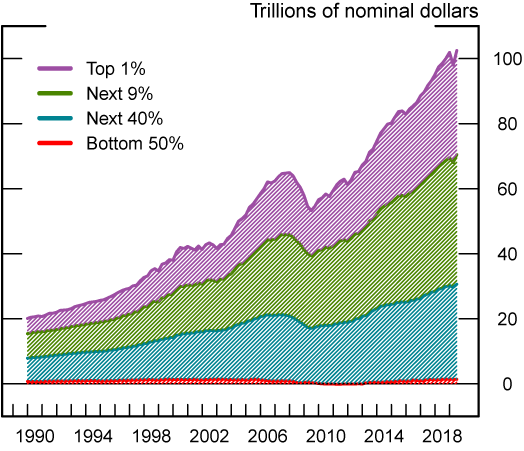
Note: Key identifies regions in order from top to bottom.
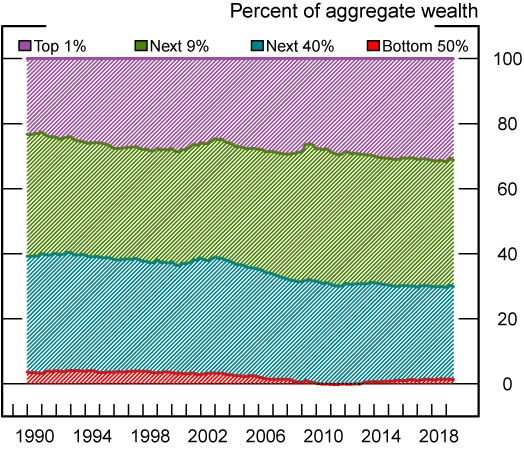
Note: Key identifies regions in order from top to bottom.
1. The most recent release is for the first quarter of 2019. Return to text
2. More information about the EFA initiative, and additional EFA projects, can be found on the EFA home page. Return to text
3. The DFA project is the product of a large team of researchers at the Federal Reserve Board. In addition to this Note's authors, key contributors to the DFA project include Jesse Bricker, Sarah Friedman, Elizabeth Holmquist, Susan McIntosh, Kevin Moore, Danielle Nemschoff, Eric Nielsen, Sarah Reber, Molly Shatto, Kamila Sommer, Thomas Sweeney, and Jeff Thompson. Return to text
4. Table B.101.h measures the aggregate assets and liabilities of U.S. households. For more information on the construction of Table B.101.h, see the FEDS Note Household and Nonprofit Balance Sheets in the Financial Accounts of the United States. Return to text
5. In some cases (such as life insurance policies and defined-benefit pensions), we impute to the SCF assets and liabilities that are not fully measured in the survey. Return to text
6. For more discussion on the reason for these differences see the accompanying FEDS paper. Return to text
7. For an example of research on how changes in the wealth distribution could affect aggregate consumption, see the FEDS Note A Not-So-Great Recovery in Consumption: What is holding back household spending? Return to text
Batty, Michael, Joseph Briggs, Karen Pence, Paul Smith, and Alice Volz (2019). "The Distributional Financial Accounts," FEDS Notes. Washington: Board of Governors of the Federal Reserve System, August 30, 2019, https://doi.org/10.17016/2380-7172.2436.
Disclaimer: FEDS Notes are articles in which Board staff offer their own views and present analysis on a range of topics in economics and finance. These articles are shorter and less technically oriented than FEDS Working Papers and IFDP papers.