Experiences and Perspectives of Young Workers
Outlook and Expectations
The survey was designed to gauge young workers' attitudes and expectations about jobs and careers over time. The 2015 survey reveals that optimism among young workers increased in the past two years. Although many factors contribute an individual's perspective, the survey is designed to measure shifts in young worker's job outlook as the labor market recovery from the Great Recession progresses and job expectations as the alternative work arrangements options grow.
Outlook about Future Job Opportunities
The 2013 survey was administered approximately four years in to the economic recovery from the Great Recession, and at a time when the job recovery was still considered weak. The survey is designed to measure changes in young workers' outlook about the labor market as the recovery becomes a part of the past. For this purpose, the survey asks respondents about their view of future job opportunities as well as the personal and external economic factors that contribute to their viewpoint.
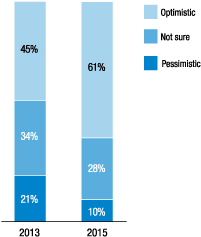
The survey showed an increase in young adults' optimism about future job opportunities from 2013 (45 percent) to 2015 (61 percent). Likewise, young adults demonstrated a decrease in pessimism (from 21 percent to 10 percent) about future job opportunities as well as uncertainty (from 34 percent to 28 percent) (figure 1).

Note: Number of responses in 2013 is 2,097. Number of responses in 2015 is 2,035.
As will be discussed throughout this report, educational attainment is correlated with young workers' experiences and outlook. The survey data show that, on average, respondents' optimism increases with higher levels of education. For example, 47 percent of respondents with a high school education, 69 percent with a bachelor's degree, and 84 percent of those with a professional or doctorate degree are optimistic about their job future. The overall rise in optimism is also evident in each level of educational attainment from 2013 to 2015 (table 11).
| Response | 2013 | 2015 |
|---|---|---|
| Educational attainment | ||
| High school diploma or GED equivalent | 35 | 47 |
| Bachelor's degree | 59 | 69 |
| Professional or doctorate degree | 68 | 84 |
| Currently enrolled in an education or training program | 57 | 72 |
In both years, respondents currently enrolled in school are more optimistic than overall respondents (57 percent in 2013 and 72 percent in 2015, compared with 45 percent overall in 2013 and 61 percent overall in 2015) (table 11).
Notably, respondents who are currently employed are more likely to be optimistic about future job opportunities (65 percent) than those who are not currently employed (51 percent). Unemployment is associated with pessimism as 23 percent of respondents who are seeking a job (and not currently working) are pessimistic about their job future and 30 percent are unsure (table 12).
| Response | Optimistic (percent) |
Not sure (percent) |
Pessimistic (percent) |
Number of responses | |
|---|---|---|---|---|---|
| Currently working as a paid employee | 65 | 26 | 8 | 1,468 | |
| Not currently working | |||||
| Currently looking for a paid job ("unemployed") | 47 | 30 | 23 | 257 | |
| Not currently looking for a paid job (not participating in labor force) | 54 | 37 | 8 | 310 | |
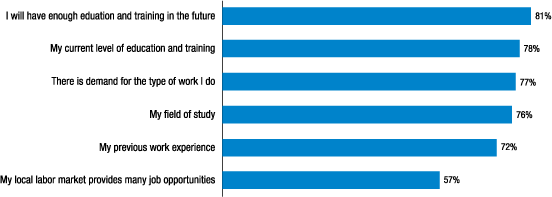
Respondents who are optimistic about their future job opportunities were asked to indicate the factors that contribute to this feeling. Educational attainment was the most frequently cited reason that respondents were optimistic as 81 percent report "I will have enough education and training in the future," and 78 percent report "my current level of education and training." Respondents also attribute their optimism to the educational field they selected as 77 percent said "there is demand for the type of work I do" and 76 percent said "my field of study" (figure 2).
Figure 2. Please indicate whether any of the factors contributed to your feeling optimistic about your future job opportunities

Note: Number of responses is 1,230.
Respondents who are pessimistic about their future job opportunities were asked to indicate the factors that contribute to this feeling. "Lack of work experience" was the most frequently cited reason for feeling pessimistic (68 percent) followed by their "current level of education" (67 percent). The third ranked reason was a lack of opportunities in the local job market (57 percent) (figure 3).
Figure 3. Please indicate whether any of the factors contributed to your feeling pessimistic about your future job opportunities

Note: Number of responses is 219.
Respondents who are not sure about their future job opportunities were asked about factors that contribute to this feeling. "My current level of education and training" was the most frequently cited reason for feeling not sure (51 percent) followed by their "local labor market" (42 percent) (figure 4).
Figure 4. Please indicate whether any of the factors contributed to your feeling not sure about your future job opportunities

Note: Number of responses is 580.
Steady Employment vs. Higher Pay
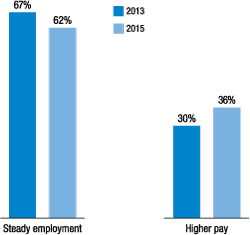
As the labor market continues to increase the use of alternative work arrangements, it is important to assess young workers' appetite and tolerance for volatility in their pay and work schedule. The survey asked respondents whether they prefer "steady employment" or "higher pay" to gauge their desire for security when selecting a job. Although respondents favored steady work over higher pay in both 2013 and 2015, the survey shows a decrease in the preference for steady work from 2013 (67 percent) to 2015 (62 percent) (figure 5).
Figure 5. Is it more important to have a job that pays more or a job that is more likely to provide steady employment?

Respondents who had more than one paid job in the past year were less likely to prefer steady employment (56 percent) than the total sample (62 percent). That said, those who worked more than one job at the same time in the past year were nearly as likely (60 percent) to prefer steady employment as the total sample (table 13).
| Response | Total | Respondents who had more than one paid job in the past year | Respondents who had more than one paid job AT THE SAME TIME in the past year |
|---|---|---|---|
| Steady employment | 62 | 56 | 60 |
| Higher pay | 36 | 42 | 39 |
| Number of responses | 2,035 | 796 | 333 |
In 2015, the survey probed the respondents about their definition of "steady work." More specifically, the 2015 survey asked respondents whether they would prefer one job or multiple jobs for the next five years, assuming the work is "steady." Among respondents who prefer steady work, 80 percent preferred one job for the next five years, 12 percent preferred multiple jobs (but only one job at a time), and 7 percent preferred multiple jobs (even if this meant more than one job at a time) (table 14).
| Response | Prefer "steady employment" |
|---|---|
| One job for the next five years | 80 |
| Multiple jobs over the next five years (only one job at a time) | 12 |
| Multiple jobs over the next five years (okay with more than one job at a time) | 7 |
Note: Number of responses is 1,290.
Respondents who have experience with more than one job in the past year were slightly less likely to prefer one job for the next five years (70 percent). Respondents working more than one job at the same time in the past year were much less likely to prefer a single job for the next five years (62 percent) (table 15).
| Response | Respondents who had more than one paid job in the past year | Respondents who had more than one paid job AT THE SAME TIME in the past year |
|---|---|---|
| One job for the next five years | 70 | 62 |
| Multiple jobs over the next five years (only one job at a time) | 17 | 19 |
| Multiple jobs over the next five years (okay with more than one job at a time) | 12 | 19 |
| Number of responses | 796 | 333 |
The 2015 survey also probed respondents about the ideal amount of time to remain at a single job. While 54 percent of respondents said that there is no ideal amount of time to stay at a job, 6 percent favored no more than two years, 5 percent favored no more than 10 years, and 21 percent said they do not know. There was no difference in responses between the total sample and those who have already joined the workforce (table 16).
| Response | Percent |
|---|---|
| No more than one year | 3 |
| No more than two years | 6 |
| No more than five years | 11 |
| No more than 10 years | 5 |
| There is no ideal amount of time to stay at a job | 54 |
| I don't know | 21 |
Note: Number of responses is 2,035.
Box 1. Optimism Is Similar across Race and Ethnicity
Despite black and Hispanic respondents lagging white respondents in education, job experience, and self-sufficiency, respondents do not show a significant difference in their outlook about the future across racial and ethnic lines. In 2015, optimism increased across all racial and ethnic groups: Black respondents (63 percent) report as much in optimism as white respondents (64 percent). Hispanic respondents also expressed an increase in optimism but are not as optimistic as their black and white counterparts (figure A).

Parents' Education
As noted throughout this report, there is sound evidence that educational attainment has a positive effect on labor market and financial outcomes. In order to assess the likelihood of young adults exceeding their parents in educational attainment and labor market outcomes, the survey included questions about both parental educational attainment and the respondents' belief about their future standard of living.
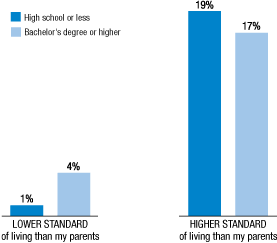
When respondents were asked how they expect their standard of living to compare with their parents' standard of living, most respondents are not sure. That said, respondents with a least one parent with a bachelor's degree or higher level of educational attainment are more likely to believe they will have a lower standard of living than their parents (4 percent) when compared with respondents whose parents have a high school education or less (1 percent). Likewise, respondents whose parents have a high school education or less are more likely to believe they will have a higher standard of living than their parents (19 percent) when compared with respondents with at least one parent with a bachelor's degree or higher (17 percent) (figure 6).
Figure 6. When you reach your parents' current age, how do you expect your standard of living to compare to their current standard of living? (by parents' educational attainment)

Box 2. Black Respondents More Likely to Expect a Higher Standard of Living than Their Parents
Black respondents overwhelmingly expect that they will have a higher standard of living than their parents (69 percent), while Hispanic respondents have lower expectations than black respondents about exceeding their parents' standard of living (57 percent). White respondents have the lowest expectations of all three racial/ethnic groups about having a higher standard of living than their parents (46 percent).
Related Research on Young Workers' Outlook and Expectations
Young adults worldwide generally perceive a promising future for themselves, including a successful career. According to ManpowerGroup's 2016 global study of millennials, two-thirds of the respondents are optimistic about their immediate job prospects and 62 percent are confident that if they lost their main source of income tomorrow they could find equally good or better work within three months.21
In the United States, a 2014 Gallup poll of Americans found that although national optimism about the future decreased following the Great Recession, young people remain more optimistic than the general population. For example, 30 percent of all respondents said it is a good time to find a quality job compared with 46 percent of respondents aged 18- to 29-years-old.22
References
21. ManpowerGroup, Millennial Careers: 2020 Vision: Facts, Figures, and Practical Advice from Workforce Experts(Milwaukee: ManpowerGroup, 2016), www.manpowergroup.com/wps/wcm/connect/660ebf65-144c-489e-975c-9f838294c237/MillennialsPaper1_2020Vision_lo.pdf?MOD=AJPERES . The term "millennial" refers to those born between 1982 and 1996. Return to text
22. Gallup Polls, 2014. See www.gallup.com/poll/168704/americans-quality-jobs-outlook-improves-april.aspx. Return to text
