
Experiences and Perspectives of Young Workers
 Print
PrintProfile of Employees
Survey respondents are asked a range of questions about their employment status and job readiness, and about their preference for traditional work, alternative work arrangements, and flexible work. The survey also asks respondents whether they feel qualified for their current job.
Permanent/Long-Term and Temporary Employment
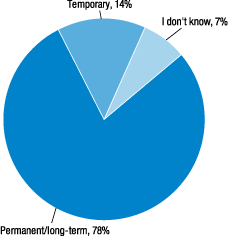
In order to assess how young workers are being affected by the increase in temporary jobs, the survey asks about permanent/long-term ("permanent") and temporary job status. In the survey, 78 percent of employees have a permanent job, 14 percent have temporary job, and 7 percent do not know if their job is permanent or temporary (figure 14).35
It is worth noting here that permanent employment is not the same as stable or consistent employment. To this point, 31 percent of employees with a permanent job have work schedules that change daily, weekly, or monthly. Temporary employees are even more likely to have jobs with variable schedules as 55 percent have work schedules that change daily, weekly, or monthly.
In the survey, employees with permanent jobs are more likely to enjoy more positive labor outcomes when compared with employees with temporary jobs. For example, 68 percent of employees with a permanent job are optimistic about their future job opportunities compared with 43 percent of employees with a temporary job (table 22).
| Response | Job is permanent | Job is temporary |
|---|---|---|
| Optimistic about future job opportunities | 68 | 43 |
| Working in a career field closely related to education and training | 49 | 26 |
| Job is a "career" or "stepping stone to a career" | 70 | 37 |
| Very satisfied with benefits you currently receive from your employer(s) | 57 | 29 |
| Receive paid time off for sick leave and/or holidays from any of your paid jobs | 71 | 24 |
| Employer pays all or part of health-care premium | 54 | 14 |
| Training opportunities through an employer(s) | 48 | 26 |
Permanent employees are more likely to be working in a career field that is closely related to their education and training (49 percent) than those with a temporary job (26 percent). Furthermore, employees with permanent jobs are more likely to describe their job as a "career" than "just a job." More specifically, 70 percent of those with permanent employment describe their job as a "career" or a "stepping stone to a career" compared with 37 percent of those with temporary employment (table 22).
The survey asked a number of questions about respondents' employment benefits. Overall, 57 percent of employees with a permanent job are very or somewhat satisfied with the benefits they receive from their employer compared with 29 percent of employees with a temporary job (table 22).
More specifically, 71 percent of employees with a permanent job receive paid time off for sick leave, holidays, or both compared with 24 percent of those with a temporary job. In addition, 54 percent of employees with a permanent job have an employer that contributes to a health insurance plan (paying all or part of the corresponding premium) compared with 14 percent of temporary employees. Finally, 48 percent of permanent employees have training opportunities through their employer compared with 26 percent of temporary employees (table 22).
The data were used to identify key characteristics of employees who are more likely to hold permanent jobs than the 78 percent of overall employees. Eighty-four percent of employees with a bachelor's degree and 95 percent of employees with a master's, professional, or doctorate degree have a permanent job (table 23).
| Employee characteristics | Percent with permanent job |
Number of responses |
|---|---|---|
| Total employees | 78 | 1,027 |
| Educational attainment | ||
| Bachelor's degree | 84 | 416 |
| Master's degree, professional, or doctorate | 95 | 176 |
| Early work experience | ||
| Worked for pay during high school | 82 | 800 |
| Worked for pay during college | 83 | 847 |
| Held one or more unpaid internship(s) during college | 84 | 174 |
| Held one or more paid internship(s) during college | 91 | 174 |
In addition, 82 percent of employees who worked for pay during high school and 83 percent of employees who worked for pay during college have a permanent job. Furthermore, 84 percent of those who held an unpaid internship during college and 91 percent of those who held a paid internship during college have a permanent job (table 23).
Box 5. White Employees and Non-metropolitan Employees Are More Likely to Have Permanent Jobs
White employees are more likely to have a permanent job than black and Hispanic employees. In the survey, 83 percent of white employees have a permanent job compared with 75 percent of Hispanic and 73 percent of black employees. Furthermore, employees in non-metropolitan areas are more likely to have a permanent job (88 percent) than those in metropolitan areas (77 percent).
Return to textFull-Time and Part-Time Employment
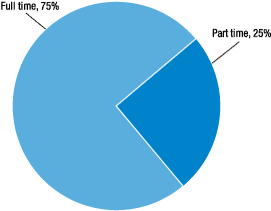
In order to assess how young workers are being affected by the increase in part-time work, the survey asks about full-time and part-time job status. In the survey, 75 percent of employees have a full-time job and 25 percent have a part-time job (figure 15).36
The survey data show that 24 percent of full-time employees and 43 percent of part-time employees have paid jobs with non-traditional hours. Furthermore, 29 percent of full-time employees and 56 percent of part-time employees have schedules that change daily, weekly, or monthly. In addition, 65 percent of full-time employees are optimistic about their job future compared with 54 percent of part-time employees (table 24).
| Outcomes | Job is full time | Job is part time |
|---|---|---|
| Optimistic about future job opportunities | 65 | 54 |
| Working in a career field closely related to education and training | 51 | 27 |
| Job is a "career" or "stepping stone to a career" | 72 | 38 |
| Very satisfied with benefits you currently receive from your employer(s) | 60 | 25 |
| Receive paid time off for sick leave and/or holidays from any of your paid jobs | 75 | 24 |
| Employer pays all or part of health-care premium | 64 | 9 |
| Training opportunities through an employer(s) | 49 | 22 |
Employees with a full-time job are more likely to be working in a career field that is closely related to their education and training (51 percent) than part-time employees (27 percent). Again, similar to permanent employees, full-time employees are more likely to consider their main job to be a "career" or a "stepping stone to a career" than their part-time counterparts. More specifically, 72 percent of full-time employees consider their main job to be a career or a stepping stone to a career compared with 38 percent of part-time employees (table 24).
Overall, 60 percent of full-time employees are satisfied with the benefits their employer provides, while 25 percent of part-time employees are satisfied with the benefits their employer provides. In the survey, 75 percent of full-time employees receive paid time off for sick leave, holidays, or both compared with 24 percent of part-time employees. In addition, 64 percent of full-time employees have an employer that contributes to a health insurance plan compared with 9 percent of part-time employees. Finally, 49 percent of full-time employees have training opportunities through their employer compared with 22 percent of part-time employees (table 24). Again, the data were used to identify key characteristics of employees who are more likely to hold full-time jobs than the 75 percent of overall employees.
Higher levels of educational attainment are correlated with full-time jobs. Notably, 85 percent of employees with a bachelor's degree and 90 percent of employees with a master's professional or doctorate degree have a full-time job (table 25).
| Characteristics | Percent with full-time job |
Number of responses |
|---|---|---|
| Total employees | 75 | 986 |
| Educational attainment | ||
| Bachelor's degree | 85 | 416 |
| Master's degree, professional, or doctorate | 90 | 176 |
| Early work experience | ||
| Worked for pay during high school | 79 | 800 |
| Worked for pay during college | 78 | 847 |
| Held one or more paid internship(s) during college | 94 | 174 |
Early work experience is associated with many positive labor market outcomes. Seventy-nine percent of employees who worked for pay during high school and 90 percent of employees who worked for pay during college have a full-time job. Furthermore, 94 percent of those who held a paid internship during college have a full-time job. In terms of full-time work, there was no correlation with unpaid internships during college (table 25).
Box 6. White, Black, and Non-metropolitan Employees Are More Likely to Have Full-Time Jobs
White and black employees are more likely to have a full-time job (76 percent for both) than Hispanic employees (69 percent). Also, employees in non-metropolitan locations are more likely to have a full-time job (87 percent) than those in metropolitan locations (73 percent).
Return to textUnderemployment
In order to determine the rate of underemployment among respondents, the survey asks the part-time employees whether they would prefer more work hours.37 Among part-time employees, 49 percent are underemployed or working part time because of economic conditions. More specifically, 42 percent of part-time employees could only find part-time work, and 17 percent had employers cut their hours because of business conditions (11 percent reported both reasons) (table 26).
| Economic reasons/involuntary (underemployed) | 49 |
|---|---|
| I could only find part-time work | 42 |
| My employer cut my hours due to business conditions | 17 |
| Personal preference | |
| I prefer part-time work | 42 |
| I am enrolled in a school/training program | 39 |
| I have family responsibilities | 29 |
| I am caring for young children | 21 |
| I have health problems | 10 |
| Number of responses | 270 |
Note: Respondents could select more than one reason.
However, 42 percent of part-time employees prefer part-time work, including 39 percent who are enrolled in school and 29 percent who work part time because they have family responsibilities (table 26).
Multiple Jobs
The survey asks questions to determine the respondents' expectations about working multiple jobs. In the survey, employees expect to have fewer paid jobs in the coming year than they have held in the past year. For example, 63 percent of employees held one full-time job in the past year, yet 80 percent of employees expect to have just one full-time job in the coming year. Likewise, 18 percent of employees had held multiple full-time jobs in the past year, yet 8 percent expect to have multiple full-time jobs in the coming year (figure 16).
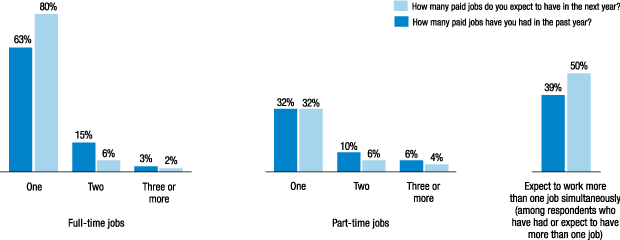
The findings are similar for part-time work as 10 percent of employees expect to have more than one part-time job in the coming year, yet 17 percent held multiple part-time jobs in the past year (figure 16).
Among employees who hold multiple jobs, most would prefer to work more jobs at the same time than they have experienced in the past year. In the past year, 39 percent of employees with multiple jobs worked at more than one job at the same time. Yet, 50 percent of employees expect to work more than one job at the same time in the coming year (figure 16).
Job Qualifications
The survey asks respondents about whether they feel qualified for their current job. Overall, 25 percent of employees describe themselves as overqualified for their job. In 2013, the data showed a correlation between educational attainment level and overqualification such that respondents with postsecondary education were more likely to be overqualified for their job.38 In 2015, the analysis did not show a corrrelation between educational attainment and being overqualified for one's job (table 27).
| "Overqualified" employees | 2015 (percent) | Number of responses |
|---|---|---|
| Total "overqualified" | 25 | 1,256 |
| Educational attainment | ||
| Less than high school | 22 | 35 |
| High school or equivalent | 21 | 221 |
| Some college, no degree | 28 | 219 |
| Certificate or technical degree | 26 | 56 |
| Associate's degree | 24 | 127 |
| Bachelor's degree | 30 | 416 |
| Master's degree | 11 | 136 |
| Professional or doctorate degree | 11 | 40 |
Note: Small samples sizes for some levels of educational attainment.
Related Research on Employment
A 2015 Aspen Institute survey of organizations that provide workforce services to young adults revealed that the top five job qualities for "good jobs" are: (1) stable employment (not contract or temporary); (2) full-time work; (3) predictable, set hours; (4) self-sufficiency; and (5) opportunities for advancement and pay increases (4 and 5 are discussed in the Self-Sufficiency section of this report). While these "good jobs" have grown the most in the recovery, it should be noted that almost all good jobs have gone to college graduates.39
According to a 2015 study by ManpowerGroup, job security is critical for millennials who want to ensure they can maintain their standard of living.40 Today's young adults are generally not job hoppers, unless there is an opportunity for advancement.41 Young workers want standard work arrangements, which typically offer higher wages, less income volatility, and more benefits than contingent work.42
Despite young workers' desire for secure employment, the labor market is shifting toward an increased use of alternative work arrangements. A 2016 study by Katz and Krueger found the percentage of workers engaged in alternative work rose from 10.1 percent in February 2005 to 15.8 percent in late 2015. Furthermore, they estimate that all of the net employment growth in the economy during this period occurred in the form of alternative work arrangements.43
Because alternative work arrangements are difficult to classify and measure, the literature does not provide consistent findings about how the increase in alternative work has affected young workers. Katz and Krueger (2016) maintain that despite the noted growth in alternative work incidences between 2005 and 2015, 16- to 24-year-old workers experienced no growth in alternative work arrangements.44 However, a 2015 study from the U.S. Government Accountability Office (GAO) found that compared with standard full-time workers, contingent workers are more likely to be young.45
In addition, many workers who prefer full-time work are still finding part-time work as their only option. As a result, despite recent job growth, underemployment among young adults has risen, as job opportunities often underutilize their availability to work.
References
35. In the survey, "job" refers the respondents' main job, the job where they work the most hours. Return to text
36. In the Survey of Young Workers, full-time jobs are defined as 35 hours per week or more. Return to text
37. Underemployed, or "part time for economic reasons" or "involuntary part time" includes persons who indicated that they would like to work full time but were working part time (one to
34 hours) because of an economic reason, such as their hours were cut back or they were unable to find full-time jobs. See http://www.bls.gov/cps/lfcharacteristics.htm. Return to text
38. The literature at this time suggested that because of a tight job market post-recession, many educated workers were being "pushed down" to low-skill jobs while many low-skill workers were being pushed out of the labor market. Return to text
39. Ranita Jain, Maureen Conway, and Vickie Choitz, Connecting Young Adults to Employment: Results from a National Survey of Service Providers, Aspen Institute. (Washington: The Aspen Institute, 2015), www.aspenwsi.org/wordpress/wp-content/uploads/YAemploy.pdf  . Return to text
40. ManpowerGroup, Millennial Careers. Return to text
41. Ibid. Return to text
42. David S. Pedulla, The Hidden Costs of Contingency: Employers' Use of Contingent Employees and Standard Employees' Outcomes, Center for the Study of Social Organization, Working Paper #6. (Princeton, N.J.: Princeton University, Department of Sociology, 2011), www.princeton.edu/csso/working-papers/WP6.pdf
. Return to text
43. Lawrence F. Katz and Alan B. Krueger, The Rise and Nature of Alternative Work Arrangements in the United States, 1995-2015. (Cambridge, Mass: Harvard University, 2016), http://scholar.harvard.edu/files/lkatz/files/katz_krueger_cws_v3.pdf?m=1459369766
. Return to text
44. Ibid. Return to text
45. U.S. Government Accountability Office, Contingent Workforce: Size, Characteristics, Earnings, and Benefits, GAO--15-168R (Washington: GAO, May 20, 2015), www.gao.gov/products/GAO-15-168R. Return to text