Experiences and Perspectives of Young Workers
Self-Sufficiency
An important measure of self-sufficiency is whether respondents have the household income to cover their expenses to maintain their financial obligations in the face of an emergency. In order to assess self-sufficiency, the survey asks questions about covering expenses, whether they receive family or other assistance, and their current housing arrangements. This analysis of financial self-sufficiency focuses on employees, the subgroup most likely to be financially prepared for independence
Income and Benefits
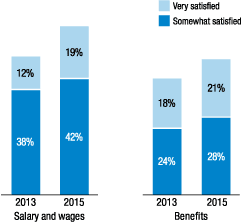
Young workers' satisfaction with their total salary and wages improved between 2013 and 2015. In 2015, employees are more likely to be "very" or "somewhat" satisfied with their salary and wages (19 percent and 42 percent, respectively) than respondents with a paid job in 2013 (12 percent and 38 percent, respectively). In 2015, employees are also more likely to be "very" or "somewhat" satisfied with their job benefits (21 percent and 28 percent, respectively) than the respondents with a paid job in 2013 (18 percent and 24 percent, respectively)
(figure 17).
Figure 17. Satisfaction with the total amount of salary or wages and benefits at the job or jobs you now hold

The survey asks questions about which benefits young workers find important and which benefits they currently have from their employers. In both 2013 and 2015, young workers identified health insurance (health care in 2013) and paid sick leave as the most important and second most important benefits to receive from an employer. In 2013, "matching contributions to savings" was the third most important, and in 2015, "contribution to tax deferred savings" was the third most important (table 28).
| Rank | 2013 | 2015 |
|---|---|---|
| 1 | Health care | Health insurance |
| 2 | Paid sick leave | Paid sick leave |
| 3 | Matching contributions to savings | Contribution to tax deferred savings |
| Number of responses | 1,144 | 1,058 |
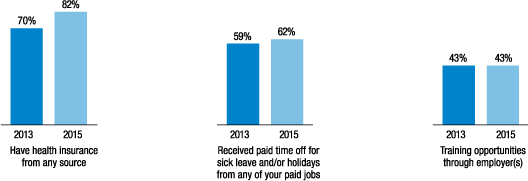
The percent of young workers who have health insurance (from any source) increased from 2013 (70 percent) to 2015 (82 percent). Likewise, the percent of young workers who received paid time off for sick leave, holidays, or both from any of their paid jobs increased from 2013 (59 percent) to 2015 (62 percent). Finally, training opportunities through employer(s) remained flat at 43 percent from 2013 to 2015 (figure 18).
Covering Household Expenses
In the survey, 73 percent of employees are able to cover their monthly household expenses with their household income. Meanwhile, 22 percent of employees report that they are sometimes able to cover their monthly household expenses, and 4 percent are not able to cover their monthly household expenses at all.
Among employees who are not able to cover their household expenses some or all of the time, 64 percent reduce their monthly expenses to meet the challenge, 56 percent do not pay some bills, 54 percent borrow money from family, 46 percent use their credit cards, 41 percent use savings, and 16 percent borrow from friends.
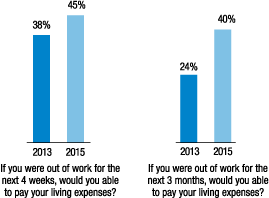
A key consideration regarding self-sufficiency is the ability of a household to withstand financial disruptions. Among young workers, the ability to go without a paycheck temporarily improved between 2013 and 2015. The percent of young workers who can pay their living expenses if out of work for four weeks improved from 38 percent in 2013 to 45 percent in 2015. In addition, the percent of young workers who can pay their living expenses if out of work for three months improved from 24 percent in 2013 to 40 percent in 2015 (figure 19).
External Financial Support
Many employees--including some employees who report that they cover their household expenses--receive financial support from their families. More specifically, many working respondents receive family assistance for food and their living situation (e.g., mortgage, rent, or just living with parents or relatives) (39 percent each). In addition, a substantial portion of working respondents receive assistance with miscellaneous bills (30 percent), health-care costs (24 percent), and automobile payments and maintenance (24 percent). Finally, a few receive assistance with educational costs (16 percent), their children (9 percent), and savings (7 percent).
Aside from family assistance, 8 percent of employees use government programs, such as the Temporary Assistance for Needy Families (TANF) or Housing Choice Vouchers programs, to meet their financial needs.46
Housing Arrangements
Housing represents one of the largest expenses for most households, and the costs can be a challenge for young adults looking to strike out on their own. The survey asks respondents to describe their current living arrangements as a broad measure of household formation among young adults. In the survey, 43 percent of employees have formed a new household with their immediate family (i.e., spouse/partner), and 20 percent have formed a new household alone or with a roommate. The remaining 37 percent of employees reside with their parents or extended families.
From a financial standpoint, 49 percent of employees are responsible for paying their full mortgage or rent, 20 percent contribute to their mortgage or rent, and 29 percent report that they do not make any mortgage or rent payments at all.
Related Research on Self-Sufficiency
Although the literature provides some variation regarding the impact endured by workers entering the job market during a downturn, there is agreement that these workers experience negative impacts for at least five to 10 years. For example, Oreopoulos, von Wachter, and Heisz (2012) found that the cost of recessions for new graduates is substantial and unequal. Such graduates suffer persistent earning declines lasting 10 years. These workers start at lower pay and then partly recover through a gradual process of mobility toward better firms. They find that more advantaged graduates suffer less from graduating in recessions because they switch to better firms quickly, while earnings of less advantaged graduates can be permanently affected by a cyclical downgrading.As a result, college graduates with the lowest predicted annual earnings are most affected by higher initial unemployment conditions and experience permanent earnings losses, while those at the top experience losses that are short-lived.47
Furthermore, young people experience more income volatility than older people, and income volatility is hard to manage. Income volatility among individuals under 30 is greater than the national average of 55 percent.48
References
46. The Temporary Assistance for Needy Families (TANF) program is designed to help needy families achieve self-sufficiency. States receive block grants to design and operate programs that accomplish one of the purposes of the TANF program. See www.acf.hhs.gov/ofa/programs/tanf. Housing Choice Vouchers allow very low-income families to choose and lease or purchase safe, decent, and affordable privately owned rental housing. See http://portal.hud.gov/hudportal/HUD?src=/program_offices/public_indian_housing/programs/hcv/about. Return to text
47. Philip Oreopoulos, Till von Wachter, and Andrew Heisz, "The Short- and Long-Term Career Effects of Graduating in a Recession," America Economic Journal: Applied Economics 4, no. 1 (January 2012): 1-29, http://dx.doi.org/10.1257/app.4.1.1 ![]() . Return to text
. Return to text
48. Diana Farrell and Fiona Greig, Paychecks, Paydays, and the Online Platform Economy: Big Data on Income Volatility (New York: JPMorgan Chase Institute, 2016), www.jpmorganchase.com/corporate/institute/document/jpmc-institute-volatility-2-report.pdf. Return to text


