
FEDS Notes
 Print
PrintApril 6, 2015
Deleveraging and Recent Trends in Household Debt
Ivan Vidangos1
After falling for almost five years, household debt (measured in dollars) has risen in each of the last seven quarters, as the primary forces exerting downward pressure on household debt in previous years (mortgage charge-offs and negative net mortgage originations) have waned, while consumer credit has been expanding at a robust pace. The recent growth in household debt, however, has so far fallen a bit short of growth in disposable personal income (DPI); as a result, the debt-to-DPI ratio (one common measure of leverage) continued to edge down through the end of 2014.
Background
After rising in nearly every quarter of the preceding half-century (see Figure 1), household debt fell (in nominal dollars) between the second half of 2008 and early 2013 by a cumulative amount of nearly $1 trillion--a phenomenon often referred to as "household deleveraging." This deleveraging process has garnered ample attention in the media, as well as in academic and policy discussions, and has been pointed to as a factor possibly contributing to the surprisingly slow rebound in personal consumption expenditures in the early stages of the ongoing economic recovery.2 In this note, I use data from the Federal Reserve Board's Financial Accounts of the United States and Consumer Credit statistical releases to shed some light on the nature of the reduction in household debt that followed the financial crisis, and to examine the most recent trends in household debt and its main components.3
| Figure 1: Household Debt and Disposable Personal Income |
|---|
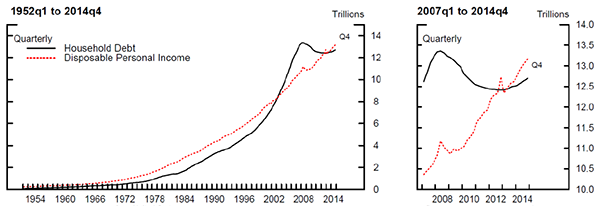 |
Source: Financial Accounts of the United States.
Definitions
In this note, "household debt" is defined as the sum of home mortgage debt and consumer credit, as reported in the Financial Accounts of the United States. Measures of household debt are reported in Table B.101 (PDF), which presents the balance sheet of households and nonprofit organizations. Home mortgage debt is reported in line 33 of the table; it includes all loans backed by owner-occupied homes, including home equity loans.4 Consumer credit is reported in line 34 of the table, and consists primarily of credit card debt, student loans, and auto loans.5 ,6
Household Debt and Leverage
The black line in Figure 1 above shows the evolution of household debt, in trillions of nominal dollars, from 1952q1 to 2014q4. (The panel to the right zooms in on the more recent subperiod 2007q1-2014q4). Nominal household debt rose in almost every quarter since the beginning of the series in 1952 until the second quarter of 2008, when it reached a peak of $13.32 trillion.7 Then, starting in the third quarter of 2008, and over the following 4-1/2 years, household debt fell (in nominal dollars) by a cumulative amount of $940 billion, until reaching a low of $12.42 trillion in the first quarter of 2013. Since then, nominal household debt has risen in every quarter (albeit relatively slowly) and it stood at $12.70 trillion in the fourth quarter of 2014--about $280 billion higher than the low reached in 2013q1.
The ratio of household debt to disposable personal income (DPI)--one common measure of household leverage--is shown in Figure 2. After rising at a very fast clip for most of the 2000s, the debt-to-DPI ratio fell sharply in the 2008-2012 period, as the decline in nominal debt seen in Figure 1 was accompanied by rising disposable personal income in most quarters of that period (DPI is shown by the dashed red line in Figure 1). The debt-to-DPI ratio fell from a peak of 1.24 at the end of 2007 to around 1.00 by the end of 2012.8 Since then, the ratio has edged down a bit more as nominal debt has continued to rise, but at a slightly slower pace than DPI (see the right panel of Figure 1). For example, in the last release of the Financial Accounts, which was published in March 2015, the debt-to-DPI ratio edged down from 0.97 to 0.96 in the fourth quarter of 2014.
| Figure 2: Household Debt relative to Disposable Personal Income |
|---|
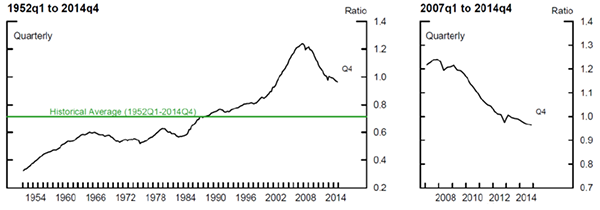 |
Source: Financial Accounts of the United States.
Components of Household Debt
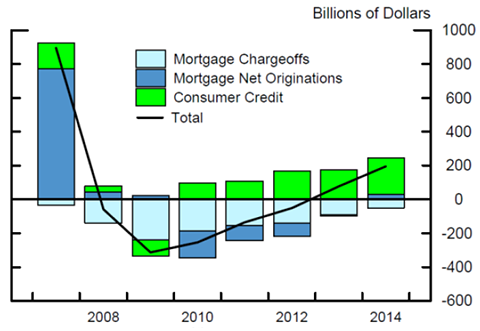
Figure 3 decomposes the annual changes in household debt since 2007 into their main components: changes in mortgage debt--which are further divided into mortgage charge-offs and net originations--and changes in consumer credit.9 As can be seen, the reduction in household debt over the 2008-2012 period was driven largely by reductions in mortgage debt (the sum of net originations, shown in dark blue, and charge-offs, shown in light blue). Net originations (basically new mortgages less pay-downs)--which had been elevated through 2007--plunged in 2008, and then turned negative in 2010-2013, as new mortgage issuance fell short of pay-downs, reflecting in part falling house prices, tighter mortgage underwriting, and rising cash sales. At the same time, as delinquencies and foreclosures rose, mortgage charge-offs surged, peaking at an average of about $60 billion per quarter in 2009 ($240 billion for the year), before they started to shrink gradually. Meanwhile, consumer credit (in green) decreased in 2009, but has risen in each of the last 5 years and currently appears to be growing at a robust pace.
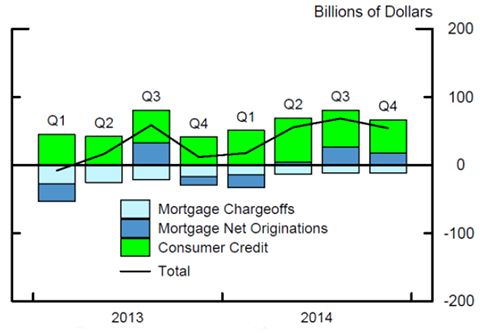
Focusing on the recent data, Figure 4 decomposes the quarterly changes in household debt, for the eight most recent quarters of available data, into their main components. Mortgage charge-offs (in light blue) continued to gradually shrink over the last eight quarters, and stood at about $12 billion in the fourth quarter of 2014. Meanwhile, net mortgage originations (in dark blue) have bounced around from quarter to quarter, but, on net, appear to be slowly transitioning to positive. And, consumer credit (in green) has experienced robust growth in each of the last eight quarters.
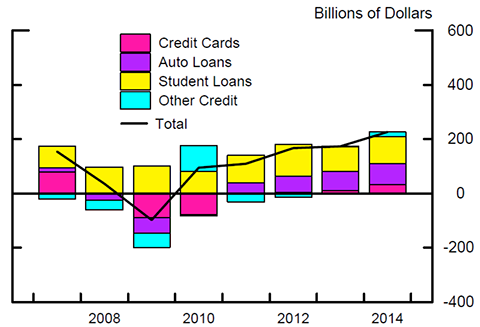
To shed more light on the robust growth experienced by consumer credit in recent years, Figure 5 breaks down the annual change in consumer credit into its main components: credit cards, auto loans, student loans, and other.10 As the figure shows, most of the increase in consumer credit since 2009 has been driven by strong growth in student loans and in auto loans, with growth in auto loans accelerating a bit over this period. Meanwhile, changes in credit card debt and other credit have been relatively minor, though growth in credit card debt stepped up a bit in 2014.
Summing up
After falling for almost five years, household debt, measured in current dollars, is back on a rising trend. The primary forces exerting downward pressure on household debt in previous years (mortgage charge-offs and negative net mortgage originations) have waned; and net originations appear to have transitioned to positive territory. Meanwhile, consumer credit has continued to expand at a robust pace, driven by strong growth in student loans and in auto loans. The recent growth in household debt, however, has so far fallen a bit short of growth in disposable personal income. As a result, the most recent data in the Financial Accounts of the United States show that the debt-to-DPI ratio has continued to edge down through the end of 2014.
References:
Dynan, Karen (2012). "Is a Household Debt Overhang Holding Back Consumption?" Brookings Papers on Economic Activity, Spring 2012, 299362.
Kennedy, James E., Maria Perozek, and Paul A. Smith (2014). "Accounting for Mortgage Charge-Offs in the Financial Accounts of the United States," FEDS Notes 2014-10-31. Board of Governors of the Federal Reserve System (U.S.). Available at http://www.federalreserve.gov/econresdata/notes/feds-notes/2014/accounting-for-mortgage-charge-offs-financial-accounts-of-the-united-states-20141031.html.
Mian, Atif, Kamalesh Rao, and Amir Sufi (2013). "Household Balance Sheets, Consumption, and the Economic Slump", Quarterly Journal of Economics, 2013, 1687-1726.
Sahm, Claudia (2014). "Deleveraging: Is it over and what was it?" FEDS Notes 2014-06-24. Board of Governors of the Federal Reserve System (U.S.). Available at http://www.federalreserve.gov/econresdata/notes/feds-notes/2014/deleveraging-is-it-over-and-what-was-it-20140624.html.
1. I thank Marco Cagetti, Geng Li, Susan McIntosh, Claudia Sahm, and Paul Smith for helpful comments and/or discussions, and Madeline McCullers for excellent assistance with the data and figures. Return to text
2. See, for example, Mian, Rao, and Sufi (2013), Dynan (2012), and the discussion in Sahm (2014). Return to text
3. The Financial Accounts of the United States are available at http://www.federalreserve.gov/releases/z1/. The Consumer Credit (G.19) statistical release is available at http://www.federalreserve.gov/releases/g19/current/default.htm. Quarterly data on household debt in the Financial Accounts of the United States begin in 1952. Return to text
4. For details on the construction of the home mortgage debt data, see the Financial Accounts Guide, available at http://www.federalreserve.gov/apps/fof/. Return to text
5. The consumer credit series in the Financial Accounts comes from the Consumer Credit (G.19) statistical release. Return to text
6. In the Financial Accounts, the term "household debt" usually refers to line 32 ("credit market instruments") of Table B.101. This item includes, in addition to home mortgage debt and consumer credit, a few small components that relate more to nonprofit organizations than to households per se, such as some commercial mortgages and certain types of municipal securities. I exclude those components in the analysis here to facilitate comparability with other analyses of household debt, which usually do not include those additional components. Including those small categories, however, would make very little difference to the results presented here. Return to text
7. All series shown in this note, and referred to in the text, are seasonally adjusted. Although levels series published in the Financial Accounts are typically not seasonally adjusted (though flows are), seasonally adjusted levels are available for download at http://www.federalreserve.gov/datadownload/Choose.aspx?rel=Z.1. Return to text
8. In the fourth quarter of 2012, the ratio dipped further down, temporarily, to 0.98 because of a one-time spike in DPI (the denominator in the ratio) in that quarter, which reflected a pull-forward of dividends and bonuses into 2012q4 in anticipation of tax increases in January 2013. Return to text
9. Mortgage charge-offs occur as banks and other entities that hold residential mortgages "charge off" certain loan balances; i.e. they remove them from their balance sheets as uncollectable, for example after borrowers default on their payments and lenders foreclose on the properties. See Kennedy, Perozek, and Smith (2014) for details on the measurement of charge-offs in the Financial Accounts. Net originations are essentially the net change in mortgage debt outstanding that is not accounted for by charge-offs. It reflects the net effect of new mortgages being originated and of existing mortgages being paid down or extinguished either through amortization or prepayment (including those associated with home sales and refinancing). Return to text
10. "Other" is other nonrevolving credit and includes loans to individuals for household, family and other personal expenditures, excluding loans secured by real estate (e.g. loans for purchases of household appliances, vacations, etc.). Return to text
Please cite as:
Vidangos, Ivan (2015). "Deleveraging and Recent Trends in Household Debt," FEDS Notes. Washington: Board of Governors of the Federal Reserve System, April 06, 2015. https://doi.org/10.17016/2380-7172.1516
Disclaimer: FEDS Notes are articles in which Board economists offer their own views and present analysis on a range of topics in economics and finance. These articles are shorter and less technically oriented than FEDS Working Papers.
