

 DDP
DDP Print
PrintIndustrial Production and Capacity Utilization - G.17
Current Release (273 KB PDF) (ASCII)
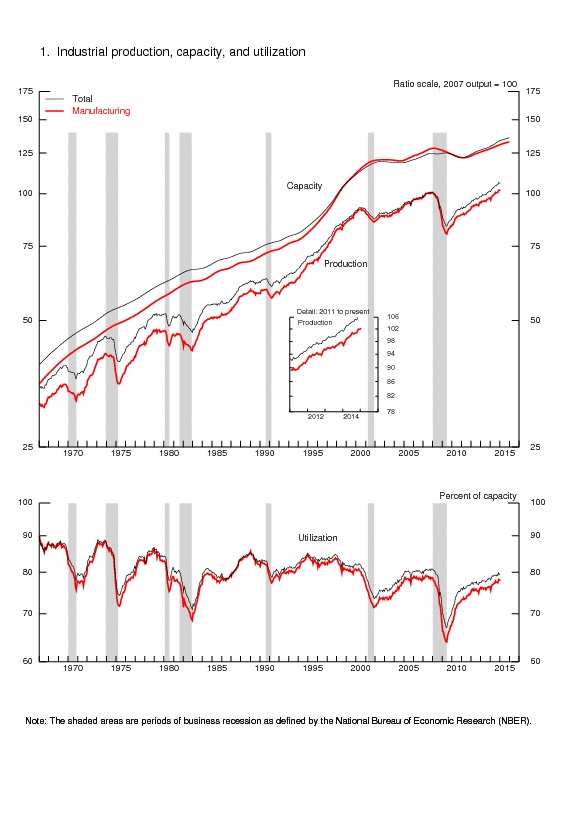
Industrial production increased 0.2 percent in January after decreasing 0.3 percent in December. The rates of change in output for September through December are all slightly lower than previously published; even so, production is estimated to have advanced at an annual rate of 4.3 percent in the fourth quarter of last year. In January, manufacturing output moved up 0.2 percent and was 5.6 percent above its year-earlier level. The index for mining decreased 1.0 percent, with the decline more than accounted for by a substantial drop in the index for oil and gas well drilling and related support activities. The output of utilities increased 2.3 percent. At 106.2 percent of its 2007 average, total industrial production in January was 4.8 percent above its level of a year earlier. Capacity utilization for the industrial sector was unchanged in January at 79.4 percent, a rate that is 0.7 percentage point below its long-run (1972–2014) average.
Industrial Production and Capacity Utilization: Summary
| Industrial production | 2007=100 | Percent change | |||||||||||
|---|---|---|---|---|---|---|---|---|---|---|---|---|---|
| 2014 | 2015 Jan.[p] |
2014 | 2015 Jan.[p] |
Jan. '14 to Jan. '15 |
|||||||||
| Aug.[r] | Sept.[r] | Oct.[r] | Nov.[r] | Dec.[r] | Aug.[r] | Sept.[r] | Oct.[r] | Nov.[r] | Dec.[r] | ||||
| Total index | 104.5 | 105.2 | 105.1 | 106.3 | 106.0 | 106.2 | .0 | .7 | -.1 | 1.1 | -.3 | .2 | 4.8 |
| Previous estimates | 104.4 | 105.3 | 105.3 | 106.6 | 106.5 | -.1 | .9 | .0 | 1.3 | -.1 | |||
| Major market groups | |||||||||||||
| Final Products | 100.1 | 100.7 | 100.7 | 102.5 | 101.6 | 101.7 | -.7 | .6 | .0 | 1.8 | -.9 | .1 | 3.8 |
| Consumer goods | 96.5 | 97.4 | 97.1 | 99.2 | 98.4 | 98.6 | -1.0 | 1.0 | -.3 | 2.2 | -.8 | .2 | 2.9 |
| Business equipment | 108.0 | 107.6 | 108.7 | 110.2 | 109.0 | 109.9 | -.2 | -.4 | 1.0 | 1.4 | -1.2 | .8 | 7.3 |
| Nonindustrial supplies | 91.7 | 92.7 | 92.9 | 93.6 | 93.2 | 93.3 | .4 | 1.1 | .2 | .8 | -.4 | .1 | 3.6 |
| Construction | 85.9 | 86.3 | 86.7 | 86.7 | 87.6 | 87.3 | .3 | .5 | .5 | .0 | 1.0 | -.3 | 6.1 |
| Materials | 112.9 | 113.7 | 113.4 | 114.3 | 114.5 | 114.8 | .4 | .7 | -.2 | .7 | .2 | .2 | 6.0 |
| Major industry groups | |||||||||||||
| Manufacturing (see note below) | 100.4 | 100.7 | 100.8 | 102.0 | 102.0 | 102.1 | -.3 | .3 | .1 | 1.2 | .0 | .2 | 5.6 |
| Previous estimates | 100.3 | 100.7 | 100.9 | 102.2 | 102.5 | -.4 | .3 | .2 | 1.3 | .3 | |||
| Mining | 132.5 | 133.8 | 132.4 | 131.9 | 134.6 | 133.3 | .9 | 1.0 | -1.1 | -.4 | 2.1 | -1.0 | 8.5 |
| Utilities | 97.0 | 101.2 | 101.6 | 105.3 | 98.0 | 100.2 | .7 | 4.3 | .4 | 3.6 | -6.9 | 2.3 | -6.6 |
| Capacity utilization | Percent of capacity | Capacity growth |
|||||||||||
|---|---|---|---|---|---|---|---|---|---|---|---|---|---|
| Average 1972- 2014 |
1988- 89 high |
1990- 91 low |
1994- 95 high |
2009 low |
2014 Jan. |
||||||||
| 2014 | 2015 Jan.[p] |
Jan. '14 to Jan. '15 |
|||||||||||
| Aug.[r] | Sept.[r] | Oct.[r] | Nov.[r] | Dec.[r] | |||||||||
| Total industry | 80.1 | 85.3 | 78.7 | 85.0 | 66.9 | 78.1 | 79.1 | 79.4 | 79.1 | 79.8 | 79.4 | 79.4 | 3.1 |
| Previous estimates | 79.0 | 79.5 | 79.2 | 80.0 | 79.7 | ||||||||
| Manufacturing (see note below) | 78.6 | 85.6 | 77.3 | 84.6 | 63.9 | 75.5 | 77.4 | 77.5 | 77.4 | 78.2 | 78.0 | 78.1 | 2.1 |
| Previous estimates | 77.3 | 77.4 | 77.5 | 78.4 | 78.4 | ||||||||
| Mining | 87.3 | 86.3 | 83.8 | 88.5 | 78.8 | 87.9 | 90.0 | 90.2 | 88.5 | 87.5 | 88.5 | 87.5 | 9.0 |
| Utilities | 85.9 | 92.9 | 84.3 | 93.3 | 78.5 | 84.5 | 76.0 | 79.1 | 79.4 | 82.2 | 76.4 | 78.2 | 1.0 |
| Stage-of-process groups | |||||||||||||
| Crude | 86.3 | 87.7 | 84.4 | 89.6 | 76.8 | 86.0 | 87.7 | 87.9 | 86.6 | 85.8 | 86.5 | 85.7 | 7.2 |
| Primary and semifinished | 80.8 | 86.5 | 77.9 | 87.7 | 64.2 | 77.4 | 77.1 | 77.8 | 77.7 | 78.6 | 77.5 | 77.9 | 2.0 |
| Finished | 77.1 | 83.4 | 77.4 | 80.6 | 66.8 | 75.1 | 77.1 | 77.1 | 77.1 | 78.3 | 78.1 | 78.1 | 2.2 |
Market Groups
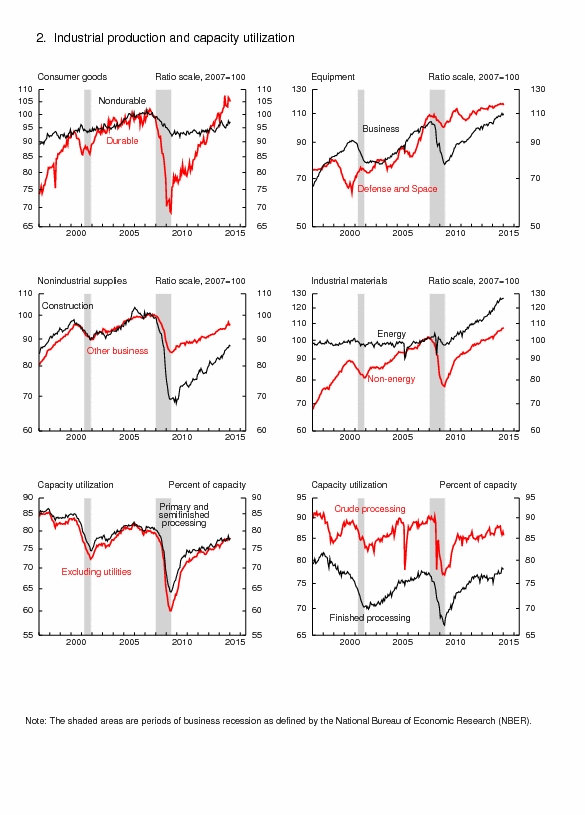
Among the major market groups, the indexes for consumer goods, business equipment, business supplies, and materials all registered gains in January, while losses were recorded by construction supplies and by defense and space equipment. The index for consumer goods moved up 0.2 percent as a result of a gain of 2.3 percent for consumer energy products; the output of durable consumer goods decreased 1.0 percent, and the production of non-energy nondurables was unchanged. The output of business equipment increased 0.8 percent, with increases of about 1 percent in the indexes for information processing equipment and for industrial and other equipment. The index for materials rose 0.2 percent, with broad-based gains among durable and nondurable materials partly offset by a small decrease in the output of energy materials.
Industry Groups
Manufacturing output rose 0.2 percent in January, as the production of durable goods advanced 0.4 percent and the production of nondurable goods was unchanged. Gains were posted by all major durable goods industries except motor vehicles and parts, aerospace and miscellaneous transportation equipment, and furniture and related products. Increases of more than 1.0 percent were recorded in the production of primary metals and of computer and electronic products. Among the major nondurable goods industries, gains in the indexes for apparel and leather, for chemicals, and for plastics and rubber products offset losses elsewhere. The production of other manufacturing industries (publishing and logging) moved down 0.4 percent.
The capacity utilization rate for manufacturing increased in January to 78.1 percent, a rate 0.5 percentage point below its long-run average. The operating rate for durable goods manufacturing rose 0.1 percentage point, and the operating rate for nondurable goods manufacturing moved down by the same amount. Utilization for other manufacturing (publishing and logging) decreased 0.2 percentage point. The operating rate for mines dropped 1.0 percentage point to 87.5 percent, while capacity utilization for utilities increased 1.8 percentage points to 78.2 percent.
Note: Preliminary Estimates of Industrial CapacityThe data in this release include preliminary estimates of industrial capacity for 2015. Measured fourth quarter to fourth quarter, total industrial capacity is projected to rise 1.8 percent this year after having increased 3.1 percent in 2014. Manufacturing capacity is expected to advance 1.7 percent in 2015 after having gained 2.2 percent in 2014. Capacity at mines is estimated to expand 3.3 percent in 2015 after having jumped 9.2 percent in 2014. Capacity for electric and natural gas utilities is projected to edge up 0.3 percent this year after having increased 1.0 percent last year. The estimates of industrial capacity for 2015 and earlier years will be updated with the annual revision to industrial production, capacity, and capacity utilization, which is expected to be published in the second quarter of this year.
