

 DDP
DDP Print
PrintIndustrial Production and Capacity Utilization - G.17
Annual Revision (400 KB PDF) (ASCII)
The Federal Reserve has revised its index of industrial production (IP) and the related measures of capacity and capacity utilization.[1] The annual revision for 2014 was more limited than in recent years because the source data required to extend the annual benchmark indexes of production into 2012 were mostly unavailable. Consequently, the IP indexes published with this revision are very little changed from previous estimates. Measured from fourth quarter to fourth quarter, total IP is now reported to have increased about 3 1/3 percent in each year from 2011 to 2013. Relative to the rates of change for total IP published earlier, the new rates are 1/2 percentage point higher in 2012 and little changed in any other year. Total IP still shows a peak-to-trough decline of about 17 percent for the most recent recession, and it still returned to its pre-recession peak in the fourth quarter of 2013.
As noted above, much of the new data that are typically incorporated in the annual benchmarks for IP were unavailable for this revision. In particular, at the time of publication, the U.S. Census Bureau had not issued detailed results of the 2012 Census of Manufactures. Some new data were available, however. The benchmark production indexes for publishing were updated from newly available data for 2012 from the Census Bureau's Service Annual Survey. The revised IP indexes also incorporated annual data from the U.S. Geological Survey (USGS) regarding metallic and nonmetallic minerals (except fuels) for 2013. The monthly estimates of production were updated to incorporate late-arriving or revised monthly or quarterly indicator data (either outputs from or inputs to production), and they also reflect recalculations of seasonal factors. In addition, new high-frequency indicators were incorporated for a few production indexes.
Capacity utilization rates for recent years were revised down slightly. Relative to earlier estimates, capacity utilization for total industry is about 1/4 percentage point lower in the fourth quarter of each year from 2010 to 2013.
The revised estimates of capacity and capacity utilization incorporated data from the Census Bureau's Quarterly Survey of Plant Capacity Utilization (QSPC) for the fourth quarter of 2013, which covered the manufacturing sector, along with new data on capacity from the USGS, the U.S. Department of Energy, and other organizations, primarily for the energy and mining sectors. Typically, the estimates of capacity and capacity utilization would incorporate an additional year of data on capital spending by industry from the U.S. Census Bureau, but data for 2012 were not available at the time of publication.
RESULTS OF THE REVISION
The tables show the summary statistics for the annual revision. Tables 1A and 1B present the monthly, quarterly, and annual average index levels for total IP and for total capacity and capacity utilization for January 1984 through February 2014, along with the percent changes in total IP. Tables 2 through 4 show the revised rates of change in IP from 2009 through 2013 for market groups, industry groups, special aggregates, and selected detail. Table 5 presents the revised rates of change in capacity by industry groups for the 2010--14 period. Tables 2 through 5 also show the differences between the revised and previous estimates of the rates of change. Table 6 contains the revised capacity utilization rates for the fourth quarters of 2010 through 2013 and the differences between the revised and previous estimates. Table 7 reports revised semiannual rates of change for IP for 2009 through 2013. Table 8 contains revised capacity utilization rates for the second and fourth quarters of 2009 through 2013. Tables 9A, 9B, 10A, 10B, 11A, and 11B report the revised production, capacity, and utilization measures for manufacturing, total industry excluding selected high-technology industries, and manufacturing excluding selected high-technology industries. Table 12 displays the annual proportions in IP by market and industry groups for 2006 through 2013. Table 13 reports revised IP indexes for the major market and industry groups for the previous six months and reports revised capacity utilization rates for the same period.
Industrial Production
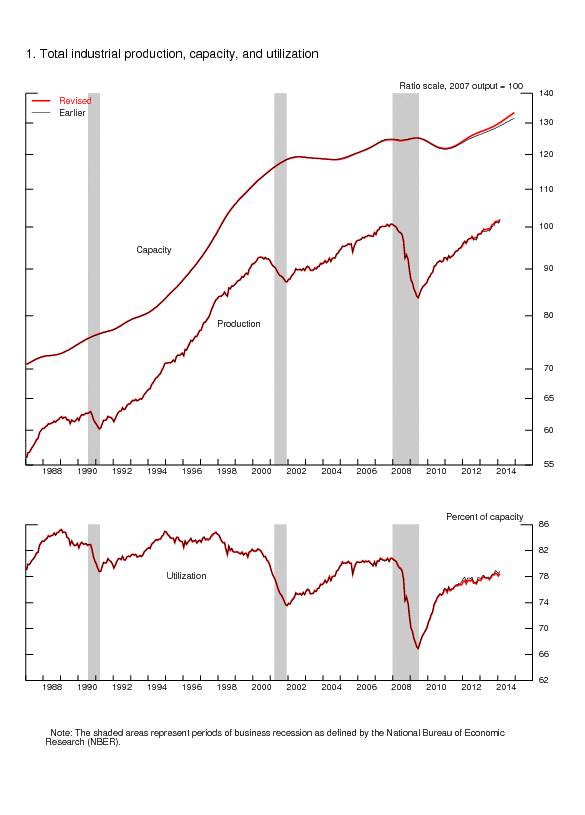
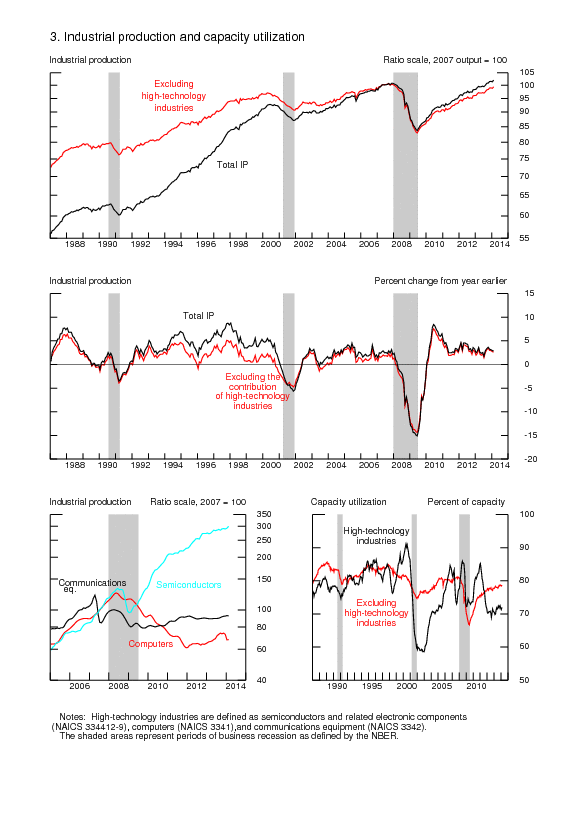
Revisions to the changes in total IP in recent years are small, and the general contour of total IP in recent years is unchanged from previous estimates (figure 1 and table 2).[2] Total IP declined sharply in 2009, rebounded strongly in 2010, and recorded more moderate gains in each year from 2011 to 2013. The upward revision to the increase in output in 2012 resulted almost entirely from higher estimates for high-technology industries (computers and peripheral equipment, communications equipment, and semiconductors and related electronic components). Excluding high-technology industries, total IP is essentially unrevised from 2009 to 2013 (table 3).
Production by Industry Group
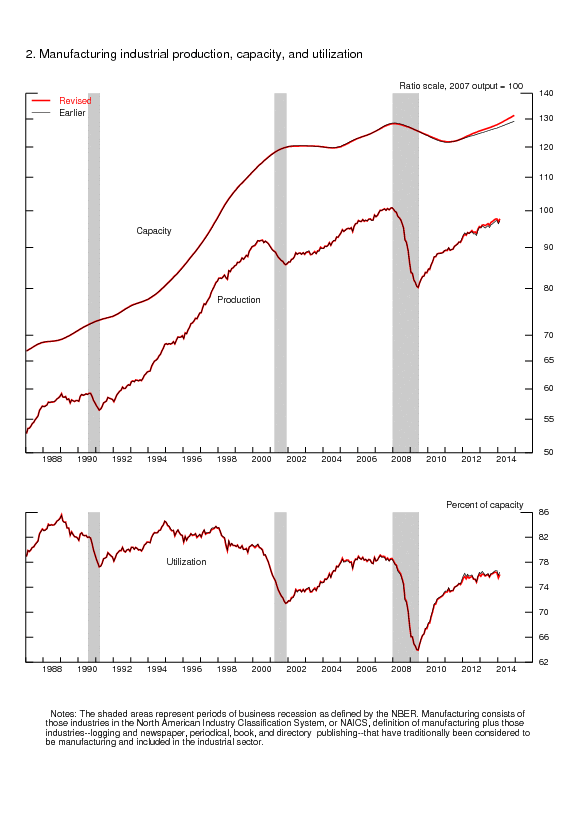
From June 2009, the trough of the recent recession, to February 2014, manufacturing production rose 21.8 percent, but it was still 3.0 percent below its pre-recession peak.[3] The gain in 2012 is now 0.6 percentage point higher than previously reported, primarily because of stronger output in high-technology industries. Excluding high-technology industries, the rates of change of manufacturing output are nearly unchanged from those previously reported (table 3).
After having advanced 12.2 percent in 2010, the output of durable goods industries increased at about half that rate in each year from 2011 to 2013 (table 2). The gain in 2012 is now about 3/4 percentage point stronger than previously reported, while the increase in 2013 is about 1/4 percentage point larger; the rate of change in 2011, by contrast, is about 1/4 percentage point lower than previously reported.
Although overall production for durables has surpassed its pre-recession level, the recovery has not been uniform across its major components. By February 2014, the indexes for machinery, for computer and electronic products, for transportation equipment, and for miscellaneous manufacturing had all rebounded to above their late-2007 levels. In contrast, the latest readings for the indexes for wood products, for nonmetallic mineral products, and for furniture and related products were each more than 20 percent below their previous peaks.
After having increased 26.7 percent in 2010, the output of high-technology industries continued to move up from 2011 to 2013, albeit at a slower pace (table 3). Relative to previous estimates, the increase in high-technology output in 2012 is now substantially larger. This upward revision arose from production of semiconductors, which is stronger than previously reported. In particular, a more rapid advance in the production of microprocessors, which reflected greater improvements in chip quality than previously estimated, accounts for the majority of the higher output (discussed under technical notes).
The production of nondurable manufacturing industries expanded modestly in each year since 2010. Rates of change in nondurable output are similar to the previous estimates. By February 2014, the output of nondurable goods industries remained 8 percent below its pre-recession peak; among its major industry groups, only the output of food was higher than its level in late 2007.
The output index for industries not in the scope of manufacturing under the North American Industry Classification System (NAICS)---that is, logging and publishing---fell in every year from 2009 to 2013. The decrease in 2012 is now somewhat less sharp than previously reported as a result of new benchmark data from the Service Annual Survey.
The production indexes for mining and utilities are little changed from those previously reported. Strong increases in oil and natural gas extraction have boosted mining output in each of the last four years. Rates of change in the output of utilities are very similar to previous reports.
Production by Market Group
The production index for final products and nonindustrial supplies rose about 3 3/4 percent in 2010, 2 1/4 percent in 2011, 2 3/4 percent in 2012, and 3 1/4 percent in 2013 (table 2). Gains in recent years are little changed from previous estimates. By February 2014, the index had recovered about 13 1/2 percentage points of its 17 percent loss from the end of 2007 to mid-2009.
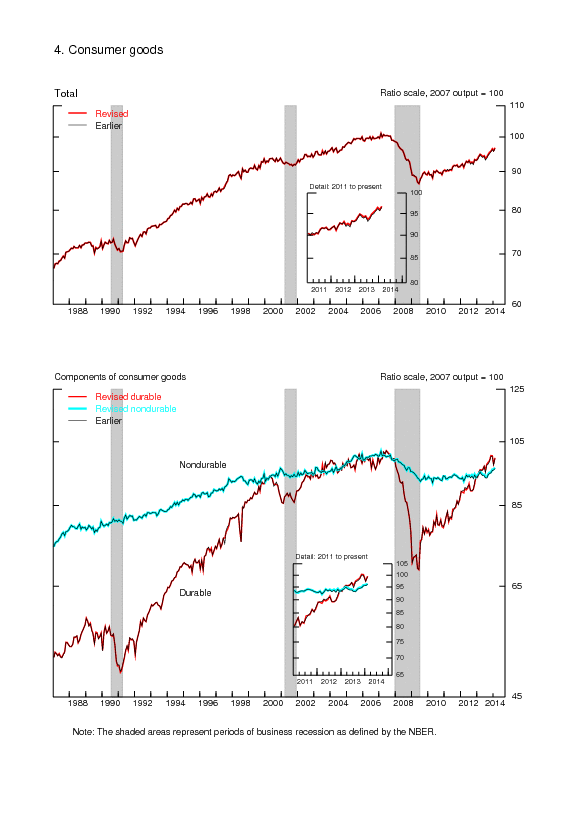
The index for consumer goods is little changed from its previous estimate. The production of consumer goods increased only 0.3 percent in 2010, strengthened somewhat in 2011 and 2012, and then rose about 3 percent in 2013. Despite these gains, which were supported by robust increases in the output of automotive products, the level of the index in February 2014 remained about 2 1/4 percent below its pre-recession peak.
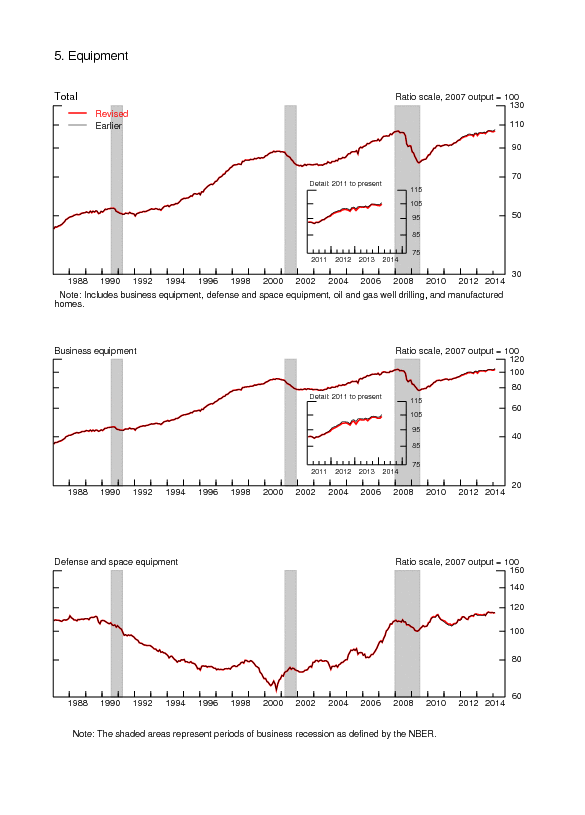
The index for business equipment has risen substantially since the 2009 trough, with a sharp rebound in 2010 followed by additional, but smaller, increases. With these gains, the output of business equipment has now fully retraced its recession-era decline. Among the three major components of business equipment, only the output of information processing and related equipment remains below its December 2007 level, albeit only slightly. Relative to previous estimates, the index for business equipment is little changed.
The production of defense and space equipment increased robustly in 2010, declined somewhat in 2011, and then jumped in 2012 before increasing moderately in 2013. The index is little changed by this revision.
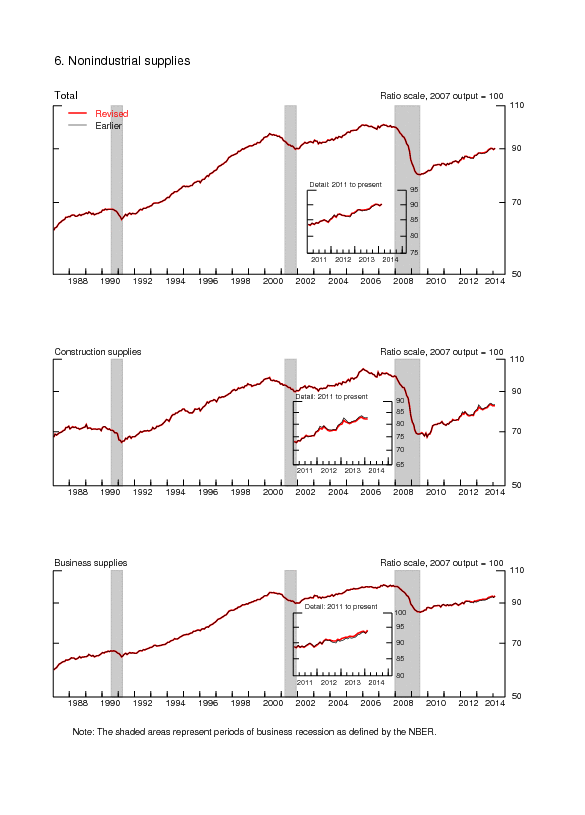
The index for construction supplies has advanced briskly in recent years; following a jump in output in 2010, production has expanded between 2 1/2 and 5 percent in each year from 2011 to 2013. Notwithstanding these gains, the index in February 2014 had recovered less than half of its recession-period decline of 33 percent. Compared with the index for construction supplies, the index for business supplies declined less steeply during the recession and rebounded less sharply during the recovery, and its most recent reading was about 6 percent below its pre-recession peak.
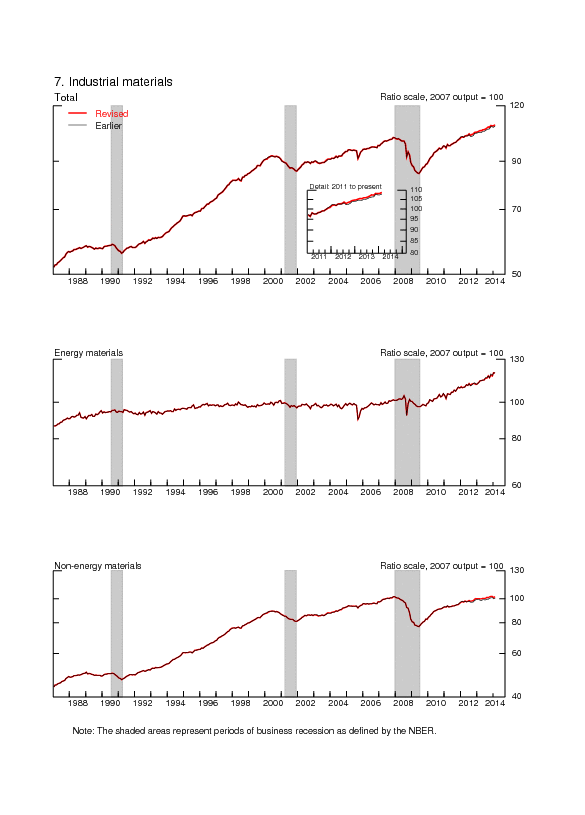
The output of materials advanced 9 1/2 percent in 2010 and then increased, on average, 3 3/4 percent per year for the next three years. Relative to previous estimates, the gain in 2012 is now larger, while the increase in 2011 is somewhat smaller. As of February 2014, the level of the index for materials was about 7 percent higher than its pre-recession peak.
Within materials, the recovery from the recession has been uneven. As of February 2014, the indexes for both durable goods materials and energy materials were above their pre-recession levels. All of the categories of durable goods materials increased substantially from 2010 to 2013. The gain in the output of durable materials in 2012 is now stronger than previously reported as a result of a faster increase in the production of equipment parts.
By contrast, the output of nondurable materials has recovered less than half of its 20 percent decline during the recession. The index for nondurable materials advanced in 2010 and moved down in 2011 before increasing in 2012 and being nearly unchanged in 2013.
The output of energy materials advanced briskly in 2010 and 2011, increased at a slower pace in 2012, and then resumed more rapid gains in 2013. Rates of change in the production of energy materials are nearly unchanged from previous estimates.
Capacity
Total industrial capacity contracted in 2010 before increasing in 2011, 2012, and 2013 (table 5).[4] Capacity is expected to expand at a slightly faster rate in 2014. Relative to previous estimates, the gain in total industrial capacity in 2012 is somewhat larger.
After having decreased each year from 2008 to 2010, manufacturing capacity rose slightly in 2011 and then increased around 2 percent in 2012 and in 2013; it is expected to advance at a somewhat faster pace in 2014. Relative to earlier estimates, the gains in 2012 and 2013 are larger. The revised level of capacity in the fourth quarter of 2013 is 0.9 percent higher than the earlier estimate. Capacity in durable manufacturing industries declined from 2008 to 2010 and then advanced solidly in each year from 2011 to 2013; capacity is expected to post another strong gain in 2014. The rate of change in durable manufacturing capacity is now reported to have increased at a faster rate in both 2012 and 2013, with the capacity index for computer and electronic products being the largest contributor in 2012 and higher capacity in fabricated metal products being the largest contributor to the revision in 2013. Capacity in high-technology industries advanced briskly in each year from 2010 to 2012, moved up at a slightly slower pace in 2013, and is expected to increase again in 2014. The gain in 2012 is now substantially stronger than previously reported. For nondurable manufacturing, capacity contracted in each year from 2008 to 2011 before increasing modestly in 2012 and 2013; the pace of capacity gains for nondurables is expected to pick up in 2014. Relative to the previous estimate, the rate of change for nondurables manufacturing capacity is now estimated to have increased somewhat less in 2012.
Capacity at mines was flat in 2010 but increased sharply in 2011, 2012, and 2013; further gains are expected in 2014. Relative to previous estimates, the rates of change in 2010 and 2011 are now larger. Capacity at utilities increased modestly in each year from 2010 to 2013, with another increase expected in 2014; the gains from 2011 to 2013 are now reported to be smaller in each year than previously estimated.
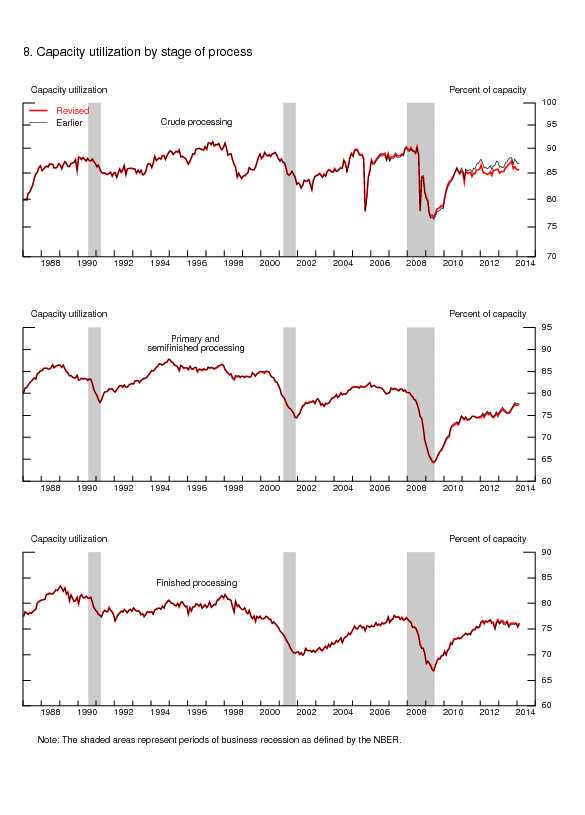
By stage of processing, capacity at the crude stage declined in 2010 and then recorded robust gains of 3 percent or more in 2011, 2012, and 2013; capacity is expected to increase further in 2014. Relative to previous estimates, the rates of change for capacity at the crude stage are now reported to be higher in 2010, 2011, and 2012, but lower in 2013. Capacity at the primary and semifinished stages declined in 2010 and then increased in each year from 2011 to 2013; another expansion is expected in 2014. Relative to previous estimates, the gains in capacity at the primary and semifinished stages are now reported to have been somewhat smaller in 2011 but considerably stronger in 2012. For finished goods industries, capacity declined in 2010, edged up in 2011, and then increased more briskly in 2012 and 2013. Capacity for these producers is expected to increase in 2014. The rates of change for capacity in the finished goods stage are smaller than previously reported for 2011 but larger for 2013.
Capacity Utilization
Capacity utilization for total industry has risen in each year from 2010 to 2013.[5] In 2013, capacity utilization for total industry was 78.4 percent, a rate 1.7 percentage points below its long-run (1972--2013) average of 80.1 percent (table 6). Compared with earlier estimates, capacity utilization for total industry is now reported to have been slightly lower in each year from 2010 to 2013.
The capacity utilization rate for manufacturing jumped in 2010 and then increased at a slower rate in each year from 2011 to 2013. Relative to previous reports, larger increases in manufacturing capacity slightly more than offset higher rates of change in production in 2012 and 2013; consequently, the factory operating rates are now estimated to have been a bit lower in those years. At 76.4 percent, the rate for 2013 is 0.3 percentage point below its earlier level and 2.3 percentage points below its long-run average. The utilization rate for durable manufacturing has risen in each year from 2010 to 2013, when it reached 76.3 percent, but rates in 2012 and 2013 are now lower than reported earlier. The utilization rate for nondurable manufacturing has increased from 71.8 percent in 2009 to 77.8 percent in 2013. The rates for nondurables in 2010 and 2011 are now reported to have been lower than previously estimated, while rates for 2012 and 2013 are slightly higher than previously estimated.
As of the fourth quarter of 2013, all nondurable manufacturing industry groups were still operating at rates below their industry-specific long-run averages (table 6), with the rates for textile and product mills and for printing and support well below their long-run averages. Among durable goods manufacturers, 5 of the 11 industry groups in table 6 were operating at utilization rates above their long-run averages: fabricated metal products; machinery; electrical equipment, appliances, and components; motor vehicles and parts; and aerospace and miscellaneous transportation equipment. Only the nonmetallic mineral products industry was operating at a rate far below its long-run average.
Capacity utilization in mining advanced strongly in 2010 and continued to increase in 2011; utilization fell back slightly in 2012 but increased again in 2013. Utilization rates at mines are lower than previously reported in each year from 2010 to 2013. Nevertheless, the utilization rate for mining in 2013, at 87.7 percent, was 0.4 percentage point above its long-run average. The operating rates for utilities are now higher than previously reported for 2012 and 2013; at 81.3 percent in 2013, however, the utilization rate was 4.8 percentage points below its long-run average.
TECHNICAL ASPECTS OF THE REVISION
The annual revisions to the indexes of IP and capacity were limited in scope this year. Much of the comprehensive data that is newly incorporated in a typical annual revision was not yet available at the time of publication. However, this annual revision did incorporate updated measures of employment and production-worker hours from the Current Employment Statistics monthly survey conducted by the Bureau of Labor Statistics (BLS). In addition, the benchmark indexes for logging and publishing were updated through 2012 based on data from the U.S. Forest Service and the U.S. Census Bureau.
The revised IP indexes include information from the QSPC for 2013 and from other industry reports. The indexes also incorporate revised monthly and quarterly source data on production, shipments, and inventories.
Annual Benchmark Output Indexes
The annual benchmark output indexes for IP are defined as nominal gross output divided by a price index. These benchmark indexes are constructed for each six-digit industry defined by the NAICS. As noted earlier, much of the underlying source data required to construct the benchmark output indexes for 2012 is not yet available. For a few industries---including semiconductors---the Federal Reserve constructs benchmark indexes at a more detailed level than the six-digit NAICS, and 2012 data do exist for some of these industries.
Changes to annual benchmarks for semiconductors
The IP indexes for semiconductors (NAICS 334413) use monthly shipments data from the Semiconductor Industry Association (SIA) deflated by a price index. This revision updates the methods for calculating the annual benchmark price index used in the output index for microprocessors (MPUs) and extends the price index one year further to 2012. The updated methods also affect the price index for metal-oxide semiconductor (MOS) logic chips excluding MPUs.
As in the construction of other price indexes used in the G.17 statistics, the price index for MPUs is composed of an annual benchmark deflator combined with a monthly price indicator. In the 2013 annual revision, the Federal Reserve introduced new methods using hedonic regressions to construct the annual benchmark price deflator.[6] Hedonic price indexes use data on product characteristics to remove the effect of changing product quality from prices.
This revision updated the previous methods in a few ways. First, this revision incorporated additional observations in the sample used in the 2013 analysis. Second, the increased sample size enabled a more flexible specification of the hedonic model used in the analysis. Third, the updated methods controlled for heat management properties of different MPUs. Finally, some controls were eliminated from the specification and the sample was adjusted to improve consistency over time. The current revision applied the updated methods only to 2012.
After having declined at an average rate of 37 percent per year for the 2007--11 period, the price index for MPUs is estimated to have declined 30 percent in 2012 using the updated methods. Previously, the price deflator for MPUs in 2012 was estimated to have declined about 4 percent. It is expected that the new methods will be introduced to the 2007--11 period in a future annual revision.
The price deflator for the IP index for MOS logic excluding MPUs is a geometric mean of a Fisher price index constructed from monthly SIA data for chips in this category, the price index for MPUs, and the price index for MOS memory chips. Because the changes to the price index for MPUs imply more rapid price declines for 2012, the output index for MOS logic excluding MPUs, which relies on this price deflator, registers stronger gains.
Changes to Individual Production Indexes
Several production indicators were affected by methodological changes in this revision.
Business Furniture
Monthly data on the overall value of shipments for office furniture from the Business and Institutional Furniture Manufacturers Association (BIFMA) have been instituted as the primary source data for the index for business furniture (NAICS 3372) for the period from 1972 forward. Previously, the IP index for business furniture was based on monthly production-worker hour data from the BLS for 1997 forward; before that, the monthly production indicator was data for electric power use collected by the Federal Reserve. As with the other production indexes that are based on manufacturers' shipments, the BIFMA shipments data were adjusted by a procedure that estimates changes in inventories to obtain a measure of production. The procedure was described in detail in the Federal Reserve Bulletin article that summarized the 2004 annual revision.[7]
Computers
This revision introduced new source data for each of the component indexes for computer and peripheral equipment (NAICS 3341). For the period beginning in 2012, monthly data from the BLS on production-worker hours are now used as high-frequency indicators for the following indexes: business desktops, consumer desktops, business mobiles, consumer mobiles, business storage and terminals, consumer storage and terminals, business printers and peripherals, and consumer printers and peripherals. Previously, these indexes were based on quarterly data on domestic absorption for computers from the International Data Corporation (IDC) and on information from the discontinued (as of mid-2011) Current Industrial Report (CIR) program from the U.S. Census Bureau.
The monthly data on production-worker hours are only collected on an industry basis and do not contain separate labor input information for business and consumer computers. The business and consumer market splits required for the IP indexes are estimated from IDC data on the relative shares of domestic absorption for these markets. The Federal Reserve will continue to receive these data from IDC once per year, with quarterly frequency detail covering the four quarters of the previous year. These data will be used in future annual revisions to retroactively construct the business and consumer shares and apply them to the historical data on production-worker hours for the same time frame. For the period when the business and consumer shares are not yet available from IDC, the shares will be projected using time-series methods.
With this revision, for the period beginning in 2012, the IP indexes for x86 servers and non-x86 servers are based on measures derived from the QSPC augmented by estimates of the service flow from the capital stock at producers of computers and peripherals. The capital services measures were constructed from historical investment data and a survey of investment plans. In recent years, the augmented QSPC utilization rates, a proxy for capital utilization, have tracked detrended measures of IP for servers. Previously, the IP indexes used data from IDC on U.S. domestic absorption of servers.
Semiconductors
The IP indexes for each of the individual components of semiconductors (NAICS 334413) are derived from data on measures of nominal U.S. output deflated by a price index. This revision includes updates to the annual benchmark indexes (discussed above) and also to the monthly production indexes for the different types of memory semiconductors: flash memory, dynamic random-access memory (DRAM), and other metal-oxide semiconductors (MOS) memory. Specifically, the updates to memory chips include enhancements to (1) the share of global semiconductor sales for each product type that originated from U.S. factories and (2) the associated price indexes.
Domestically produced shares of global shipments
The data on nominal shipments come from a SIA monthly report that provides details on global sales for many types of chips. For each type of chip, the SIA shipments figures are multiplied by an estimate of the share of global sales that is produced domestically. These shares are derived from a global census, published by IHS iSuppli, of semiconductor factories. The domestic share of global unit capacity (in semiconductor wafers) for each product type is used as a proxy for the domestic share of the value of shipments. Updated capacity estimates from IHS iSuppli along with new information learned from discussions with iSuppli analysts, led to an upwardly revised estimate for the domestic production shares for memory chips and to higher domestic output in 2012 and 2013.
Price index for memory chips
This revision updated the price indexes for memory chips with new data from the Bank of Japan (BOJ). Historically, quarterly price indexes for memory chips have been based on quarterly data on prices and global sales by detailed memory type using a matched-model, chain-weighted aggregation. Less-detailed monthly information from SIA had been used to interpolate a monthly price index that was constrained to line up with the quarterly indexes. With this revision, the monthly interpolation is based on the price index for MOS memory chips published by the BOJ. In addition, this revision used the BOJ price index as a primary indicator of memory prices for months after the last available date of the quarterly price data: the second quarter of 2013 for DRAM and flash memory, and the second quarter of 2009 for other memory.
Electric Lighting
The IP index for electric lighting equipment (NAICS 3351) has been updated with this revision. Previously, output was inferred from monthly production-worker hour data from the BLS. This revision adopted quarterly data back to 2002 from the National Electrical Manufacturers Association's (NEMA) Lighting Systems Index. The NEMA index covers U.S. shipments of a variety of lighting products, including lamps, luminaires, ballasts, and emergency lighting.
Adjustments for Natural Disasters and Extreme Weather
With this annual revision, the production indexes continue to incorporate model-based estimates of the effects on output of natural disasters or extreme weather events. These estimates are derived from industry-specific measures of economic activity in the most affected areas.[8] Since the 2013 annual revision, the natural disasters and extreme weather events that required special estimates of the effect on production include the tornadoes that hit Oklahoma in July 2013 and the extreme cold weather and snowstorms that affected much of the country in January and February 2014.
Weights for Aggregation
The IP index is a Fisher index. The weights for manufacturing industries are derived from value-added measures from the Census of Manufactures and the Annual Survey of Manufactures, both from the U.S. Census Bureau. The Federal Reserve derives estimates of value added for the electric and gas utility industries from annual revenue and expense data issued by other organizations. As in the 2013 annual revision, the weights for aggregation expressed as value-added per unit were estimated with data on producer prices for the period after 2011. Table 12 shows the annual value-added proportions in the IP index from 2006 through 2013.
Revised Quarterly and Monthly Data
This revision incorporated product data that became available or were revised after the regular six-month reporting window for monthly IP was closed. These data were released with too great of a lag to be included with monthly IP estimates but were available for inclusion in the annual revision.
Revised Seasonal Factors
Seasonal factors for production-worker hours---which adjust for timing, holiday, and monthly seasonal patterns---were updated with data through January 2014. The updated factors for the physical product series, which include adjustments for holiday and workday patterns, used data through December 2013 where available.
Seasonal factors for unit motor vehicle assemblies have been updated, and projections through June 2015 are on the Board's website at www.federalreserve.gov/releases/g17/mvsf.htm. This annual revision updated the procedures for estimating seasonal factors for the months in the third quarter of the years from 1996 through 2011. Previously, the seasonal factors for cars and light trucks were based, in part, on manufacturers' initial assembly plans for the months of July, August, and September. These assembly plans reflected the summer shutdowns that allow for factory retooling to accommodate model changeovers. Prior to the mid-1990s, the summer shutdowns fluctuated between July and August, which necessitated special adjustments to the seasonal factors. Since the mid-1990s, however, automakers' summer shutdowns have been more reliably slotted for July, if they are scheduled at all, so the special adjustments based on initial assembly plans were no longer required. With this revision, the special adjustments were removed for the period beginning with 1996.
Data Availability and Publication Changes
Files containing the revised data and the text and tables from this release are available on the Board's website at www.federalreserve.gov/releases/g17, as are updated data for the annual revision and for all of the regularly issued series on industrial production, capacity, and capacity utilization. Indexes for one additional industry group are being published with this release: Nonferrous metals except foundries (NAICS 3313 and 3314).
A document with printed tables of the revised estimates of series shown in the G.17 release is available upon request to the Industrial Output Section, Mail Stop 82, Division of Research and Statistics, Board of Governors of the Federal Reserve System, Washington, DC 20551.
[1] The revision affected rates of change for IP from 1972 forward. When necessary to maintain consistency with any revisions to the data for 1972 and subsequent years, the levels of the production and capacity indexes for the years before 1972 were multiplied by a constant. However, utilization rates and the rates of change in IP for the years before 1972 were not revised.
Return to text
[2] In this section, all of the rates of change for a full year are calculated from the fourth quarter of the previous year to the fourth quarter of the reference year. Rates of change on a half-year basis are shown in table 7.
Return to text
[3] Manufacturing consists of those industries in the North American Industry Classification System definition of manufacturing, plus those industries---logging and newspaper, periodical, book, and directory publishing---that were in the manufacturing sector under the Standard Industrial Classification system.
Return to text
[4] In this section, all the rates of change for a full year are calculated from the fourth quarter of the previous year to the fourth quarter of the reference year.
Return to text
[5] Unless otherwise noted, rates of capacity utilization are reported for the fourth quarter of the reference year.
Return to text
[6] Described on the Federal Reserve's website at www.federalreserve.gov/releases/g17/MpuPriceIndex.htm.
Return to text
[7] Kimberly Bayard and Charles Gilbert (2005), ``Industrial Production and Capacity Utilization: The 2004 Annual Revision,'' Federal Reserve Bulletin, vol. 91 (Winter), pp. 9--25, www.federalreserve.gov/pubs/bulletin/2005/winter05_ip.pdf.
Return to text
[8] The methods used to make these estimates have been documented previously, most recently on the Federal Reserve's website at www.federalreserve.gov/releases/g17/g17_technical_qa.htm.
Return to text
