

 DDP
DDP Print
PrintIndustrial Production and Capacity Utilization - G.17
Annual Revision (400 KB PDF) (ASCII)
The Federal Reserve has revised its index of industrial production (IP) and the related measures of capacity and capacity utilization.[1] Measured from fourth quarter to fourth quarter, total IP is now reported to have dropped 0.3 percentage point more in 2009; its gains in both 2010 and 2011 were essentially unchanged from what was previously reported. With these minor revisions, the broad contour of total IP in recent years is similar to previous estimates. Since the trough of the last recession in June 2009, total IP has reversed about three-fourths of its peak-to-trough decline.
The revised IP indexes incorporate detailed data on factory activity for 2010 and revised data for 2009 from the U.S. Census Bureau's Annual Survey of Manufactures (ASM). In addition, data from selected editions of the Census Bureau's Current Industrial Reports (CIR) for 2010 and annual data from the U.S. Geological Survey regarding metallic and nonmetallic minerals (except fuels) for 2010 were used in the revised estimates. The monthly estimates of production were updated to incorporate late-arriving or revised monthly or quarterly indicator data (either outputs from or inputs to production), and they also reflect recalculations of seasonal factors.
Capacity utilization rates for recent years were revised down. The revisions show that the rate of capacity utilization for total industry was 0.7 percentage point lower than previously estimated in the fourth quarter of 2010 and 0.4 percentage point lower in 2011, primarily as a result of small upward revisions to estimates of industrial capacity. The capacity utilization rate for the fourth quarter of 2008 was revised down 0.3 percentage point, and the rate in the final quarter of 2009 was revised down about 0.8 percentage point.
The revised estimates of capacity and capacity utilization incorporate data from the Census Bureau's Quarterly Survey of Plant Capacity Utilization (QSPC) for the fourth quarter of 2011, which covered the manufacturing sector, along with new data on capacity in the energy and mining sectors from the U.S. Geological Survey (USGS), the U.S. Department of Energy (DOE), and other organizations, as well as data on industry capital spending from the 2010 ASM.
RESULTS OF THE REVISION
The tables show the summary statistics for the annual revision. Tables 1A and 1B present the monthly, quarterly, and annual average index levels for total IP and for total capacity and utilization for January 1982 through February 2012, along with the percentage changes in total IP. Tables 2 through 4 show the revised rates of change in IP from 2007 through 2011 for market groups, industry groups, special aggregates, and selected detail. Table 5 presents the revised rates of change in capacity by industry groups for the 2008--12 period. Tables 2 through 5 also show the differences between the revised and previous estimates of the rates of change. Table 6 contains the revised capacity utilization rates for the final quarters of 2008 through 2011 and the differences between the revised and previous estimates. Table 7 reports revised semiannual rates of change for IP for 2007 through 2011. Table 8 contains revised capacity utilization rates for the second and fourth quarters of 2007 through 2011. Tables 9A, 9B, 10A, 10B, 11A, and 11B report the revised production, capacity, and utilization series for total manufacturing, total industry excluding selected high-technology industries, and manufacturing excluding selected high-technology industries. Table 12 displays the annual proportions in IP by market and industry groups for 2004 through 2011. Table 13 reports revised IP indexes and capacity utilization rates for the major market and industry groups for the previous six months. Table 14 shows price indexes for data networking equipment.
Industrial Production
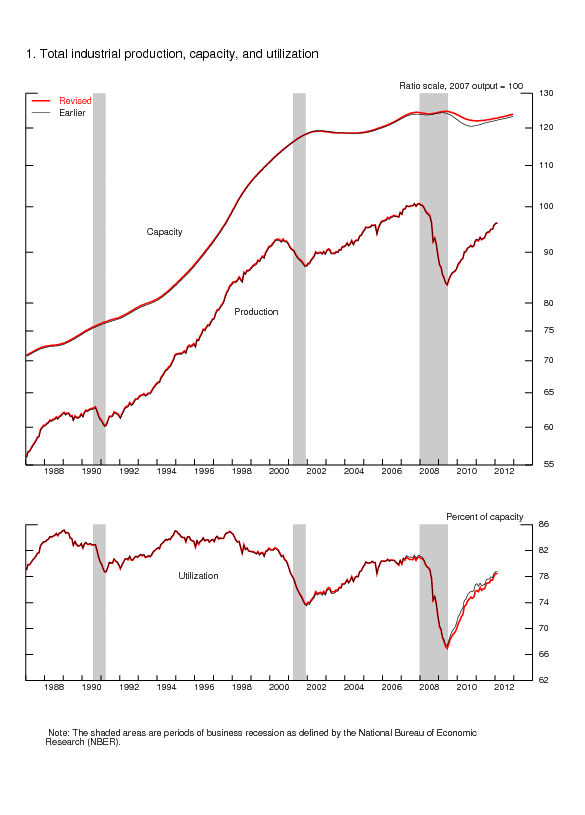
Revisions to changes in total IP in recent years were very small (tables 2 and 7). As can be seen in chart 1, the overall contour for IP in recent years was little changed: A steep decline from late 2007 to June 2009 was followed by steady gains beginning in the second half of 2009 and continuing through early 2012.[2]
Production by Industry Group
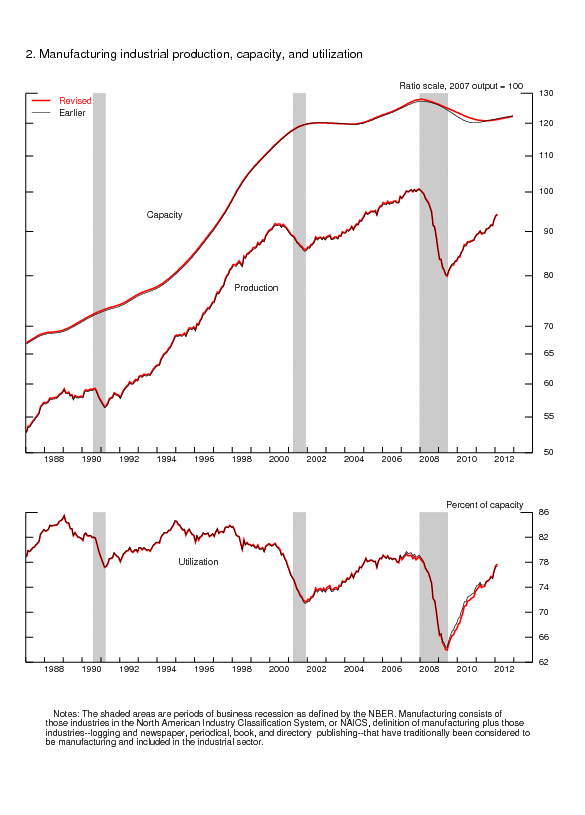
Following modest gains in 2007, manufacturing production contracted sharply in 2008 and the first half of 2009, falling by 20 percent over that period; since June 2009, manufacturing production has recovered about two-thirds of this decline.[3] The drop in 2008 was widespread, as output fell for all major manufacturing industries, and the magnitudes of these declines were little revised. The decline in manufacturing for the first half of 2009 was also broadly based and essentially unchanged from earlier estimates. Manufacturing output advanced solidly in the second half of 2009 through 2011; the gain in 2010 is now reported to have been slightly stronger than previously estimated while the rise in 2011 is about the same as previously reported.
For durable goods industries, output fell sharply in 2008 and the first half of 2009, and those declines are now reported to have been a bit steeper in both years. The production of durable goods surged in the second half of 2009 and in both 2010 and 2011; those gains are now reported to have been stronger in 2010 and slightly less strong in 2011 than previously estimated. All major categories of durables with the exception of nonmetallic mineral products increased in 2011, although for most industries, these gains are now reported to have been somewhat weaker than stated earlier.
Production in nondurable manufacturing industries was little changed in 2007 before falling markedly in 2008 and in the first half of 2009. Beginning in the second half of 2009, the output of nondurables began to increase and it has continued to advance at a moderate pace through 2011. Relative to earlier estimates, the rate of change in nondurable goods production in 2007 is little changed, while the decline for 2008 is now reported to be somewhat less steep and the decline for 2009 is now a bit larger. The increase in the output of nondurables was revised down in 2010, but it revised slightly up in 2011.
The output index for industries not in the scope of manufacturing under the North American Industry Classification System (NAICS) (that is, logging and publishing) fell each year from 2007 through 2011. The declines are now reported to have been noticeably less steep in 2008 but somewhat larger in other recent years.
In the mining sector, output advanced modestly in 2007 and retreated nearly the same amount in 2008 before falling in 2009 and expanding strongly in 2010 and 2011. The rise in mining output was revised down in 2010 but revised up in 2011.
The output of utilities advanced in 2007 before declining in 2008 and 2009, gaining in 2010, and falling in 2011. The estimates for utilities output for recent years are very similar to previous reports. The increase in the index for utilities in 2010 was revised down due entirely to a revision to natural gas utilities.
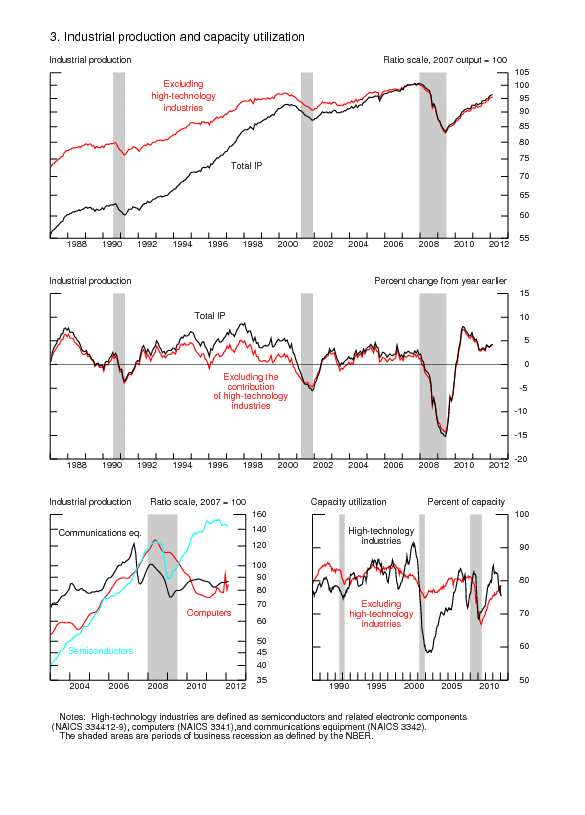
Output in high-technology industries---computers and peripheral equipment, communications equipment, and semiconductors and related electronic components---increased notably in 2007, fell somewhat in 2008, was little changed in 2009, moved up in 2010, and advanced modestly in 2011 (table 3). Relative to earlier estimates, production in the high-technology industries was lower, on net, over the 2007--11 period. Notably, output of computers and peripheral equipment was revised down substantially in 2009 and 2010 as the ASM values for computer output reflected a new, lower trajectory for the industry. Previously, the industrial production index for computers showed solid gains in 2009 and 2010, but the current estimates reflect sizable declines. The rates of change in the index for communications equipment are lower, on net, than previously reported. Revisions to the output of semiconductors were generally small. One exception was for 2010 when output is now reported to have expanded substantially more than in previous estimates.
Production by Market Group
The production index for final products and nonindustrial supplies (tables 2 and 7) posted a modest gain, on net, in 2007 and then fell markedly in 2008 and the first half of 2009 before advancing solidly in 2010 and 2011. Relative to earlier reports, the decline in 2009 is now reported to have been steeper and the gain in 2010 less strong; the increase in 2011 is slightly larger than previously stated.
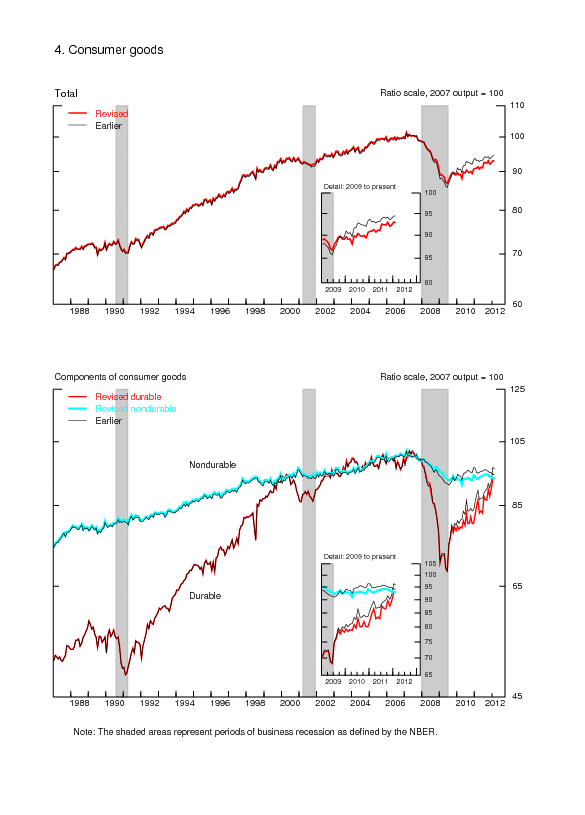
The production of consumer goods declined modestly in 2007 before falling more rapidly in 2008 and in the first half of 2009. Compared with the previous estimates, the decrease in output for 2009 as a whole was deeper, while the gain in 2010 was flatter; the increase in 2011 is now larger than previously reported. The production of durable consumer goods advanced modestly in 2007 and then dropped steeply in 2008 through the first half of 2009; output has increased consistently since the second half of 2009, with moderate gains in 2010 and a noticeable step-up in 2011. Among durable consumer goods, the index for automotive products increased in 2007 and fell sharply in 2008; gains in 2009 were followed by a moderate increase in 2010 and a surge in 2011. The output of home electronics was revised substantially in 2009 and 2010; as a result, a small gain in 2009 is now reported as a decrease, and the decline in 2010 is much steeper than previously reported.
The index for consumer nondurables declined in the period from 2007 through the first half of 2009 before edging up in the second half of 2009 and in 2010 and 2011. Compared with the previously reported index, the gain in 2010 is slower, and a small decrease in 2011 is now a small increase. The revised index for consumer nondurable non-energy goods displays a similar contour to nondurables as a whole, although production is now reported to have edged down in 2010 whereas it had previously increased. Revisions to the production index for clothing made declines steeper in 2008, 2009, and 2011 and added to gains in 2010. The production of chemical products increased in 2011 following declines in 2007 through 2010. The index for consumer energy products advanced in 2007, 2008, and 2010, with small declines in 2009 and 2011.
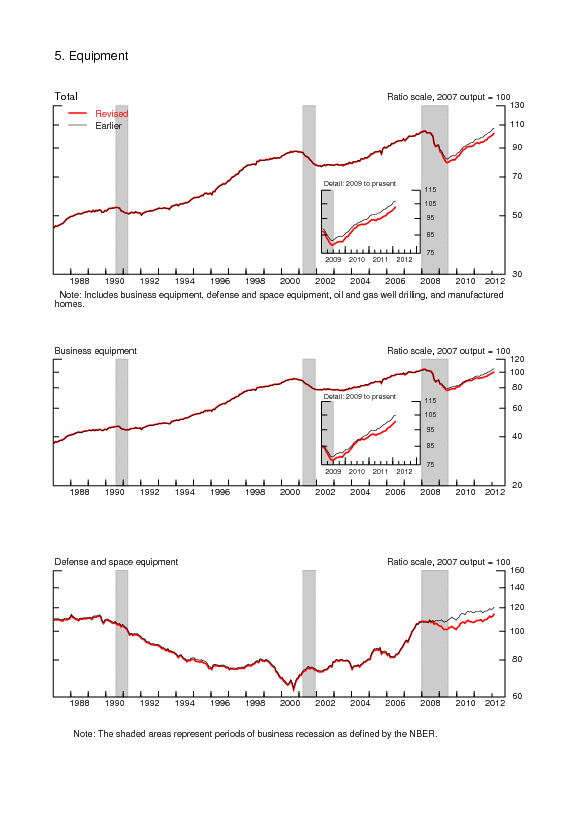
The production of business equipment rose moderately in the second half of 2009 before posting rapid gains in 2010 and 2011; these increases followed sharp declines in 2008 and in the first half of 2009. Downward revisions contributed to a steeper decline for 2009 as a whole and a smaller increase in 2011. Among its components, the production of transit equipment declined sharply in 2008 before advancing strongly in the period from 2009 to 2011. The revised output of information processing equipment expanded in 2007 and fell in 2008 and 2009 before advancing in 2010 and 2011. The index for industrial and other equipment advanced at a modest pace in 2007, declined steeply in 2008 and 2009, advanced rapidly in 2010, and continued to expand in 2011.
The production of defense and space equipment surged in 2007, declined in 2008 and 2009, and increased in 2010 and 2011; previous estimates had shown small gains in 2008 and 2009.
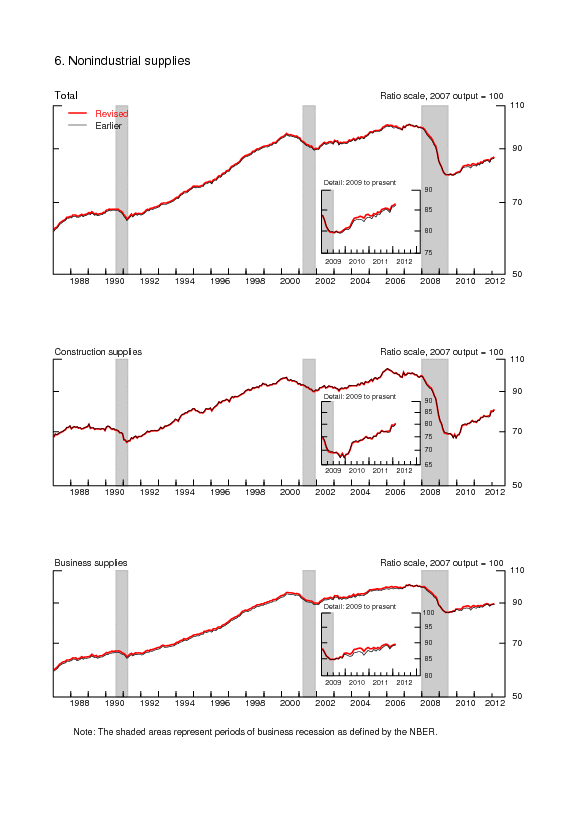
The output of construction supplies edged down in 2007 and declined steeply in 2008 and 2009 before advancing in 2010 and 2011. The index was little changed from earlier estimates. The production of business supplies edged up in 2007, fell in 2008 and 2009, and then increased moderately in 2010 and 2011. The revisions in this category were also relatively small, and the index now shows slightly larger gains in 2010 and a smaller increase in 2011 than previously reported.
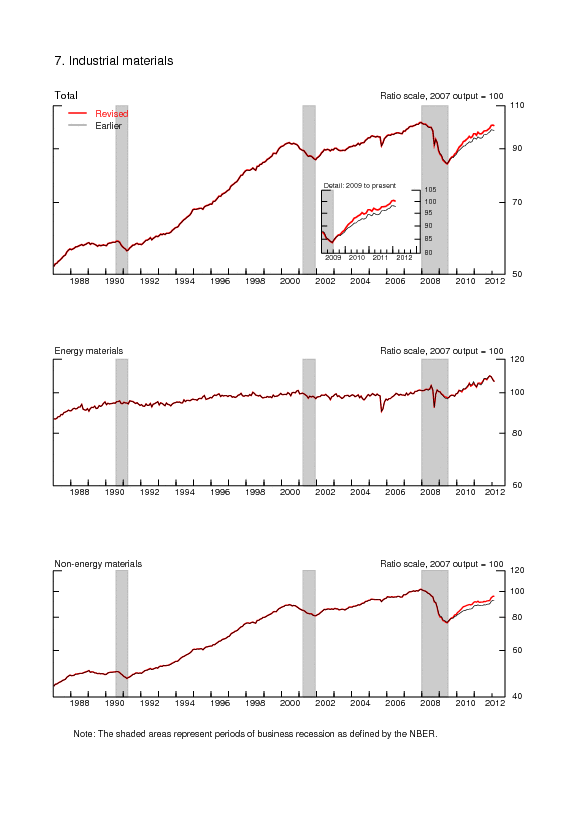
The index for materials increased in 2007, declined in 2008 and in the first half of 2009, and advanced strongly in the second half of 2009 and in 2010 and 2011. The decline in 2009 as a whole is now reported to have been less steep and the increase in 2010 more robust than previously stated; revisions in other years were small. The indexes for durable and nondurable materials show similar patterns through 2008 with moderate gains in 2007, followed by steep declines in 2008. In 2009, the output of durable materials continued to contract sharply, but it then rebounded strongly in 2010 and continued to increase in 2011. The production of nondurable materials edged up in 2009 and rose moderately in 2010 before ticking down in 2011. The index for energy materials moved up in 2007, declined modestly in 2008 and 2009, and then increased robustly in 2010 and 2011.
Capacity
Total industrial capacity was little changed in 2008, declined in 2009, and fell more in 2010 (table 5). Capacity moved up in 2011 and is expected to expand modestly in 2012. Relative to previous estimates, the decline in capacity in 2009 is now shallower and the increase in 2011 is less robust.
Capacity in manufacturing declined in each year from 2008 through 2010, with the largest decreases in 2009 and 2010; manufacturing capacity was little changed in 2011 and is expected to expand in 2012. The contour of manufacturing capacity was little altered by revisions. Durable manufacturing capacity stepped down in 2008, decreased more sharply in 2009 and 2010, and then advanced in 2011; it is expected to expand more rapidly in 2012. Nondurable manufacturing capacity decreased in every year from 2008 through 2011. For high-technology industries, capacity expanded solidly in 2011 and is expected to post further gains in 2012; however, increases in both years are now smaller than previously reported.
Capacity at mines expanded in 2008 and 2009, edged down in 2010, and increased in 2011; capacity is expected to increase in 2012. Relative to previous estimates, the rates of change are now stronger in all years with the exception of 2012, when the expected increase is now smaller than reported earlier. Capacity at electric and natural gas utilities increased steadily over the 2008--11 period; revisions were modest and boosted, on net, the gains in recent years.
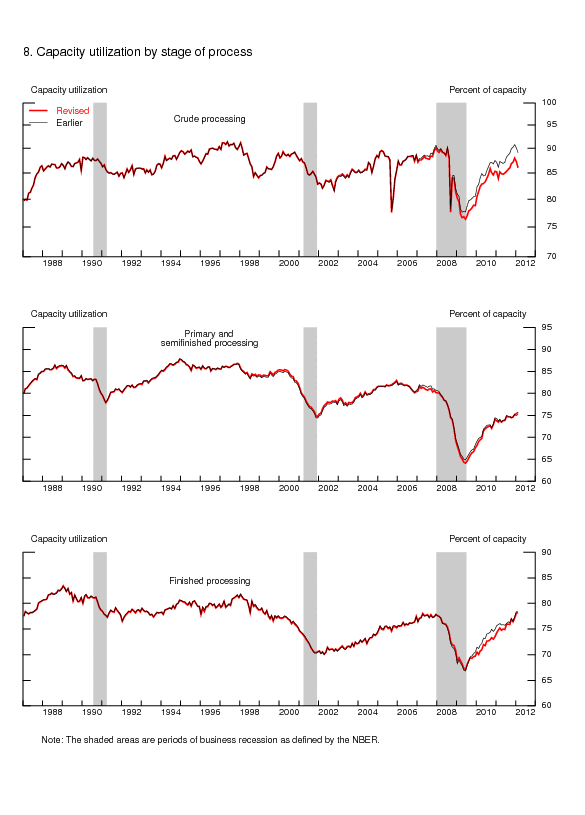
By stage of processing, capacity in the crude stage rose in 2008 and 2009, declined in 2010, and then advanced in 2011 and 2012. In contrast, capacity at the primary and semifinished stage was little changed in 2008 and declined in both 2009 and 2010; capacity increased moderately in 2011 and is expected to post further gains in 2012. Upward revisions boosted capacity gains at the crude stage in 2009 and made the decline in capacity less steep for the primary and seminished stage in 2009 and 2010. Capacity at the finished stage declined in each year from 2008 through 2010 and then advanced in 2011 and 2012. Downward revisions to capacity in the finished stage added to declines in 2009 and 2010 and subtracted from gains in 2011.
Capacity Utilization
In 2008, the rate of capacity utilization for total industry, at 73.2 percent, was 7.1 percentage points below its long-run (1972 through 2011) average of 80.3 percent (table 6).[4] Utilization rates fell in the first half of 2009 before increasing steadily through the end of 2011. Nevertheless, after these gains, the level in the fourth quarter of 2011, at 77.8 percent, was 2.5 percentage points below its long-run average. Downward revisions lowered capacity utilization for total industry in every year from 2008 through 2011.
Capacity utilization rates for manufacturing IP declined in 2008 and 2009 before gaining in 2010 and 2011. The factory operating rate is now estimated to have been lower in 2008 through 2010; capacity utilization was revised slightly higher in 2011. After revisions, the utilization rate at the June 2009 trough of the recent recession was 63.8 percent, the lowest level in the history of the series, which begins in 1948. By the fourth quarter of 2011, the capacity utilization rate had risen to 76.0 percent, 2.8 percentage points below its long-run average. The factory operating rate for durable manufacturing declined in 2009 and then increased in 2010 and 2011; revisions made the decline in 2009 more steep. In contrast, the utilization rate for nondurable manufacturing increased for each year from 2009 through 2011, although revisions decreased the magnitude of the gains in 2009 and 2010.
As of the fourth quarter of 2011, most major manufacturing industry groups were operating at rates below their industry-specific long-run averages, although capacity utilization for manufacturing as a whole has recovered most of the losses from the previous recession. Apart from petroleum and coal products, every major industry in nondurable manufacturing was operating at utilization rates below its long-run average, with textile and product mills; apparel and leather; and printing and support operating well below long-run averages. In contrast, a number of durable goods industries including fabricated metal products; machinery; computer and electronic products; aerospace and miscellaneous transportation equipment; and miscellaneous manufacturing were operating at capacity utilization rates above their long-run averages. The selected high-technology industries were operating at a capacity utilization rate of 75.1 percent in 2011, about 3 percentage points below their long-run averages. Within high-technology industries, upward revisions in 2011 pushed factory operating rates for computers and peripheral equipment and for communications equipment to near or above their long-run averages.
Capacity utilization in mining was slightly above its long-run average in 2008 before falling in 2009 and then increasing robustly in 2010 and 2011. Revisions lowered reported capacity utilization in every year from 2008 to 2011, but utilization was above its long-run average in 2011. The rate of capacity utilization for utilities was 3.2 percentage points below its long-run average in 2008 and stepped down in each year from 2009 through 2011. The rate of utilization at utilities stood at 75.6 percent in 2011, 10.7 percentage points below its long-run average of 86.3 percent.
TECHNICAL ASPECTS OF THE REVISION
This revision incorporated new comprehensive data from the 2010 ASM and revised data from the 2009 ASM for production and value added by manufacturing industries. Revised price indexes from the Bureau of Economic Analysis (BEA) and updated price indexes constructed by the Federal Reserve for a few selected industries were also incorporated.[5] In addition, the updated production indexes include revisions to the measures of employment and production-worker hours from the Current Employment Statistics monthly survey by the Bureau of Labor Statistics (BLS). The benchmark indexes for logging and publishing (included in the IP index for manufacturing but no longer included in manufacturing under NAICS) were updated through 2010 based on data from the U.S. Forest Service and the Census Bureau.
The revised IP indexes incorporated information from selected CIRs for 2011, the QSPC for 2011, and other annual industry reports.[6] The indexes also incorporated revised monthly and quarterly source data on production, shipments, and inventories.
Annual Benchmark Output Indexes and the Conversion to the 2007 North American Industry Classification System
As part of the annual revision, a benchmark output index---defined to be the nominal gross output divided by a price index---is constructed for each six-digit industry under the NAICS. In this revision, the benchmark indexes were calculated for 1972 forward based on industries defined by the 2007 NAICS; previously the benchmark indexes were based on the 2002 NAICS definitions of industries. Likewise, the industry basis for capacity and utilization was changed to the 2007 NAICS. The 2007 NAICS included 16 six-digit manufacturing industries that had different coverage than in the 2002 NAICS. For example, one industry included in the 2002 NAICS, laboratory apparatus and furniture manufacturing (NAICS 339111), was eliminated; its various components were distributed among seven different six-digit industries in the 2007 NAICS.
The conversion to the 2007 NAICS did not affect the number or structure of individual IP series that are published because the changes to NAICS occurred at a finer level of industrial detail than the corresponding published IP series. For example, the most disaggregated IP index that included NAICS 339111 is the IP series for medical equipment and supplies (NAICS 3391), which includes several other six-digit industries (NAICS 339112, 339113, 339114, 339115, and 339116) that are present in both the 2002 NAICS and the 2007 NAICS.
Although the published IP series were not affected by the transition to the 2007 NAICS, the benchmark indexes for some industries needed to be updated. Looking again to the eliminated NAICS 339111, an establishment that was assigned to this industry under the 2002 NAICS was reassigned to one of a handful of other industries in the 2007 NAICS. To create a consistent history, new benchmarks needed to be constructed for each receiving industry. The Census Bureau issued in 2011 a concordance between industries under the 2007 NAICS and those under the 2002 NAICS as part of the 2007 Census of Manufactures. This concordance provided data on how shipments from 2002 NAICS industries would have been allocated to 2007 NAICS industries, and vice-versa. These estimated allocations were then used on historic data to construct both gross output estimates and price indexes on a 2007 NAICS basis going back to 1972. The revised benchmark indexes mean that the adjustment factors to align the monthly production indicator with the benchmark for the IP series associated with some of these industries also needed to be reestimated, both for series being used to estimate the IP indexes for recent years as well as those that were only used in earlier periods.[7]
Benchmark indexes are measures of real gross output at the six-digit NAICS level. The Census Bureau provides annual values for value added and the cost of materials, which can be summed to obtain nominal gross output.[8] The benchmark indexes for this revision incorporated new estimates of nominal gross output for 2010, as well as revisions to the 2009 estimates, from the ASM. The IP index is a Fisher index and the individual real gross output benchmarks are aggregated using value-added weights. To obtain real gross output, the measures of nominal gross output are deflated by annual price deflators. The deflators for the IP benchmarks primarily reflect industry shipments deflators, most recently issued by the BEA in December 2011. The BEA deflators are available on a 2002 NAICS basis, so they needed to be converted to the 2007 NAICS structure before being applied to the detailed nominal gross output data.
Since 2003, the ASM has not included separate data for every six-digit manufacturing industry; data for some industries were included only as part of a larger group of industries. The 2007 Census, however, still contained separate data for each six-digit industry. For 2003 through 2006, the IP benchmark indexes were calculated by allocating the data from these combined industries to their six-digit components based on interpolating between each component's share of the total in the 2002 and 2007 Economic Censuses. Data from the 2008, 2009, and 2010 ASMs were allocated to the component six-digit industries solely based on shares from the 2007 Economic Census.
Changes to Individual Production and Capacity Series
A few production indicators were affected by methodological changes in this revision.
Computers
This revision updates the methods used to calculate four IP series for computers (business desktop computers, consumer desktop computers, business mobile computers, and consumer mobile computers). These four IP series are all components of NAICS 334111. The source data for computers come from the International Data Corporation (IDC) and measure quarterly domestic absorption of computers. The 2010 annual revision reported that the Federal Reserve received measures of absorption of only total desktops and total mobiles but had ceased to acquire detailed information on the business and consumer components of these platforms. This revision resumes the acquisition of absorption data from the IDC on business and consumer desktops and mobiles. In addition to current-quarter data, the IDC has provided historical information, so the four IP series can be constructed with a consistent methodology from the beginning of the IDC data in 1994 and continuing through the present.
Natural gas extraction
The IP series for natural gas extraction (NAICS 211111, pt.) uses as primary source data the marketed production of natural gas from the DOE's Natural Gas Monthly report. The DOE report is generally issued with a three-month lag; for example, when IP is published in mid-April, natural gas data are only available through January even though the IP window would run through March. This revision incorporates new, more timely, source data from Bentek Energy to supplement the DOE data. Bentek provides daily information on the production of natural gas. The Federal Reserve converts the data from Bentek to a monthly frequency and uses them as a secondary source to inform early estimates for natural gas extraction until the data from the DOE become available.
Trucks
This revision incorporates new data and methods for constructing the share of light truck output that is associated with business output and the share associated with consumer output. The IP indexes for trucks (NAICS 336112) are constructed from data on total assemblies from WardsAuto. Because the IP structure parses industry output into demand-based segments called market groups, it is necessary to assign vehicle assemblies into business and consumer components. The IP indexes use data from the BEA and annual data from CNW Research on the number of leased trucks to help determine the business and consumer shares of both car and truck production. With this revision, the Federal Reserve incorporated monthly data on factory shipments of class 2 and 3 truck chassis from the National Truck Equipment Association and factory shipments of light trucks for classes 1 through 3 from WardsAuto to extend and interpolate the annual figures for the business share of overall light truck production.
Veneer, plywood, and engineered wood product
The capacity series for veneer, plywood, and engineered wood product (NAICS 3212) has been updated with this revision. Previously, the series used data from the Composite Panel Association (CPA) on the capacity of particleboard and fiberboard producers. This revision incorporates additional data. The capacity series continues to use the CPA data but now also uses information from APA - The Engineered Wood Association on the capacity of producers of plywood and oriented strand board.
Discontinuation of the U.S. Census Bureau's CIRs
In mid-2011, the U.S. Census Bureau discontinued its CIR series. These data releases provided detailed product information at the monthly, quarterly, and annual frequencies for a variety of industries. The last release for monthly data was for July 2011, and the last release of quarterly data was for the second quarter of 2011. The Federal Reserve extensively used the CIRs in the indexes of industrial production and capacity utilization, and their elimination necessitated changes in underlying source data for several IP series. The following list shows the monthly CIRs that were used in industrial production and their corresponding IP series:
- M311J: Fats and Oil: Oilseed Crushings (Corn oil; Soybean and other oilseed processing)
- M311K: Fats and Oils: Production, Consumption, and Stocks (Fats and oils refining and blending)
- M313P: Consumption on the Cotton System and Stocks (Fiber, yarn, and thread mills).
With this revision, each of the three affected IP series will use production-worker hours to extend the discontinued CIR data. The list below shows the discontinued quarterly CIRs that were used in industrial production and their associated IP series:
- MQ311A: Flour Milling Products (Flour milling and malt)
- MQ325A: Inorganic Chemicals (Acids, phosphates, and sulfates; Other inorganic chemicals)
- MQ325B: Fertilizers and Related Chemicals (Other inorganic chemicals; Fertilizer)
- MQ325F: Paint, Varnish, and Lacquer (Construction paints; Industrial paints)
- MQ327D: Clay Construction Products (Ceramic tile and refractory; Brick and structural clay tile; Other structural clay product)
- MQ333W: Metalworking Machinery (Machine tools)
- MQ334P: Telecommunications (Data networking equipment; Transmission, local loop, and legacy central office equipment; Enterprise and home voice equipment; Satellites and earth station equipment; Wireless system equipment; Radio and TV broadcasting equipment excluding satellites and other communications equipment)
- MQ334R: Computers and Peripheral Equipment (Computer storage and terminals, business; Computer storage and terminals, consumer; Computer printers, business; Computer printers, consumer)
Other than the changes to IP series described below, this revision uses production-worker hours to extend the IP series associated with the discontinued quarterly CIRs.
For some of the IP series related to discontinued quarterly CIRs, the Federal Reserve used alternate measures of physical output to replace the lost data.
Fertilizer
With this revision, the IP series for fertilizer (NAICS 32531) uses monthly data on nitrogen and phosphate fertilizer from the Fertilizer Institute (TFI) as the primary source of data on output. Previously, the monthly TFI data were used as a secondary source for months in which the quarterly CIR data were not yet available, and they were also used to interpolate the quarterly data to a monthly frequency.
Communications Equipment
This revision updates the data and methods used to calculate the six IP series for communications equipment (data networking equipment; transmission, local loop, and legacy central office equipment; enterprise and home voice equipment; satellites and earth station equipment; wireless system equipment; radio and TV broadcasting equipment excluding satellites and other communications equipment). These six series are all components of NAICS 3342. With the discontinuation of the CIR for telecommunications equipment, the Federal Reserve has begun using information from the QSPC to extend each of the six IP series from the third quarter of 2011 through the present.
The QSPC, conducted since 2007, reports capacity utilization rates for manufacturing industries on a quarterly frequency. In recent years, the utilization rates from that survey for communications equipment have tracked nominal output of that industry, as measured by the discontinued CIR, fairly well. With this revision, the nominal data on communications equipment from the CIR are being extended based on the change in the industry operating rate from the QSPC and an interpolated change in capital services for this industry (constructed based on historical investment data and a survey of investment plans). The resulting estimate for nominal output continues to be deflated by price indexes calculated from price data from Dell'Oro and producer price indexes from the BLS.
Computers
The discontinued quarterly CIR for computers and peripheral equipment was used for four IP series (Computer storage and terminals, business; Computer storage and terminals, consumer; Computer printers, business; Computer printers, consumer). These four series cover part of NAICS 3341; six other IP series that cover the remainder of NAICS 3341 and rely on data from the IDC on domestic absorption of desktops, mobiles, and servers. In the absence of the CIR data, IDC data on personal computers are used to extend IP series for computer storage and terminals, and IDC data on non-x86 servers are used to extend IP series for computer printers.
Weights for Aggregation
The IP index is a Fisher index. The weights for manufacturing industries are derived from value-added measures from the Census of Manufactures and the ASM. The Federal Reserve derives estimates of value added for the electric and gas utility industries from annual revenue and expense data issued by other organizations. The weights for aggregation, expressed as value added per unit, were estimated with the latest data on producer prices for the period after 2010. Table 12 shows the annual value-added proportions in the IP index from 2004 through 2011.
Revised Quarterly and Monthly Data
This revision incorporates product data that became available or were revised after the regular six-month reporting window for monthly IP was closed. These data were released with too great of a lag to be included with monthly IP estimates but were available for inclusion in the annual revision.
Revised Seasonal Factors
Seasonal factors for all series were reestimated using data that extend into 2012. Factors for production-worker hours---which adjust for timing, holiday, and monthly seasonal patterns---were updated with data through January 2012. The updated factors for the physical product series, which include adjustments for holiday and workday patterns, used data through December 2011 where available. Seasonal factors for unit motor vehicle assemblies have been updated, and projections through December 2012 are on the Board's website at www.federalreserve.gov/releases/g17/mvsf.htm.
The 2010 annual revision introduced a pre-adjustment to many seasonal factors to account for the effects of the recent recession. The current revision continued those pre-adjustments where necessary. A more detailed description of these methods will be included in a forthcoming Federal Reserve publication.
Files containing the revised data and the text and tables from this release are available on the Board's website at www.federalreserve.gov/releases/g17, as are updated data for the annual revision and for all of the regularly issued series on industrial production, capacity, and capacity utilization. Further information on these revisions is available from the Board's Industrial Output Section (telephone 202-452-3197).
A document with printed tables of the revised estimates of series shown in the G.17 release is available upon request to the Industrial Output Section, Mail Stop 82, Division of Research and Statistics, Board of Governors of the Federal Reserve System, Washington, DC 20551.
An expanded version of this release will be published in a forthcoming report that will be available on the Board's website.
[1] The revision affected rates of change for IP from 1972 forward. When necessary to maintain consistency with any revisions to the data for 1972 and subsequent years, the levels of the production and capacity indexes for the years before 1972 were multiplied by a constant. However, utilization rates and the rates of change in IP for the years before 1972 were not revised.
Return to text
[2] In this section, all the rates of change for a full year are calculated from the fourth quarter of the previous year to the fourth quarter of the reference year. Rates of change on a half-year basis are shown in table 7.
Return to text
[3] Manufacturing consists of those industries in the North American Industry Classification System definition of manufacturing, plus those industries---logging and newspaper, periodical, book, and directory publishing---that were in the manufacturing sector under the Standard Industrial Classification system.
Return to text
[4] Unless otherwise noted, rates of capacity utilization are reported for the fourth quarter of the reference year.
Return to text
[5] Price indexes for pharmaceuticals (NAICS 325412), for semiconductors (NAICS 334413), and for most components of communications equipment (NAICS 3342) are constructed by the Federal Reserve from alternative sources. A table that lists annual and quarterly price indexes for the networking equipment component of communications equipment follows the text.
Return to text
[6] The Census Bureau's Current Industrial Reports were discontinued in mid-2011.
Return to text
[7] The monthly production indicators include product data, production-worker-hour data, and, from the 1960s to 1997, electric power use by industry.
Return to text
[8] Historically, the Census Bureau also provided measures of the cost of resales at the six-digit level and those were included in the nominal benchmark. In recent years, however, the cost of resales has not always been available, so to maintain consistency, the benchmarks since 2003 have excluded the cost of resales.
Return to text
