

 DDP
DDP Print
PrintIndustrial Production and Capacity Utilization - G.17
Current Release (250 KB PDF) (ASCII)
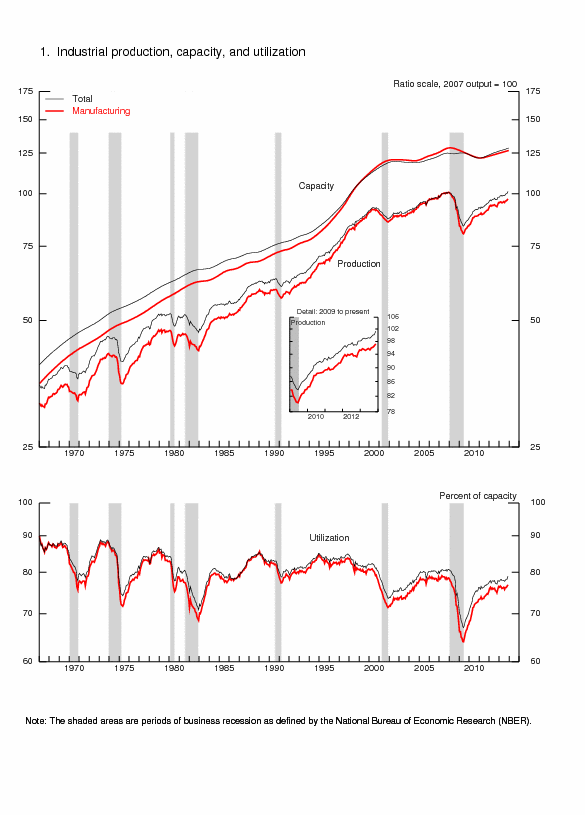
Industrial production increased 1.1 percent in November after having edged up 0.1 percent in October; output was previously reported to have declined 0.1 percent in October. The gain in November was the largest since November 2012, when production rose 1.3 percent. Manufacturing output increased 0.6 percent in November for its fourth consecutive monthly gain. Production at mines advanced 1.7 percent to more than reverse a decline of 1.5 percent in October. The index for utilities was up 3.9 percent in November, as colder-than-average temperatures boosted demand for heating. At 101.3 percent of its 2007 average, total industrial production was 3.2 percent above its year-earlier level. In November, industrial production surpassed for the first time its pre-recession peak of December 2007 and was 21 percent above its trough of June 2009. Capacity utilization for the industrial sector increased 0.8 percentage point in November to 79.0 percent, a rate 1.2 percentage points below its long-run (1972-2012) average.
Industrial Production and Capacity Utilization: Summary
| Industrial production | 2007=100 | Percent change | |||||||||||
|---|---|---|---|---|---|---|---|---|---|---|---|---|---|
| 2013 | 2013 | Nov. '12 to Nov. '13 |
|||||||||||
| June[r] | July[r] | Aug.[r] | Sept.[r] | Oct.[r] | Nov.[p] | June[r] | July[r] | Aug.[r] | Sept.[r] | Oct.[r] | Nov.[p] | ||
| Total index | 99.2 | 99.0 | 99.5 | 100.1 | 100.2 | 101.3 | .2 | -.2 | .5 | .5 | .1 | 1.1 | 3.2 |
| Previous estimates | 99.2 | 99.0 | 99.5 | 100.1 | 100.0 | .2 | -.2 | .5 | .7 | -.1 | |||
| Major market groups | |||||||||||||
| Final Products | 97.0 | 96.0 | 96.7 | 97.5 | 97.5 | 98.3 | .4 | -1.0 | .6 | .9 | .0 | .9 | 2.4 |
| Consumer goods | 94.3 | 93.2 | 93.6 | 94.4 | 94.3 | 95.7 | .3 | -1.1 | .5 | .8 | -.1 | 1.5 | 2.7 |
| Business equipment | 102.9 | 102.0 | 102.8 | 103.9 | 104.1 | 103.6 | .7 | -.8 | .7 | 1.1 | .2 | -.5 | 2.2 |
| Nonindustrial supplies | 88.1 | 88.2 | 88.5 | 89.2 | 89.4 | 90.2 | .1 | .1 | .3 | .8 | .3 | .9 | 3.6 |
| Construction | 81.1 | 81.4 | 81.6 | 82.4 | 82.9 | 83.4 | .6 | .3 | .2 | 1.0 | .6 | .6 | 4.9 |
| Materials | 105.0 | 105.5 | 106.1 | 106.2 | 106.4 | 107.9 | .0 | .5 | .5 | .1 | .2 | 1.4 | 3.8 |
| Major industry groups | |||||||||||||
| Manufacturing (see note below) | 95.8 | 95.3 | 96.0 | 96.1 | 96.6 | 97.2 | .3 | -.5 | .7 | .1 | .5 | .6 | 2.9 |
| Previous estimates | 95.8 | 95.3 | 95.9 | 96.0 | 96.3 | .3 | -.5 | .7 | .1 | .3 | |||
| Mining | 118.9 | 120.8 | 121.3 | 122.2 | 120.4 | 122.5 | 1.1 | 1.6 | .4 | .8 | -1.5 | 1.7 | 5.2 |
| Utilities | 98.3 | 98.0 | 97.2 | 100.3 | 100.0 | 103.9 | -2.0 | -.2 | -.9 | 3.2 | -.3 | 3.9 | 2.8 |
| Capacity utilization | Percent of capacity | Capacity growth |
|||||||||||
|---|---|---|---|---|---|---|---|---|---|---|---|---|---|
| Average 1972- 2012 |
1988- 89 high |
1990- 91 low |
1994- 95 high |
2009 low |
2012 Nov. |
||||||||
| 2013 | Nov. '12 to Nov. '13 |
||||||||||||
| June[r] | July[r] | Aug.[r] | Sept.[r] | Oct.[r] | Nov.[p] | ||||||||
| Total industry | 80.2 | 85.2 | 78.8 | 85.0 | 66.9 | 77.9 | 77.9 | 77.7 | 78.0 | 78.3 | 78.2 | 79.0 | 1.8 |
| Previous estimates | 77.9 | 77.7 | 77.9 | 78.3 | 78.1 | ||||||||
| Manufacturing (see note below) | 78.7 | 85.6 | 77.3 | 84.6 | 64.0 | 75.8 | 76.2 | 75.7 | 76.2 | 76.2 | 76.4 | 76.8 | 1.6 |
| Previous estimates | 76.2 | 75.7 | 76.1 | 76.1 | 76.2 | ||||||||
| Mining | 87.3 | 86.3 | 83.9 | 88.6 | 78.3 | 89.0 | 88.8 | 89.9 | 89.9 | 90.2 | 88.6 | 89.7 | 4.4 |
| Utilities | 86.2 | 92.9 | 84.3 | 93.3 | 78.6 | 79.4 | 76.8 | 76.6 | 75.9 | 78.3 | 78.0 | 81.0 | .9 |
| Stage-of-process groups | |||||||||||||
| Crude | 86.3 | 87.7 | 84.4 | 89.7 | 76.4 | 87.4 | 87.2 | 88.0 | 88.2 | 88.2 | 87.2 | 88.3 | 3.5 |
| Primary and semifinished | 81.0 | 86.5 | 78.0 | 87.9 | 64.4 | 75.9 | 75.7 | 75.7 | 75.9 | 76.5 | 76.7 | 77.9 | .7 |
| Finished | 77.1 | 83.4 | 77.3 | 80.6 | 66.8 | 76.0 | 76.3 | 75.2 | 75.7 | 75.7 | 75.8 | 75.9 | 2.5 |
Market Groups
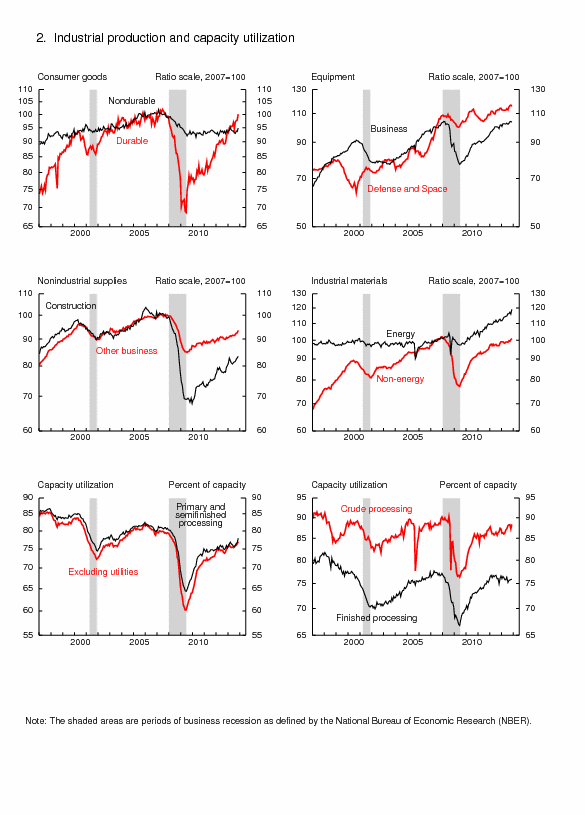
The production of consumer goods increased 1.5 percent in November and stood 2.7 percent above its level of a year earlier. The output of durable consumer goods rose 2.2 percent, and all of its major components registered gains of 1.0 percent or more. The largest increases were in the production of automotive products, which rose 3.3 percent, and in the production of home electronics, which moved up 2.6 percent. The production of consumer nondurables rose 1.3 percent. The rise was supported by strong gains in chemical products and especially in consumer energy products. After three consecutive months of gains, the output of business equipment fell 0.5 percent in November. The indexes for information processing equipment and for industrial and other equipment declined 1.8 percent and 0.6 percent, respectively, while the production of transit equipment increased 1.0 percent. Despite its decrease in November, the index for business equipment was 2.2 percent above its year-earlier level.
The output of defense and space equipment declined 0.8 percent in November following three months of gains. The index for November was 1.4 percent above its year-earlier level.
Among nonindustrial supplies, construction supplies moved up 0.6 percent in November to record its sixth consecutive monthly increase; the index was 4.9 percent above its level of a year earlier. The output of business supplies advanced 1.0 percent in November, its fifth consecutive increase, and has gained 3.1 percent during the past 12 months.
In November, the production of materials to be processed further in the industrial sector rose 1.4 percent. The rise reflected improvements in each of the major components of the index, with an advance of 2.7 percent for energy materials, a gain of 0.9 percent for durable materials, and an increase of 0.2 percent for nondurable materials. Among durable materials, all major components registered gains. Among nondurable materials, the indexes for textile materials and chemical materials increased 2.4 percent and 0.4 percent, respectively, while paper production decreased 0.5 percent.
Industry Groups
Manufacturing output rose 0.6 percent in November to a level that was 2.9 percent above a year earlier but 3.6 percent below its pre-recession peak; gains were widespread across industries. The factory operating rate rose 0.4 percentage point to 76.8 percent, a rate 1.9 percentage points below its long-run average.
The production of durable goods advanced 0.8 percent in November. The output of motor vehicles and parts increased 3.4 percent, and gains of nearly 1.0 percent or more were recorded for wood products; non-metallic mineral products; fabricated metal products; electrical equipment, appliances, and components; furniture and related products; and miscellaneous manufacturing. Decreases were registered by the indexes for primary metals, for machinery, for computers and electronic products, and for aerospace and miscellaneous transportation equipment; each declined 0.2 percent. The utilization rate for durable manufacturers rose 0.4 percentage point to 77.3 percent and was above its long-run average of 77.0 percent for the first time since April 2008.
The output of nondurables rose 0.5 percent in November for its largest increase since December 2012. The index for textile and product mills rose 1.7 percent, while the indexes for petroleum and coal products and for chemicals both advanced 0.9 percent. Small gains were recorded by paper and by plastics and rubber products, while small losses were registered by apparel and leather and by printing and support. The operating rate for nondurables rose 0.4 percentage point to 77.6 percent, a rate 3.1 percentage points below its long-run average.
Following a 0.7 percent decline in October, the production of non-NAICS manufacturing industries (publishing and logging) moved up 0.6 percent in November; over the past 12 months, output for this group of industries has decreased 1.5 percent.
Mining output advanced 1.7 percent in November after having declined 1.5 percent in October; temporary shutdowns of oil and gas rigs in the Gulf of Mexico in anticipation of Tropical Storm Karen contributed to the October decrease. Capacity utilization at mines increased 1.1 percentage points to 89.7 percent in November and has been at or above its long-run average of 87.3 percent since October 2011. The output of utilities rose 3.9 percent in November, and similarly sized gains were posted for both the electric and the natural gas categories. The capacity utilization rate for utilities rose 3.0 percentage points to 81.0 percent.
Capacity utilization rates in November for industries grouped by stage of process were as follows: At the crude stage, utilization increased 1.1 percentage points to 88.3 percent, a rate 2.0 percentage points above its long-run average; at the primary and semifinished stages, utilization rose 1.2 percentage points to 77.9 percent, a rate 3.1 percentage points below its long-run average; and at the finished stage, utilization edged up 0.1 percentage point to 75.9 percent, a rate 1.2 percentage points lower than its long-run average.
