

 DDP
DDP Print
PrintIndustrial Production and Capacity Utilization - G.17
Current Release (254 KB PDF) (ASCII)
On Friday, March 7th, the Federal Reserve will publish updated seasonal factors for auto and truck production, with revised seasonal factors back to September 2013 and seasonal factors extended through June 2015.
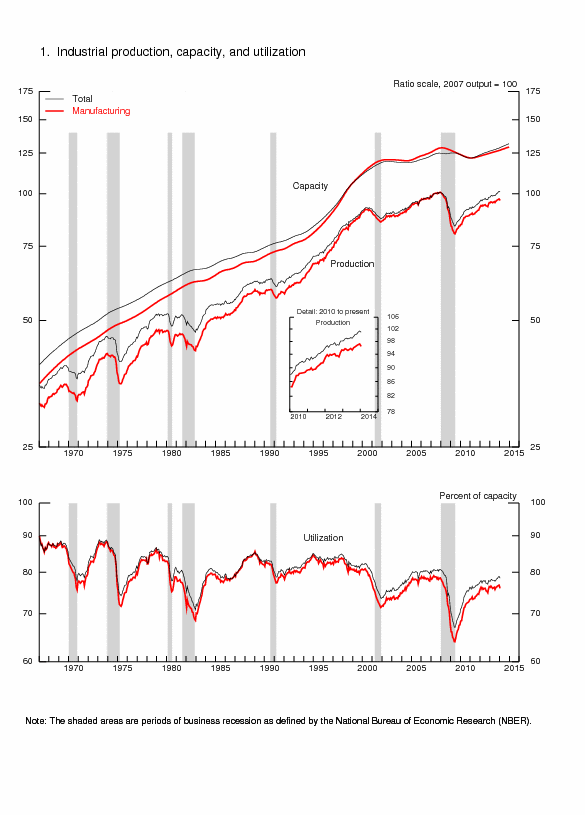
Industrial production decreased 0.3 percent in January after having risen 0.3 percent in December. In January, manufacturing output fell 0.8 percent, partly because of the severe weather that curtailed production in some regions of the country. Additionally, manufacturing production is now reported to have been lower in the fourth quarter; the index is now estimated to have advanced at an annual rate of 4.6 percent in the fourth quarter rather than 6.2 percent. The output of utilities rose 4.1 percent in January, as demand for heating was boosted by unseasonably cold temperatures. The production at mines declined 0.9 percent following a gain of 1.8 percent in December. At 101.0 percent of its 2007 average, total industrial production in January was 2.9 percent above its level of a year earlier. The capacity utilization rate for total industry decreased in January to 78.5 percent, a rate that is 1.6 percentage points below its long-run (1972–2013) average.
Industrial Production and Capacity Utilization: Summary
| Industrial production | 2007=100 | Percent change | |||||||||||
|---|---|---|---|---|---|---|---|---|---|---|---|---|---|
| 2013 | 2014 Jan.[p] |
2013 | 2014 Jan.[p] |
Jan. '13 to Jan. '14 |
|||||||||
| Aug.[r] | Sept.[r] | Oct.[r] | Nov.[r] | Dec.[r] | Aug.[r] | Sept.[r] | Oct.[r] | Nov.[r] | Dec.[r] | ||||
| Total index | 99.6 | 100.2 | 100.4 | 101.0 | 101.4 | 101.0 | .6 | .6 | .2 | .7 | .3 | -.3 | 2.9 |
| Previous estimates | 99.5 | 100.1 | 100.4 | 101.5 | 101.8 | .5 | .6 | .3 | 1.0 | .3 | |||
| Major market groups | |||||||||||||
| Final Products | 96.7 | 97.7 | 97.9 | 98.3 | 98.5 | 98.1 | .6 | 1.1 | .2 | .4 | .3 | -.4 | 2.5 |
| Consumer goods | 93.7 | 94.7 | 95.0 | 95.6 | 96.2 | 95.8 | .5 | 1.0 | .3 | .7 | .6 | -.5 | 2.7 |
| Business equipment | 102.8 | 103.9 | 104.0 | 103.6 | 103.0 | 102.9 | .6 | 1.1 | .1 | -.4 | -.7 | -.1 | 2.4 |
| Nonindustrial supplies | 88.5 | 89.3 | 89.6 | 90.1 | 90.0 | 89.7 | .3 | .8 | .4 | .5 | -.1 | -.3 | 2.4 |
| Construction | 81.7 | 82.6 | 83.3 | 83.6 | 83.1 | 82.3 | .2 | 1.1 | .9 | .4 | -.6 | -1.0 | 1.7 |
| Materials | 106.1 | 106.3 | 106.4 | 107.4 | 108.0 | 107.7 | .5 | .2 | .1 | 1.0 | .5 | -.3 | 3.4 |
| Major industry groups | |||||||||||||
| Manufacturing (see note below) | 96.0 | 96.3 | 96.7 | 97.0 | 97.2 | 96.4 | .8 | .2 | .4 | .3 | .3 | -.8 | 1.3 |
| Previous estimates | 96.0 | 96.2 | 96.8 | 97.3 | 97.8 | .7 | .2 | .6 | .6 | .4 | |||
| Mining | 121.3 | 122.5 | 120.6 | 121.7 | 123.8 | 122.8 | .5 | 1.0 | -1.5 | .9 | 1.8 | -.9 | 6.7 |
| Utilities | 97.2 | 100.3 | 101.4 | 104.3 | 102.9 | 107.1 | -1.0 | 3.2 | 1.0 | 2.9 | -1.4 | 4.1 | 9.3 |
| Capacity utilization | Percent of capacity | Capacity growth |
|||||||||||
|---|---|---|---|---|---|---|---|---|---|---|---|---|---|
| Average 1972- 2013 |
1988- 89 high |
1990- 91 low |
1994- 95 high |
2009 low |
2013 Jan. |
||||||||
| 2013 | 2014 Jan.[p] |
Jan. '13 to Jan. '14 |
|||||||||||
| Aug.[r] | Sept.[r] | Oct.[r] | Nov.[r] | Dec.[r] | |||||||||
| Total industry | 80.1 | 85.2 | 78.8 | 85.0 | 66.9 | 77.7 | 78.0 | 78.4 | 78.4 | 78.8 | 78.9 | 78.5 | 1.9 |
| Previous estimates | 78.0 | 78.3 | 78.4 | 79.1 | 79.2 | ||||||||
| Manufacturing (see note below) | 78.7 | 85.6 | 77.3 | 84.6 | 64.0 | 76.2 | 76.2 | 76.3 | 76.5 | 76.6 | 76.7 | 76.0 | 1.6 |
| Previous estimates | 76.2 | 76.2 | 76.6 | 76.9 | 77.2 | ||||||||
| Mining | 87.4 | 86.3 | 83.9 | 88.6 | 78.3 | 87.3 | 89.9 | 90.4 | 88.7 | 89.1 | 90.3 | 89.2 | 4.6 |
| Utilities | 86.0 | 92.9 | 84.3 | 93.3 | 78.6 | 76.9 | 75.9 | 78.3 | 79.1 | 81.3 | 80.1 | 83.3 | .8 |
| Stage-of-process groups | |||||||||||||
| Crude | 86.3 | 87.7 | 84.4 | 89.7 | 76.4 | 86.2 | 88.1 | 88.1 | 86.9 | 87.2 | 88.3 | 87.3 | 3.7 |
| Primary and semifinished | 80.9 | 86.5 | 78.0 | 87.9 | 64.4 | 75.9 | 76.0 | 76.6 | 77.2 | 77.9 | 77.6 | 77.8 | .8 |
| Finished | 77.1 | 83.4 | 77.3 | 80.6 | 66.8 | 76.0 | 75.7 | 75.9 | 75.9 | 75.8 | 76.0 | 75.2 | 2.4 |
Market Groups
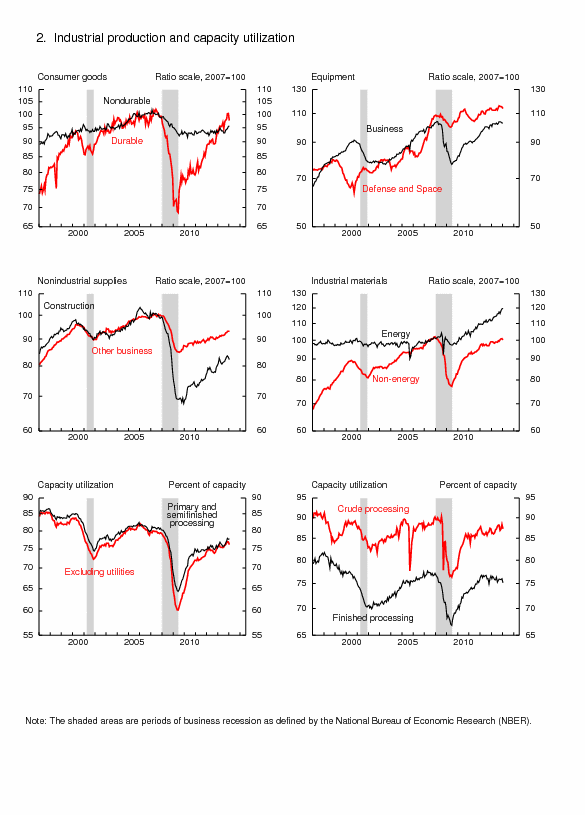
In January, the production of consumer goods fell 0.5 percent, its first decrease in six months. The indexes for consumer durables and consumer non-energy nondurables moved down 2.6 percent and 0.8 percent, respectively, while the index for consumer energy products rose 2.8 percent. Within consumer durables, the production of automotive products fell 5.1 percent and the output of appliances, furniture, and carpeting declined 0.6 percent. These losses were partly offset by an increase of 1.1 percent for home electronics and a gain of 0.3 percent for miscellaneous goods. Within consumer non-energy nondurables, the indexes for foods and tobacco, for chemical products, and for paper products declined by 1.0 percent or less, while the output of clothing moved up 0.5 percent. The gain in consumer energy products was the result of a sizable increase in the index for residential utilities.
The output of business equipment edged down 0.1 percent in January, its third consecutive monthly decline. Decreases in the indexes for transit equipment and for industrial and other equipment were largely offset by an increase in the index for information processing equipment. Over the past 12 months, the index for business equipment has moved up 2.4 percent, with similarly sized gains in each of its three major components.
The production of defense and space equipment fell 1.0 percent in January for its fourth consecutive monthly decline. Nevertheless, the index for that market group was still 1.1 percent above its level of 12 months earlier.
Among nonindustrial supplies, the output of construction supplies decreased 1.0 percent in January following a decline of 0.6 percent in December; the index for construction supplies was 1.7 percent above its level of a year earlier. The production of business supplies edged down 0.1 percent in January but was 2.8 percent above its year-earlier level.
The production of materials to be processed further in the industrial sector moved down 0.3 percent in January, with declines in every non-energy category; nonetheless, the index for materials was 3.4 percent above its level of a year earlier. In January, the output of durable materials moved down 0.6 percent; a large decrease was recorded in the index for consumer parts, and smaller declines were registered for equipment parts and for other durable materials. The production of nondurable materials fell 0.8 percent. Among its components, both paper and chemical materials recorded relatively small decreases, while textile materials posted a decline of 1.6 percent. The output of energy materials gained 0.4 percent; increases in utilities were partly offset by reductions elsewhere, particularly in oil and natural gas extraction.
Industry Groups
The severe weather in January contributed to a decrease of 0.8 percent for manufacturing production. Output had risen in each of the previous five months, though the rates of increase for October through December are now reported to be slower than previously stated: Steel, semiconductors, motor vehicles, and organic chemicals made the largest contributions to the downward revision for the fourth quarter. The level of factory output in January was 1.3 percent above its year-earlier level. Capacity utilization for manufacturing moved down 0.7 percentage point in January to 76.0 percent, a rate 2.7 percentage points below its long-run average.
The production of durable goods moved down 0.8 percent in January, with decreases recorded in most of its major categories; nevertheless, the production of durables was 2.8 percent above its year-earlier level. In January, the largest declines were in the output of motor vehicles and parts, which dropped 5.0 percent, and in the output of wood products, which fell 2.6 percent. Smaller losses were registered by primary metals; fabricated metal products; electrical equipment, appliances, and components; aerospace and miscellaneous transportation equipment; furniture and related products; and miscellaneous manufacturing. The inclement weather in January contributed to some of these decreases: For example, numerous motor vehicle assembly facilities lost one or more days of production during the month. Gains were recorded by nonmetallic mineral products, by machinery, and by computer and electronic products. Capacity utilization for durable goods manufacturing declined 0.8 percentage point to 76.0 percent, a rate 1.0 percentage point below its long-run average.
Nondurable manufacturing output moved down 0.8 percent in January after gaining 1.2 percent in December; production was nearly unchanged from its level of a year earlier. With the exception of apparel and leather, declines were recorded for every nondurable industry group in January; weather-related plant closures contributed to some of these decreases. The largest declines—between 1 and 2 percent—came in food, beverage, and tobacco products; textile and product mills; and printing and support. Capacity utilization for nondurable manufacturing moved down to 77.4 percent, a rate 3.3 percentage points below its long-run average.
The output of non-NAICS manufacturing industries (publishing and logging) decreased 1.1 percent in January and was 3.8 percent below its level of a year earlier.
Mining output moved down 0.9 percent in January, as extremely cold weather led to slowdowns at some oil and gas extraction facilities. Capacity utilization at mines decreased to 89.2 percent, but it remained 1.8 percentage points above its long-run average. Output at electric and natural gas utilities surged 4.1 percent on strong heating demand because of the extremely cold weather; the operating rate for utilities rose to 83.3 percent, a rate 2.7 percentage points below its long-run average.
Capacity utilization rates in January at industries grouped by stage of process were as follows: At the crude stage, utilization fell 1.0 percentage point to 87.3 percent, a rate 1.0 percentage point above its long-run average; at the primary and semifinished stages, utilization increased 0.2 percentage point to 77.8 percent, a rate 3.1 percentage points below its long-run average; and at the finished stage, utilization decreased 0.8 percentage point to 75.2 percent, a rate 1.9 percentage points below its long-run average.
The data in this release include preliminary estimates of industrial capacity for 2014. Measured fourth quarter to fourth quarter, total industrial capacity is projected to rise 2.3 percent this year after having increased 1.8 percent in 2013. Manufacturing capacity is estimated to advance 1.9 percent in 2014 after having gained 1.6 percent in 2013. Capacity at mines is estimated to expand 5.5 percent in 2014 after having moved up 4.4 percent in 2013. Electric and natural gas utility capacity is projected to rise 0.7 percent this year after having increased 0.9 percent last year. These estimates will be updated with the publication on March 28, 2014, of the annual revision to industrial production, capacity, and capacity utilization.
