

 DDP
DDP Print
PrintIndustrial Production and Capacity Utilization - G.17
Current Release (272 KB PDF) (ASCII)
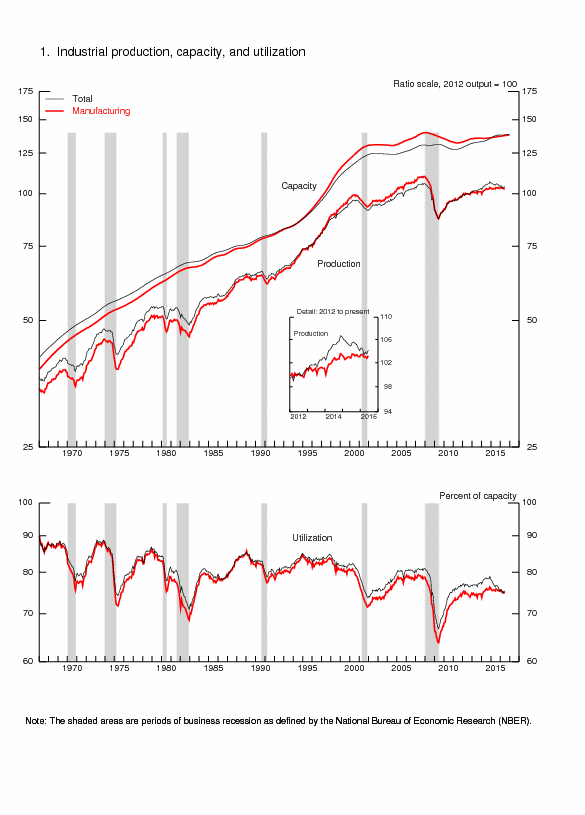
Industrial production increased 0.6 percent in June after declining 0.3 percent in May. For the second quarter as a whole, industrial production fell at an annual rate of 1.0 percent, its third consecutive quarterly decline. Manufacturing output moved up 0.4 percent in June, a gain largely due to an increase in motor vehicle assemblies. The output of manufactured goods other than motor vehicles and parts was unchanged. The index for utilities rose 2.4 percent as a result of warmer weather than is typical for June boosting demand for air conditioning. The output of mining moved up 0.2 percent for its second consecutive small monthly increase following eight straight months of decline. At 104.1 percent of its 2012 average, total industrial production in June was 0.7 percent lower than its year-earlier level. Capacity utilization for the industrial sector increased 0.5 percentage point in June to 75.4 percent, a rate that is 4.6 percentage points below its long-run (1972–2015) average.
Industrial Production and Capacity Utilization: Summary
| Industrial production | 2012=100 | Percent change | |||||||||||
|---|---|---|---|---|---|---|---|---|---|---|---|---|---|
| 2016 | 2016 | June '15 to June '16 |
|||||||||||
| Jan.[r] | Feb.[r] | Mar.[r] | Apr.[r] | May[r] | June[p] | Jan.[r] | Feb.[r] | Mar.[r] | Apr.[r] | May[r] | June[p] | ||
| Total index | 104.5 | 104.4 | 103.4 | 103.8 | 103.5 | 104.1 | .5 | -.2 | -1.0 | .5 | -.3 | .6 | -.7 |
| Previous estimates | 104.6 | 104.4 | 103.4 | 104.0 | 103.6 | .5 | -.2 | -1.0 | .6 | -.4 | |||
| Major market groups | |||||||||||||
| Final Products | 100.7 | 100.7 | 99.7 | 100.7 | 100.1 | 101.1 | .8 | .0 | -1.0 | 1.1 | -.6 | .9 | .5 |
| Consumer goods | 103.6 | 103.5 | 102.3 | 103.5 | 102.7 | 103.9 | 1.2 | -.1 | -1.2 | 1.3 | -.8 | 1.1 | 1.6 |
| Business equipment | 101.5 | 102.0 | 101.4 | 102.5 | 102.2 | 102.9 | .2 | .5 | -.6 | 1.1 | -.3 | .7 | -.6 |
| Nonindustrial supplies | 106.2 | 106.2 | 105.0 | 105.3 | 105.0 | 104.7 | .4 | .0 | -1.1 | .2 | -.2 | -.3 | -.3 |
| Construction | 110.1 | 110.0 | 109.2 | 109.4 | 108.9 | 108.0 | .0 | -.1 | -.8 | .2 | -.5 | -.8 | .0 |
| Materials | 107.1 | 106.7 | 105.8 | 105.7 | 105.7 | 106.3 | .2 | -.4 | -.9 | -.1 | .0 | .6 | -1.9 |
| Major industry groups | |||||||||||||
| Manufacturing (see note below) | 103.4 | 103.4 | 103.0 | 103.0 | 102.8 | 103.2 | .4 | .0 | -.4 | .1 | -.3 | .4 | .4 |
| Previous estimates | 103.5 | 103.4 | 103.0 | 103.2 | 102.8 | .4 | .0 | -.4 | .2 | -.4 | |||
| Mining | 108.2 | 107.7 | 105.1 | 102.2 | 102.5 | 102.7 | -1.8 | -.5 | -2.4 | -2.8 | .3 | .2 | -10.5 |
| Utilities | 101.5 | 100.4 | 96.3 | 102.3 | 101.4 | 103.8 | 3.6 | -1.1 | -4.0 | 6.2 | -.9 | 2.4 | .5 |
| Capacity utilization | Percent of capacity | Capacity growth |
|||||||||||
|---|---|---|---|---|---|---|---|---|---|---|---|---|---|
| Average 1972- 2015 |
1988- 89 high |
1990- 91 low |
1994- 95 high |
2009 low |
2015 June |
||||||||
| 2016 | June '15 to June '16 |
||||||||||||
| Jan.[r] | Feb.[r] | Mar.[r] | Apr.[r] | May[r] | June[p] | ||||||||
| Total industry | 80.0 | 85.3 | 78.8 | 85.0 | 66.7 | 76.4 | 75.7 | 75.6 | 74.8 | 75.2 | 74.9 | 75.4 | .6 |
| Previous estimates | 75.8 | 75.6 | 74.8 | 75.3 | 74.9 | ||||||||
| Manufacturing (see note below) | 78.5 | 85.6 | 77.3 | 84.6 | 63.8 | 75.3 | 75.5 | 75.4 | 75.1 | 75.1 | 74.8 | 75.1 | .8 |
| Previous estimates | 75.5 | 75.4 | 75.1 | 75.2 | 74.8 | ||||||||
| Mining | 87.3 | 86.2 | 83.8 | 88.6 | 79.0 | 81.3 | 76.3 | 76.1 | 74.5 | 72.7 | 73.2 | 73.6 | -1.1 |
| Utilities | 85.8 | 93.2 | 84.7 | 93.2 | 78.2 | 79.4 | 77.7 | 76.9 | 73.7 | 78.2 | 77.5 | 79.3 | .6 |
| Stage-of-process groups | |||||||||||||
| Crude | 86.3 | 87.6 | 84.5 | 90.1 | 77.0 | 80.2 | 76.7 | 76.4 | 75.8 | 74.3 | 74.9 | 75.2 | -.9 |
| Primary and semifinished | 80.6 | 86.5 | 78.1 | 87.8 | 63.8 | 76.3 | 75.9 | 75.6 | 74.4 | 75.2 | 74.8 | 75.3 | .8 |
| Finished | 77.0 | 83.4 | 77.3 | 80.6 | 66.6 | 75.1 | 75.3 | 75.3 | 75.1 | 75.3 | 75.0 | 75.4 | .8 |
Market Groups
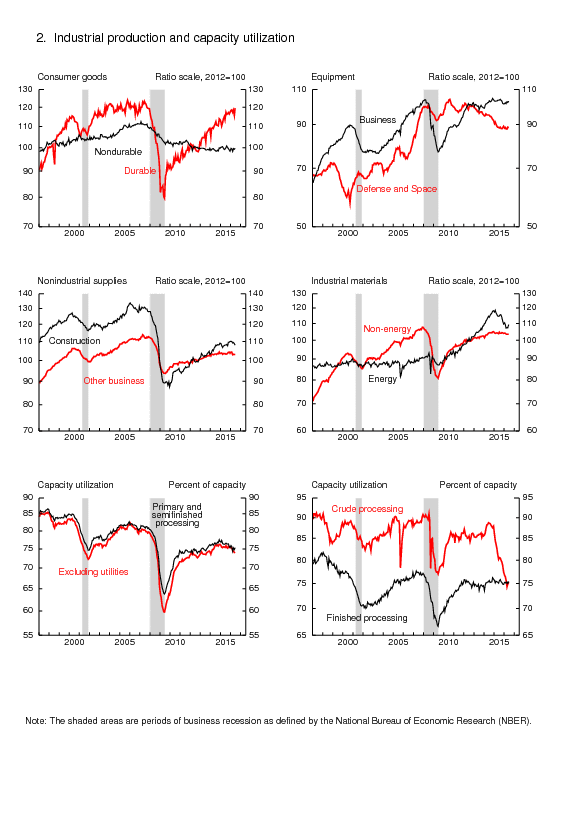
The output of consumer goods rose 1.1 percent in June. The production of consumer durables climbed 3.4 percent, primarily because of a jump in the index for automotive products. The output of consumer energy products also posted a substantial gain, 2.5 percent, but the index for consumer non-energy nondurables was unchanged. The index for business equipment moved up 0.7 percent, as a decrease for information processing equipment was outweighed by gains for transit equipment and for industrial and other equipment. The index for defense and space equipment moved down 0.3 percent. Construction supplies recorded a decrease for a second consecutive month; likewise, the output of business supplies also declined in each of the past two months, though the losses were very small. The production of materials increased 0.6 percent in June, with gains for durable materials and energy materials but a decline for nondurable materials. The improvement in durable materials reflected a sharp advance in the output of consumer parts that resulted from increased output of motor vehicle parts; the other major categories of durable materials recorded decreases. The increase for energy materials was primarily attributable to substantial gains in power generation and coal mining.
Industry Groups
Manufacturing output rose 0.4 percent in June; for the second quarter, however, factory output decreased at an annual rate of 1.0 percent. The production of durables jumped 0.9 percent in June, the production of nondurables edged down 0.1 percent, and the production of other manufacturing (publishing and logging) fell 1.5 percent. Within durables, gains of greater than 1 percent were registered by machinery; electrical equipment, appliances, and components; and motor vehicles and parts. Within nondurables, apparel and leather, paper, chemicals, and plastics and rubber products recorded declines that were largely offset by increases elsewhere; the largest gain was registered by printing and support.
The index for mining edged up 0.2 percent in June. A rise in the index for oil well drilling and servicing and a second consecutive large monthly increase in the index for coal more than offset declines in oil and gas extraction and in non-metallic mineral mining.
Capacity utilization for manufacturing increased 0.3 percentage point in June to 75.1 percent, a rate that is 3.4 percentage points below its long-run average. The operating rate for durables moved up 0.6 percentage point to 76.1 percent, while the rates for nondurables and other manufacturing (publishing and logging) fell to 74.8 percent and 62.5 percent, respectively. The operating rate for mining moved up 0.4 percentage point to 73.6 percent, and the rate for utilities jumped nearly 2 percentage points to 79.3 percent.
Note: Revised Estimates of Industrial CapacityThe estimates for industrial capacity for 2016 were revised for this release. The revisions reflect updated measures of physical capacity from various government and private sources as well as updated estimates of capital spending by industry. Capacity for the industrial sector, measured from the fourth quarter of 2015 to the fourth quarter of 2016, is now expected to increase 0.4 percent, a rate that is 0.1 percentage point lower than previously estimated. Manufacturing capacity is now expected to rise 0.7 percent, a pace 0.2 percentage point less than the previous estimate; a smaller increase in the capacity for manufacturing of selected high-technology goods accounts for the downward revision. The decrease in mining capacity for 2016 is unrevised at 3.4 percent, and the gain in capacity for utilities is also unrevised at 0.8 percent.
Note. The statistics in this release cover output, capacity, and capacity utilization in the U.S. industrial sector, which is defined by the Federal Reserve to comprise manufacturing, mining, and electric and gas utilities. Mining is defined as all industries in sector 21 of the North American Industry Classification System (NAICS); electric and gas utilities are those in NAICS sectors 2211 and 2212. Manufacturing comprises NAICS manufacturing industries (sector 31-33) plus the logging industry and the newspaper, periodical, book, and directory publishing industries. Logging and publishing are classified elsewhere in NAICS (under agriculture and information respectively), but historically they were considered to be manufacturing and were included in the industrial sector under the Standard Industrial Classification (SIC) system. In December 2002 the Federal Reserve reclassified all its industrial output data from the SIC system to NAICS.