Financial Accounts of the United States - Z.1
Recent Developments RSS Data Download
The recent developments discussed below refer to data through December 31, 2022.
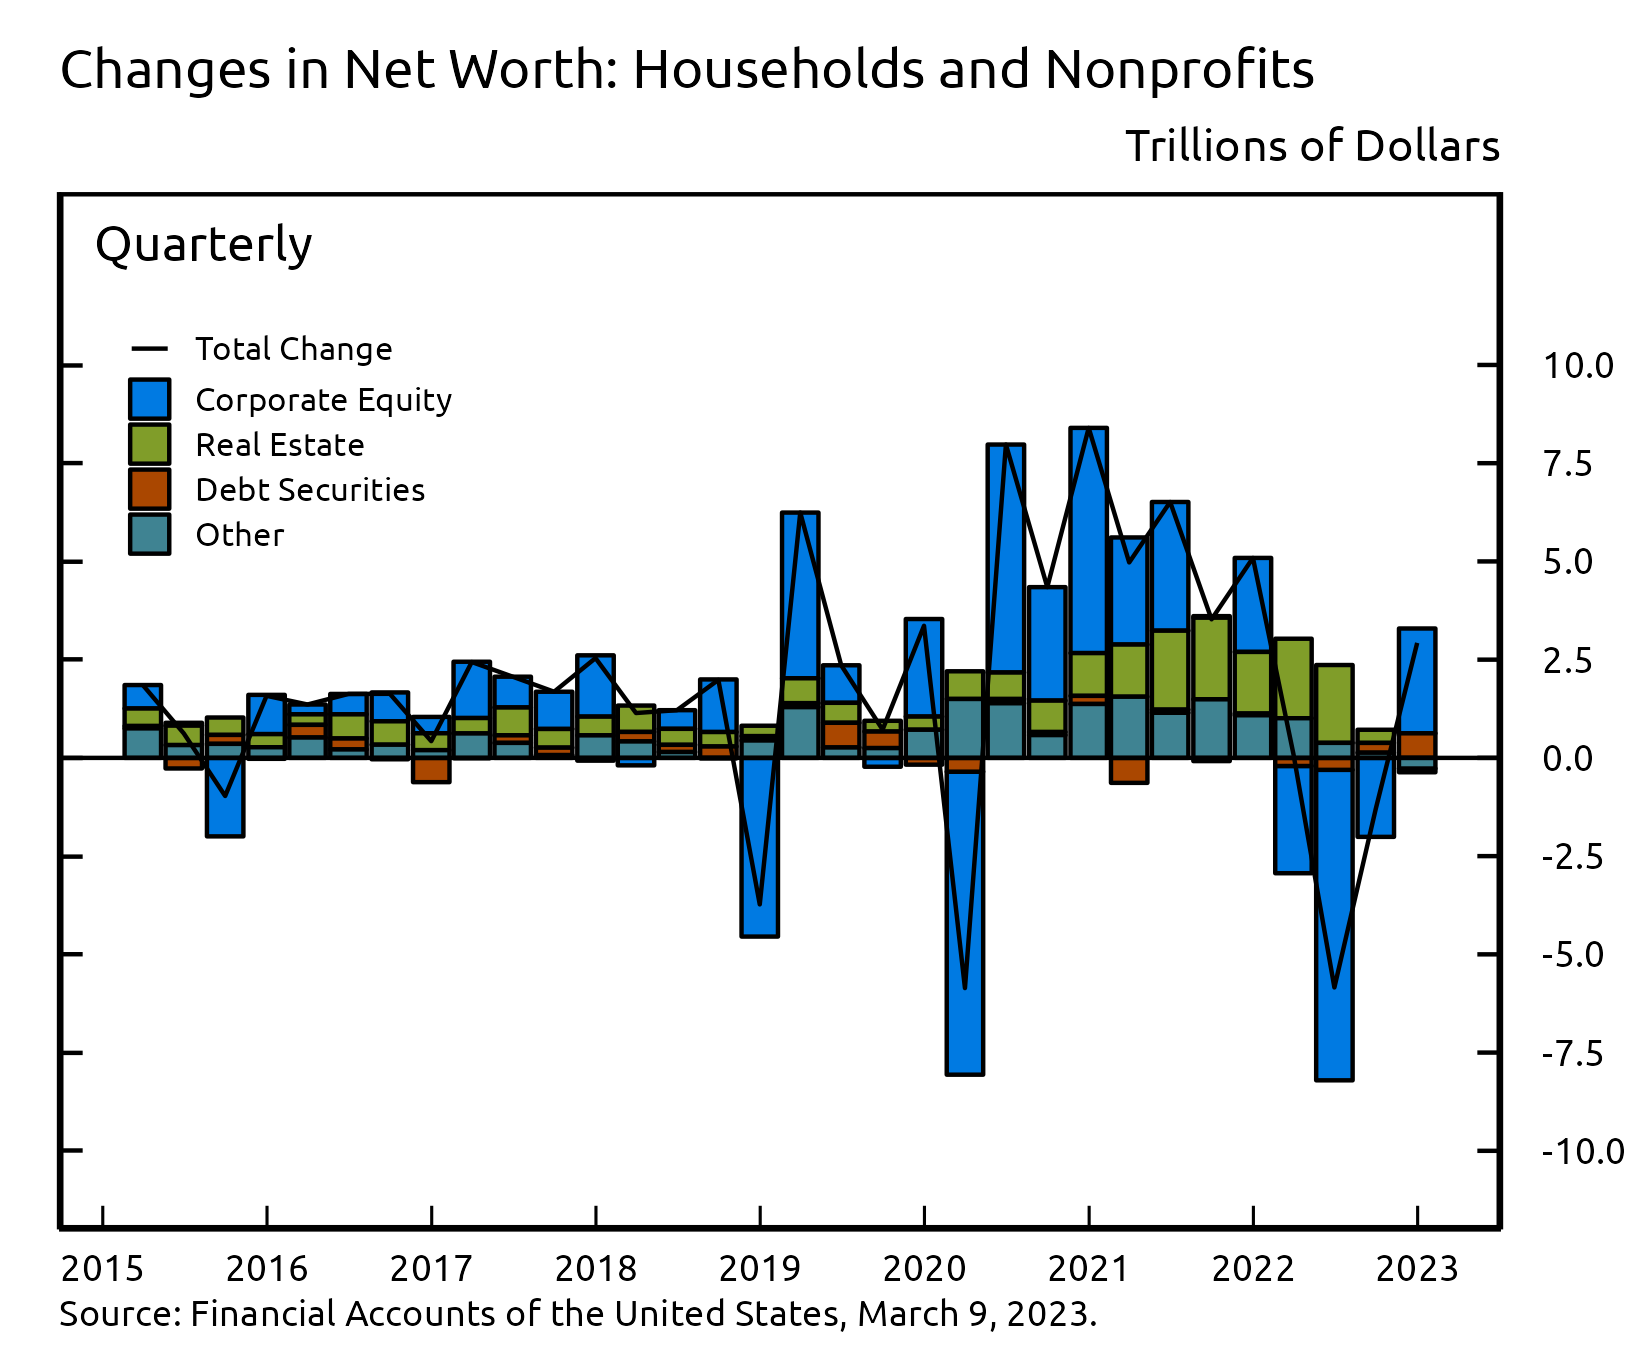
- Household net worth increased by $2.9 trillion in the fourth quarter, primarily driven by gains on corporate equity.
- Consumer credit continued to expand at a relatively robust 7% pace, while overall household debt growth slowed to an annual pace of 2.3% amid a slowdown in mortgage growth and a decline in other debt.
- Nonfinancial business debt increased at an annual rate of 3.6%, mainly reflecting growth in mortgages and other loans.
Household Net Worth
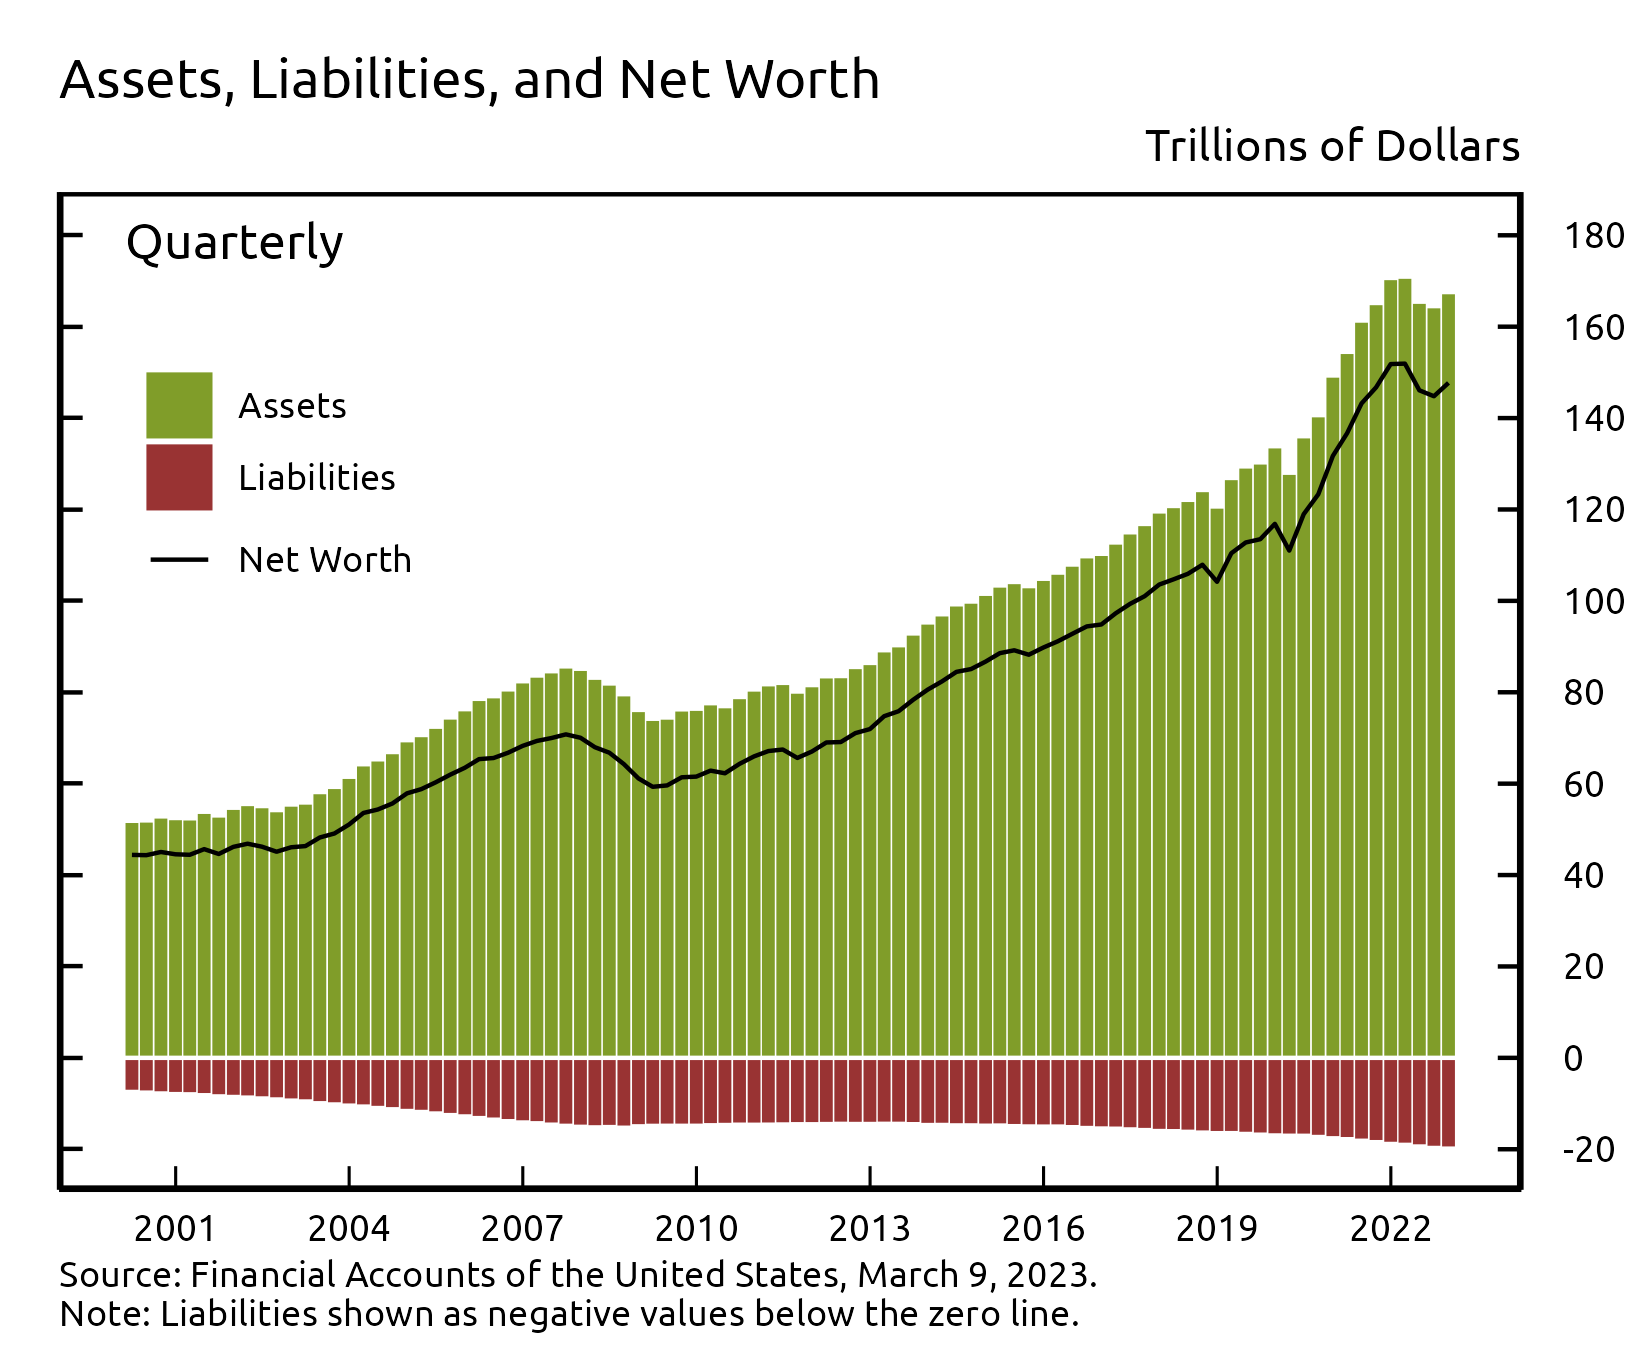
The net worth of households and nonprofit organizations increased $2.9 trillion to $147.7 trillion in the fourth quarter. The value of stocks on the household balance sheet increased by $2.7 trillion, while the value of real estate decreased by $0.1 trillion.
View interactive | Accessible version | CSV | Data Dictionary | Chart Note (1) |
Directly and indirectly held corporate equities ($39.4 trillion) and household real estate ($43.5 trillion) were among the largest components of household net worth. Household debt (seasonally adjusted) was $19.0 trillion.
View interactive | Accessible version | CSV | Data Dictionary |
Household Balance Sheet Summary
| Description | 2021 | 2022 | 2022:Q1 | 2022:Q2 | 2022:Q3 | 2022:Q4 |
|---|---|---|---|---|---|---|
| Net Worth | 151.82 | 147.71 | 151.92 | 146.07 | 144.78 | 147.71 |
| Change in Net Worth | 20.10 | -4.11 | 0.10 | -5.84 | -1.29 | 2.93 |
| Equities | 49.40 | 39.42 | 46.67 | 38.76 | 36.75 | 39.42 |
| Change in Equities | 8.43 | -9.97 | -2.73 | -7.90 | -2.01 | 2.67 |
| Real Estate | 39.27 | 43.50 | 41.33 | 43.29 | 43.57 | 43.50 |
| Change in Real Estate | 6.36 | 4.23 | 2.06 | 1.96 | 0.27 | -0.07 |
For more data on household net worth, see table B.101
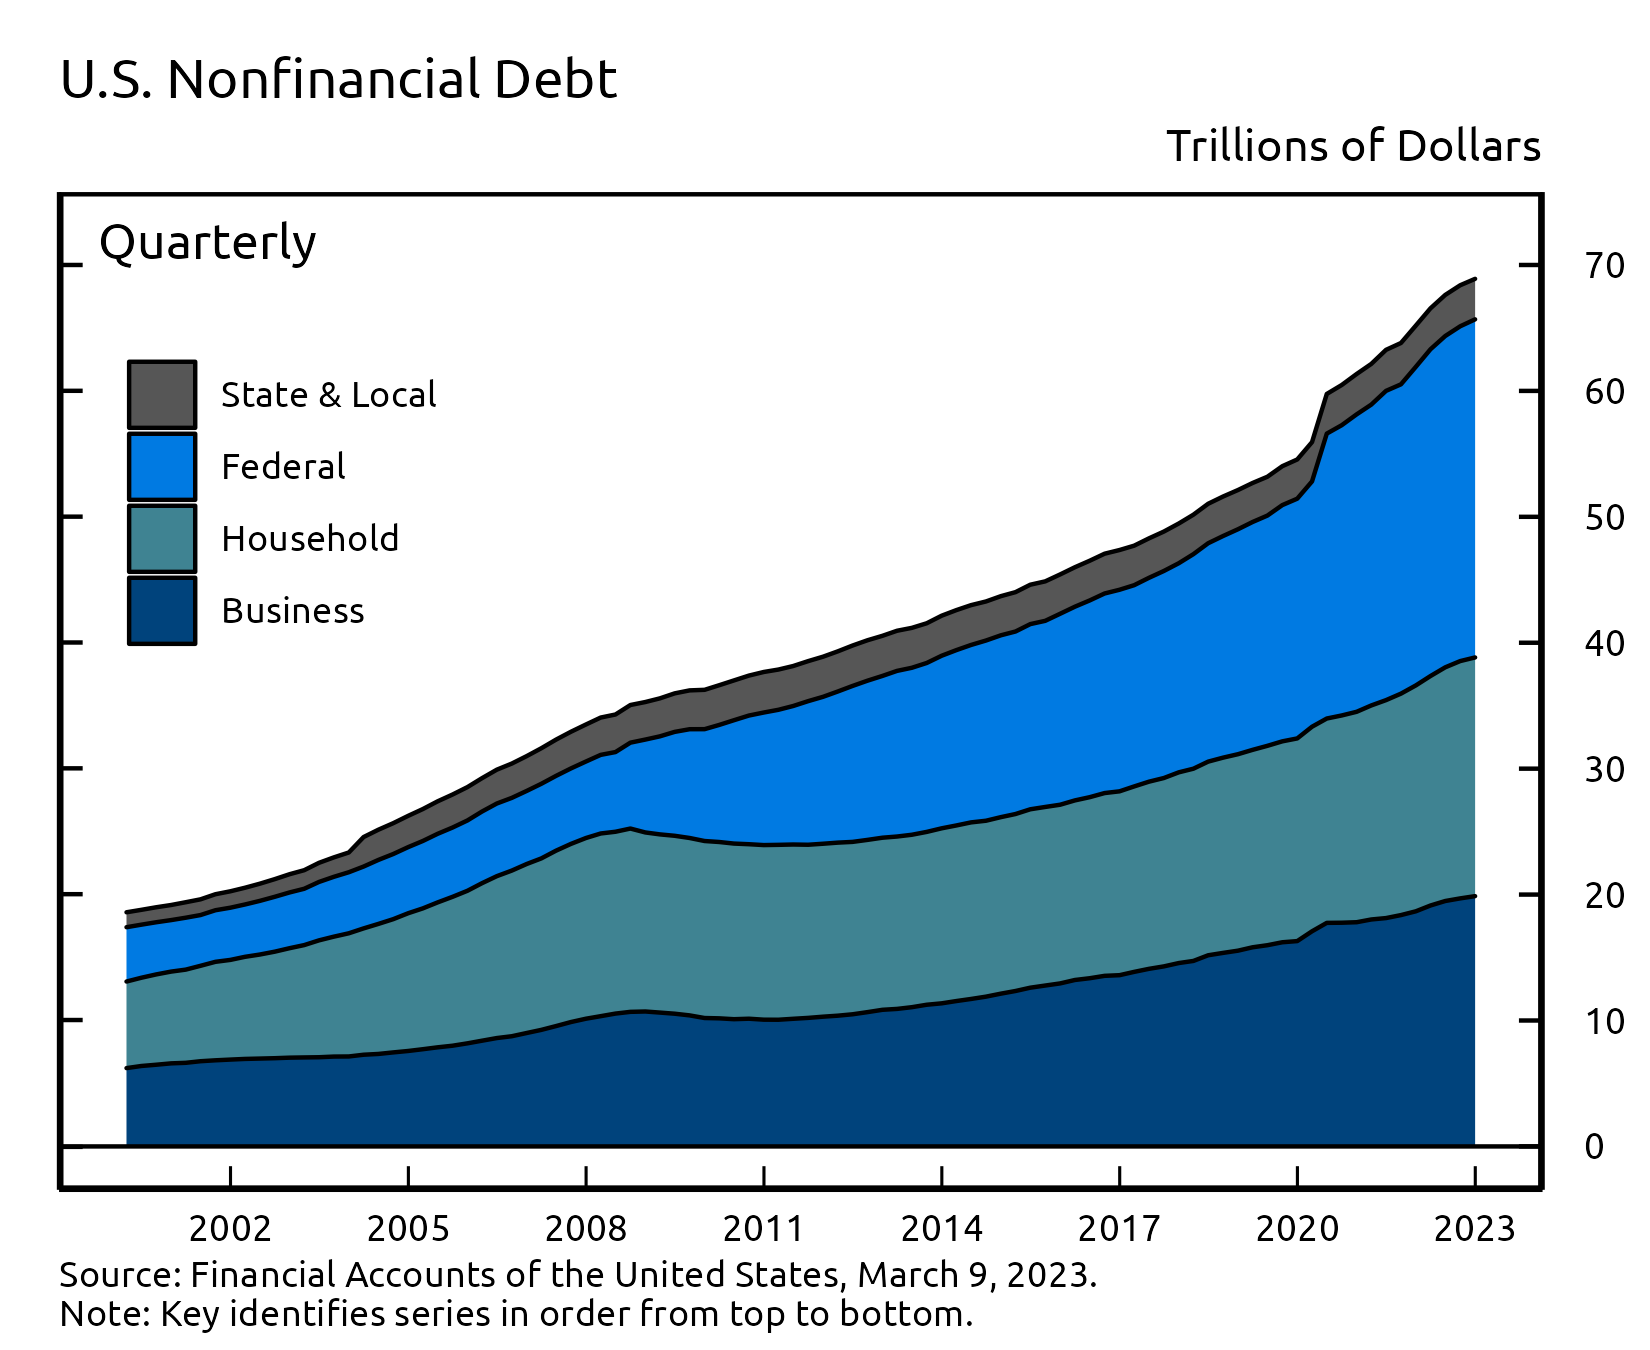
Nonfinancial debt
Household debt grew by 2.3% in the fourth quarter of 2022 (this and subsequent rates of growth are reported at a seasonally adjusted annual rate), a substantial slowdown from the average 7% pace of growth posted since the middle of 2020. Home mortgage debt expanded 4.4% while nonmortgage consumer credit increased by 7.0%.
Nonfinancial business debt grew at a 3.6% pace, reflecting negative net issuance of corporate debt securities that was more than offset by continued growth in mortgages and other loans. Federal debt increased by 4.0%, while state and local debt contracted by 5.1%.
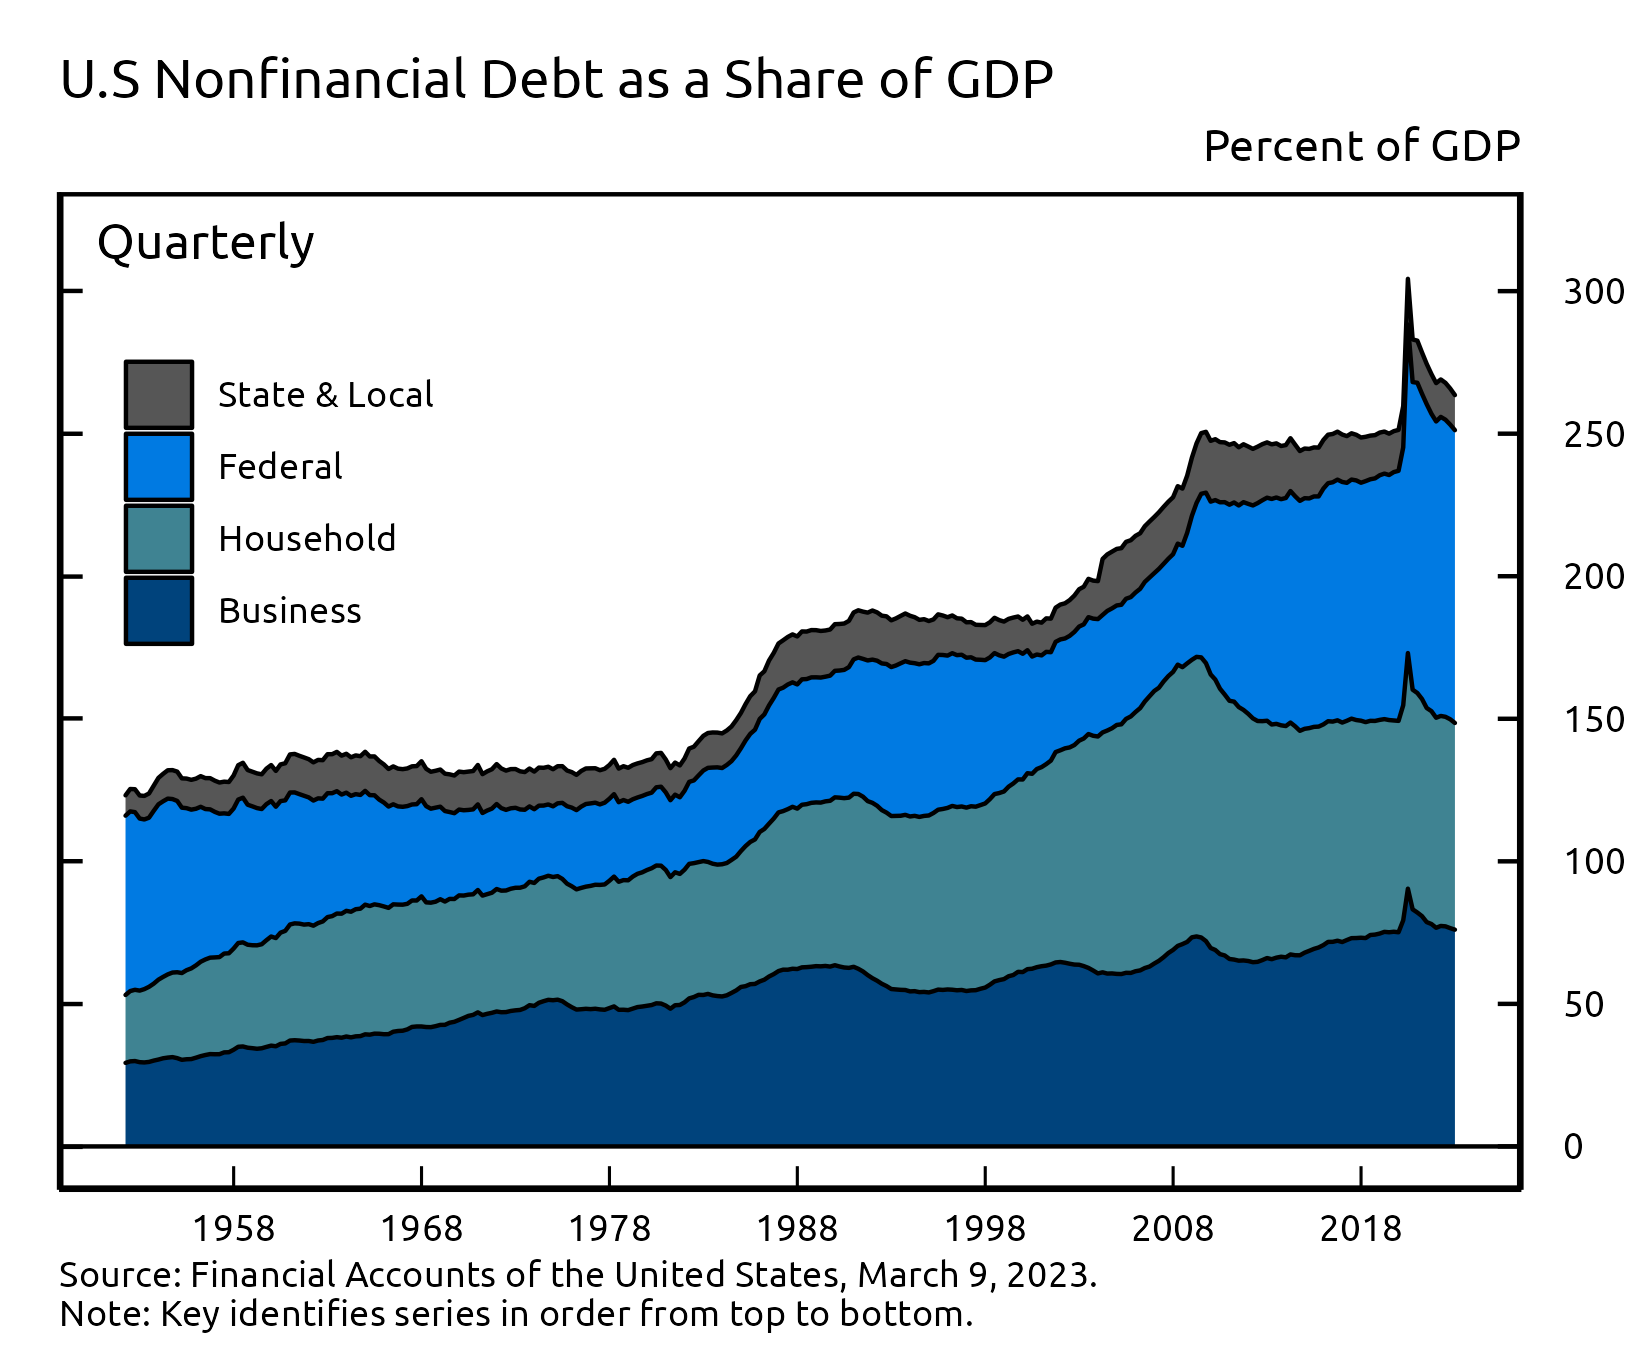
The ratio of nonfinancial debt to GDP edged down in the fourth quarter. The ratio has declined substantially since the second quarter of 2020, when the measure spiked amid a pandemic-induced drop in GDP and the expansion in federal debt related to the fiscal stimulus.
For more data on nonfinancial debt, see table D.1 (rates of growth) and table D.3 (outstanding).
Debt Growth by Sector
| Description | 2021 | 2022 | 2022:Q1 | 2022:Q2 | 2022:Q3 | 2022:Q4 |
|---|---|---|---|---|---|---|
| Total Nonfinancial | 6.30 | 5.67 | 8.39 | 6.32 | 4.54 | 3.00 |
| Households and Nonprofits | 7.38 | 6.16 | 8.26 | 7.36 | 6.23 | 2.35 |
| Nonfinancial Business | 4.95 | 5.90 | 7.99 | 7.16 | 4.26 | 3.64 |
| Federal Government | 7.13 | 6.11 | 10.22 | 5.56 | 4.19 | 3.98 |
| State and Local Governments | 2.14 | -1.75 | -2.83 | 1.54 | -0.57 | -5.15 |
Debt Outstanding by Sector
| Description | 2021 | 2022 | 2022:Q1 | 2022:Q2 | 2022:Q3 | 2022:Q4 |
|---|---|---|---|---|---|---|
| Total Nonfinancial | 65.19 | 68.90 | 66.56 | 67.62 | 68.39 | 68.90 |
| Households and Nonprofits | 17.94 | 18.96 | 18.22 | 18.56 | 18.85 | 18.96 |
| Nonfinancial Business | 18.67 | 19.88 | 19.13 | 19.49 | 19.70 | 19.88 |
| Federal Government | 25.30 | 26.85 | 25.95 | 26.31 | 26.59 | 26.85 |
| State and Local Governments | 3.27 | 3.22 | 3.25 | 3.26 | 3.26 | 3.22 |
Accessible version | CSV | Data Dictionary |
Accessible version | CSV | Data Dictionary |
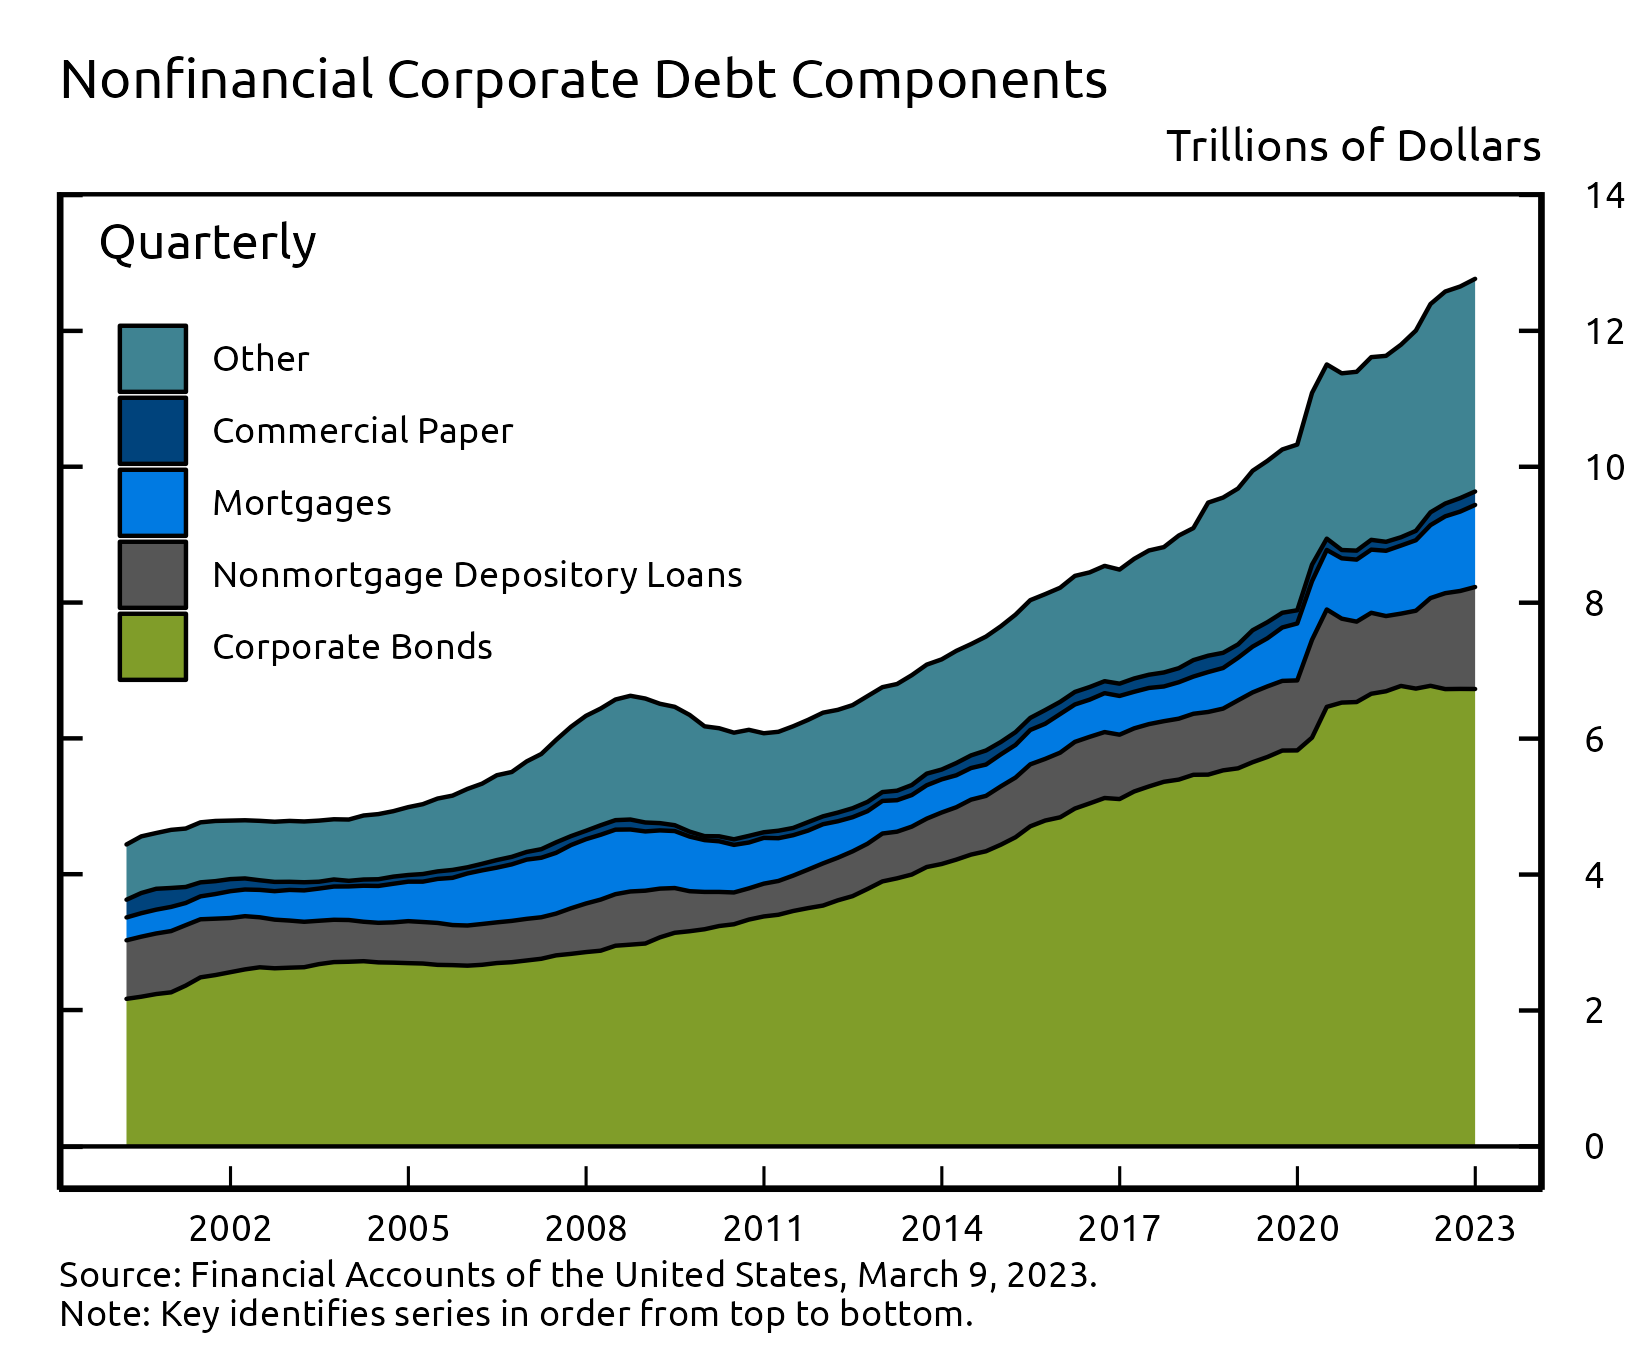
Looking at the various components of nonfinancial business debt, nonmortgage depository loans to nonfinancial business increased by $85 billion in the fourth quarter. Other types of loans, including mortgage loans and loans from nondepository institutions, also increased, while corporate bonds outstanding decreased slightly.
Overall, outstanding nonfinancial corporate debt was $12.8 trillion. Corporate bonds, at roughly $6.7 trillion, accounted for 53% of the total. Nonmortgage depository loans were about $1.5 trillion. Other types of debt include loans from nonbank institutions, loans from the federal government, and commercial paper.
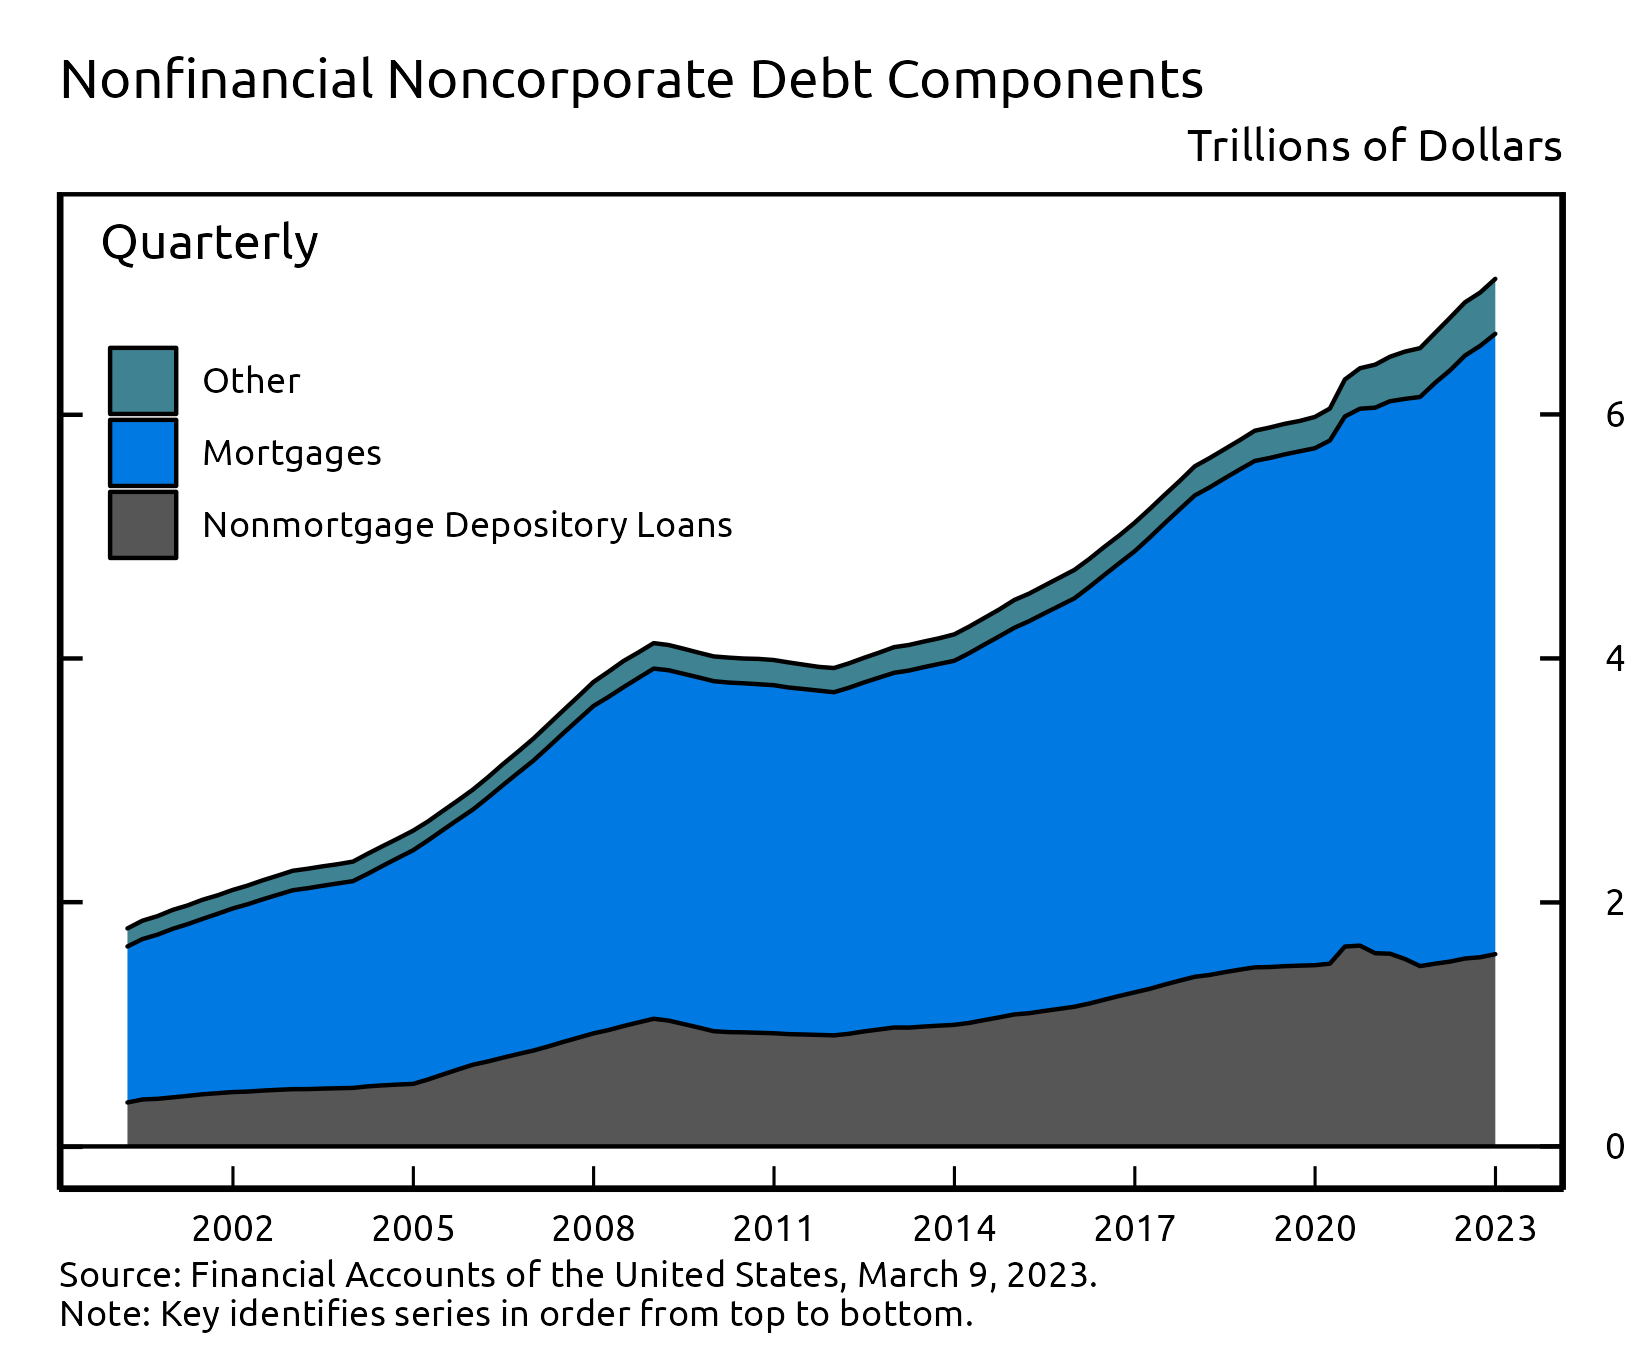
The nonfinancial noncorporate business sector consists mostly of smaller businesses, which are typically not incorporated. Nonfinancial noncorporate business debt was $7.1 trillion in the fourth quarter. Mortgage loans, at roughly $5.1 trillion, accounted for about 72% of the total, while nonmortgage depository loans ($1.6 trillion) accounted for most of the remainder.
Accessible version | CSV | Data Dictionary |
Accessible version | CSV | Data Dictionary |
For more data on nonfinancial business balance sheets, including debt, see tables B.103 and B.104.
Coming soon
- Enhanced Financial Accounts Projects
(www.federalreserve.gov/releases/efa/enhanced-financial-accounts.htm)
will be updated on Friday, March 24, 2023, including the
Distributional Financial Accounts, which provide a quarterly
estimate of the distribution of U.S. household wealth.
- The upcoming update of the Enhanced Financial Accounts will also include the beta release of a new project that provides preliminary estimates of issuer-to-holder relationships by instrument (From-Whom-to-Whom relationships) within the Financial Accounts.
- Financial Accounts data for the first quarter of 2023 will be published on Thursday, June 8, 2023, at 12:00 noon.
Chart Notes
- Changes in net worth consist of transactions, revaluations, and other volume changes. Corporate equity and debt securities include directly and indirectly held securities. Real estate is the value of owner-occupied real estate. Other includes equity in noncorporate businesses, consumer durable goods, fixed assets of nonprofit organizations, and all other financial assets apart from corporate equities and debt securities, net of liabilities, as shown on table B.101 Balance Sheet of Households and Nonprofit Organizations.