Financial Accounts of the United States - Z.1
Recent Developments RSS Data Download
This release reports data through March 31, 2020.
- Household net worth declined $6.5 trillion, primarily owing to a large decline in stock prices.
- Household debt grew at an annual rate of 3.9%.
- Nonfinancial business debt expanded at an annual rate of 18.8%, driven by a very rapid expansion in depository loans,1 as well as robust bond issuance.
Household Net Worth
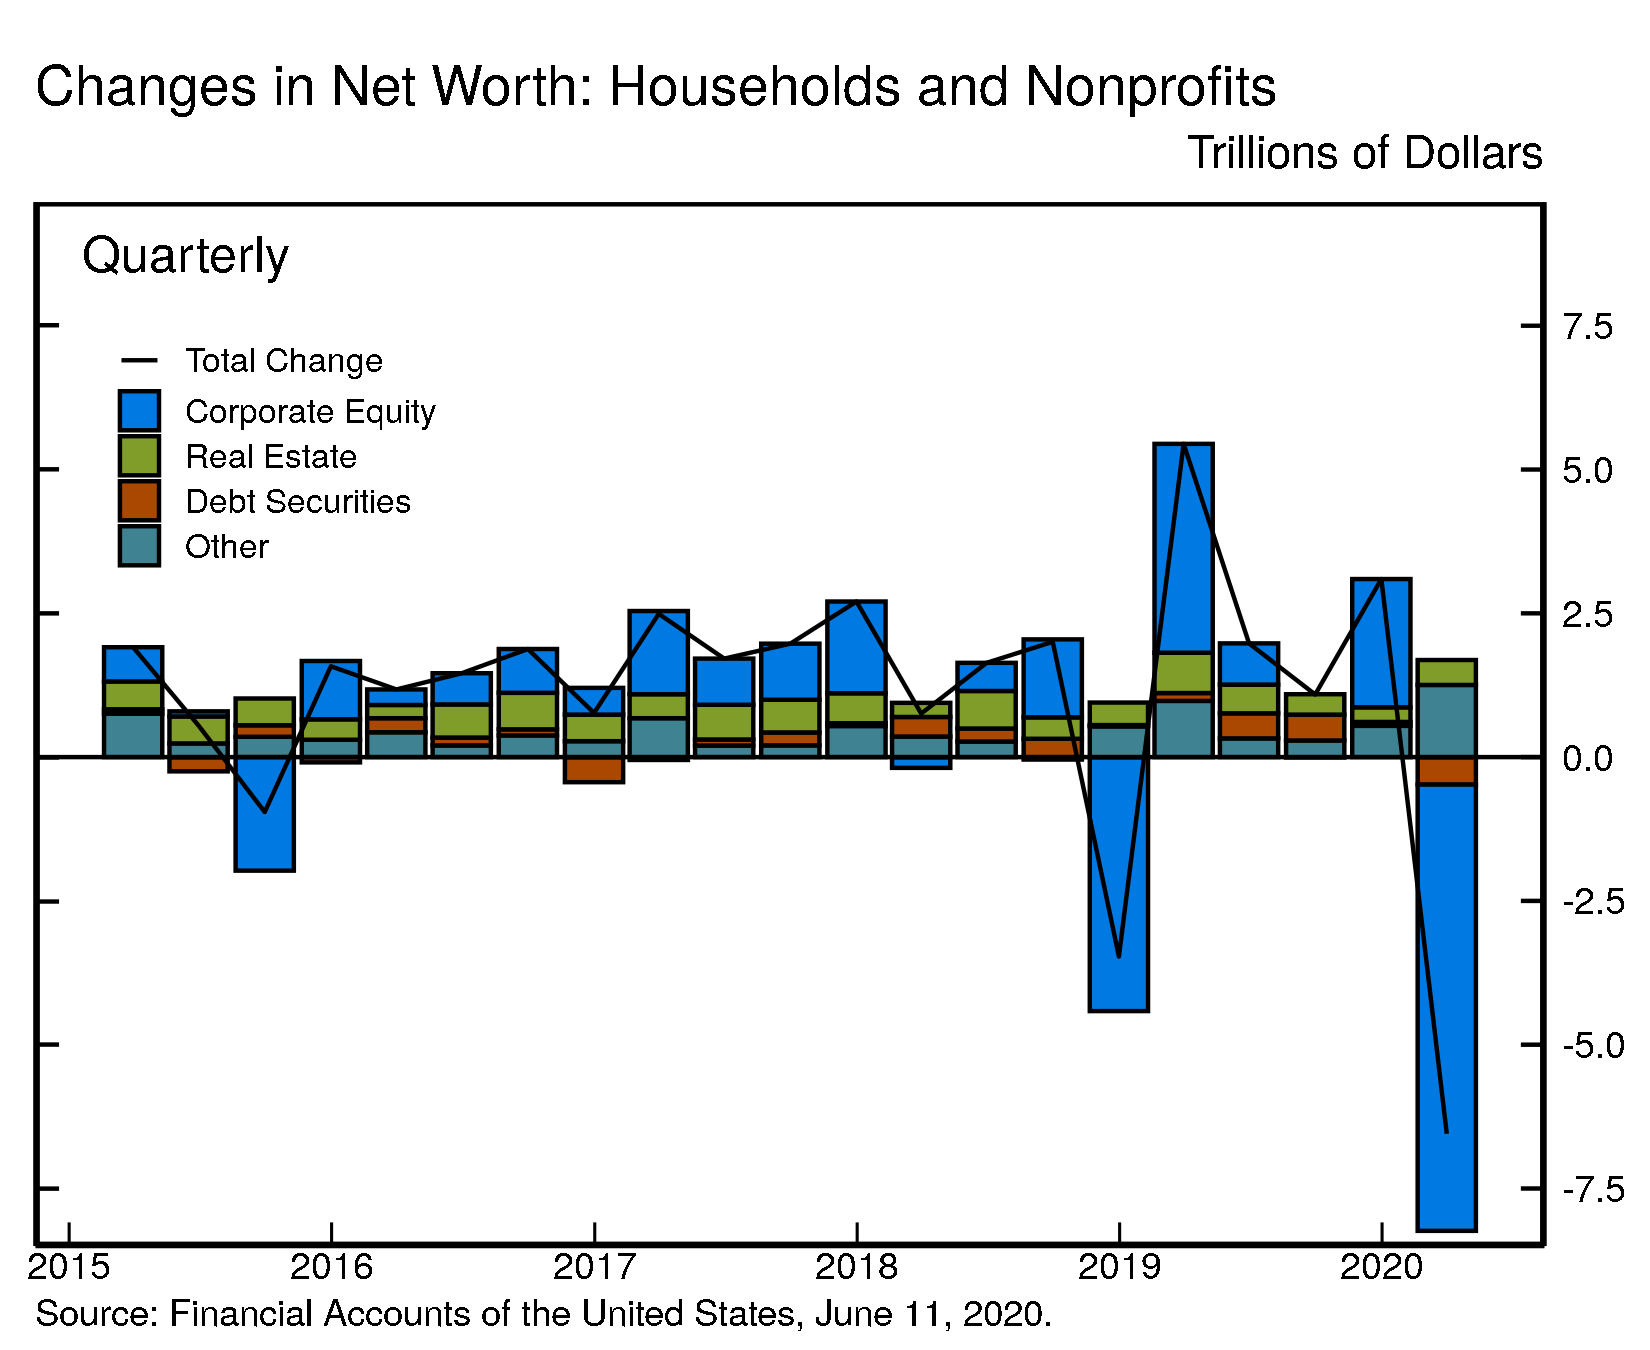
The net worth of household and nonprofit organizations fell by $6.5 trillion to $110.8 trillion. The value of directly and indirectly held corporate equities declined sharply by $7.8 trillion due to large declines in corporate equity prices. In contrast, the value of real estate held by households increased modestly.
View interactive | Accessible version | CSV | Data Dictionary | Chart Note (1) |
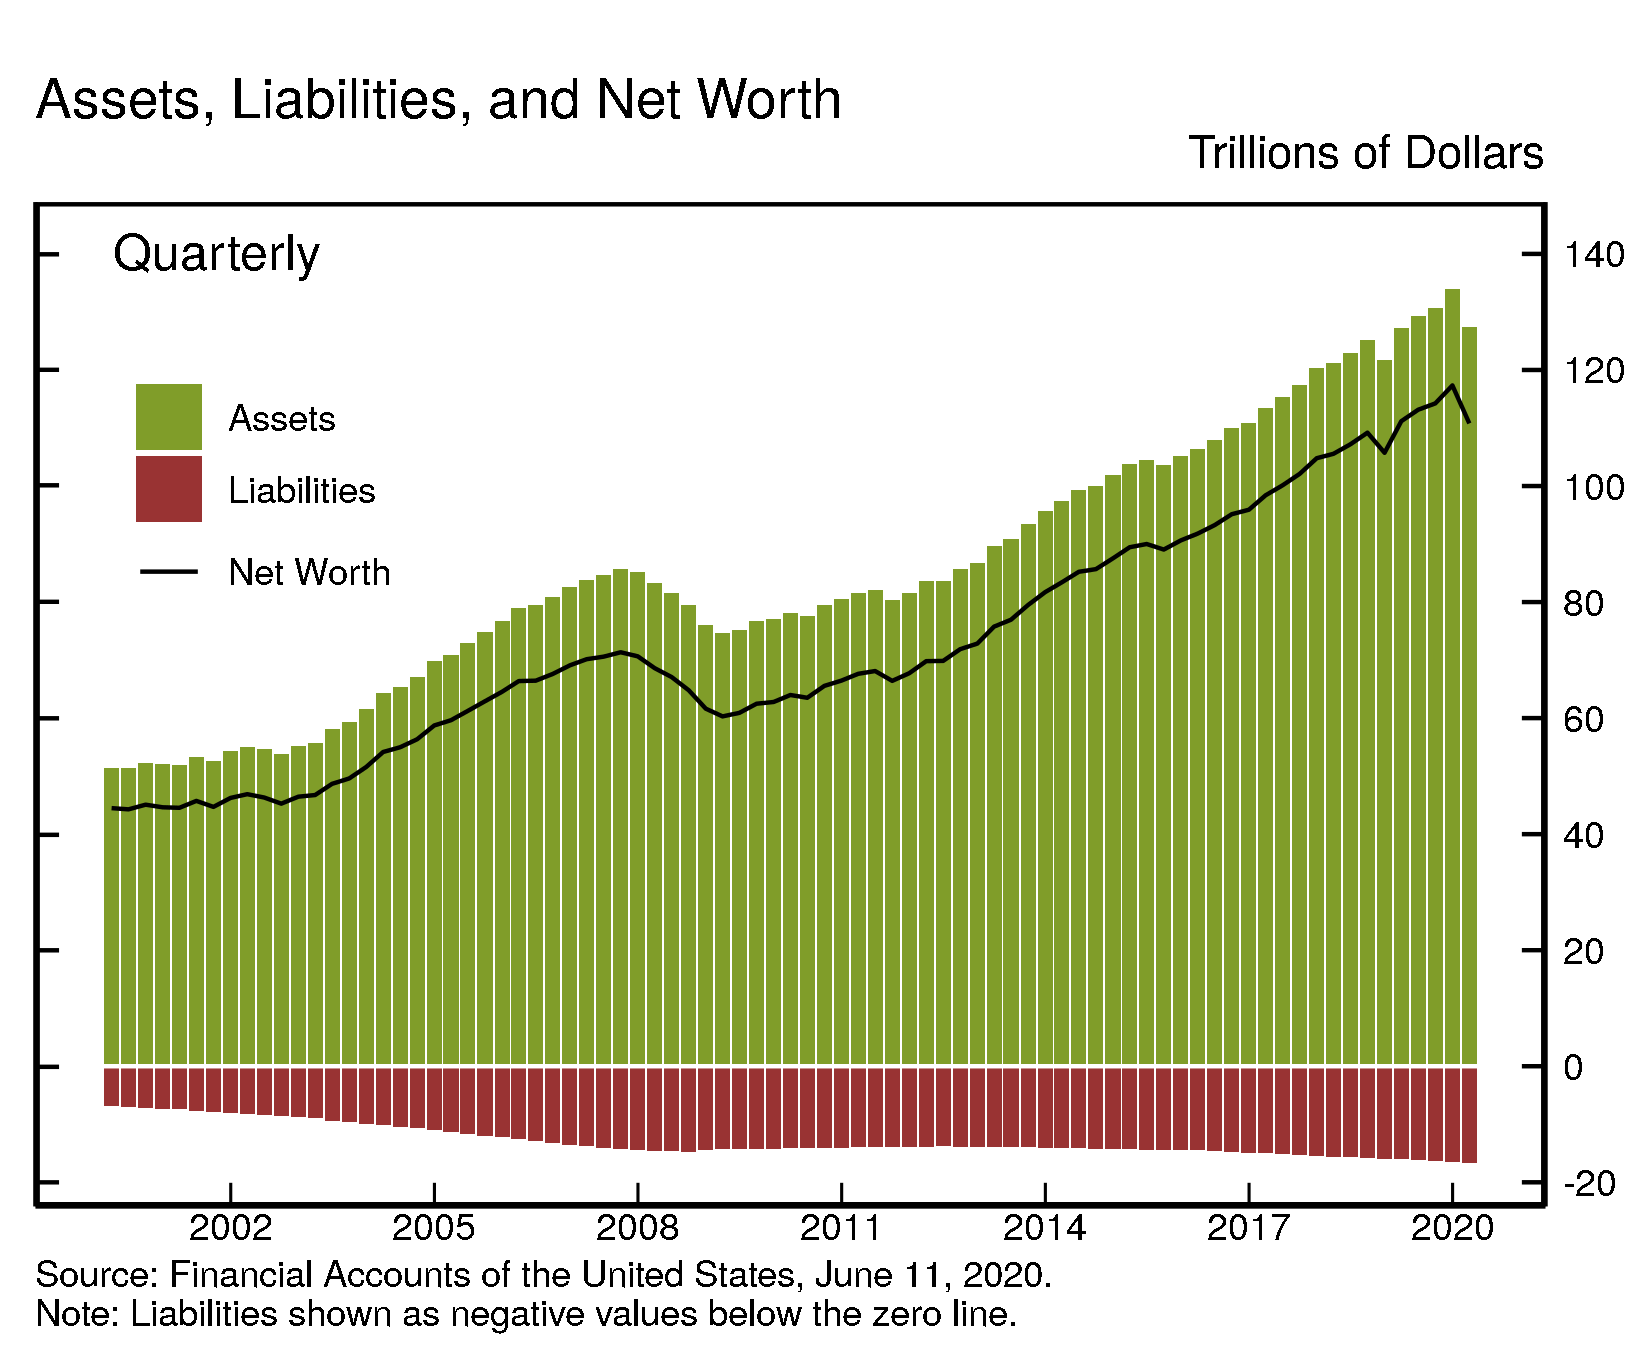
Real estate ($30.3 trillion) and directly and indirectly held corporate equities ($26.1 trillion) were among the largest components of household net worth. Household debt (seasonally adjusted) was $16.3 trillion.
View interactive | Accessible version | CSV | Data Dictionary |
Household Balance Sheet Summary
| Description | 2018 | 2019 | 2019:Q2 | 2019:Q3 | 2019:Q4 | 2020:Q1 |
|---|---|---|---|---|---|---|
| Net Worth | 105.73 | 117.34 | 113.15 | 114.24 | 117.34 | 110.79 |
| Change in Net Worth | 0.93 | 11.61 | 1.98 | 1.09 | 3.10 | -6.55 |
| Equities | 27.33 | 33.91 | 31.68 | 31.68 | 33.91 | 26.15 |
| Change in Equities | -2.76 | 6.57 | 0.72 | -0.01 | 2.23 | -7.76 |
| Real Estate | 28.38 | 29.93 | 29.35 | 29.61 | 29.93 | 30.32 |
| Change in Real Estate | 1.58 | 1.55 | 0.36 | 0.27 | 0.32 | 0.39 |
For more data on household net worth, see table B.101
Nonfinancial debt
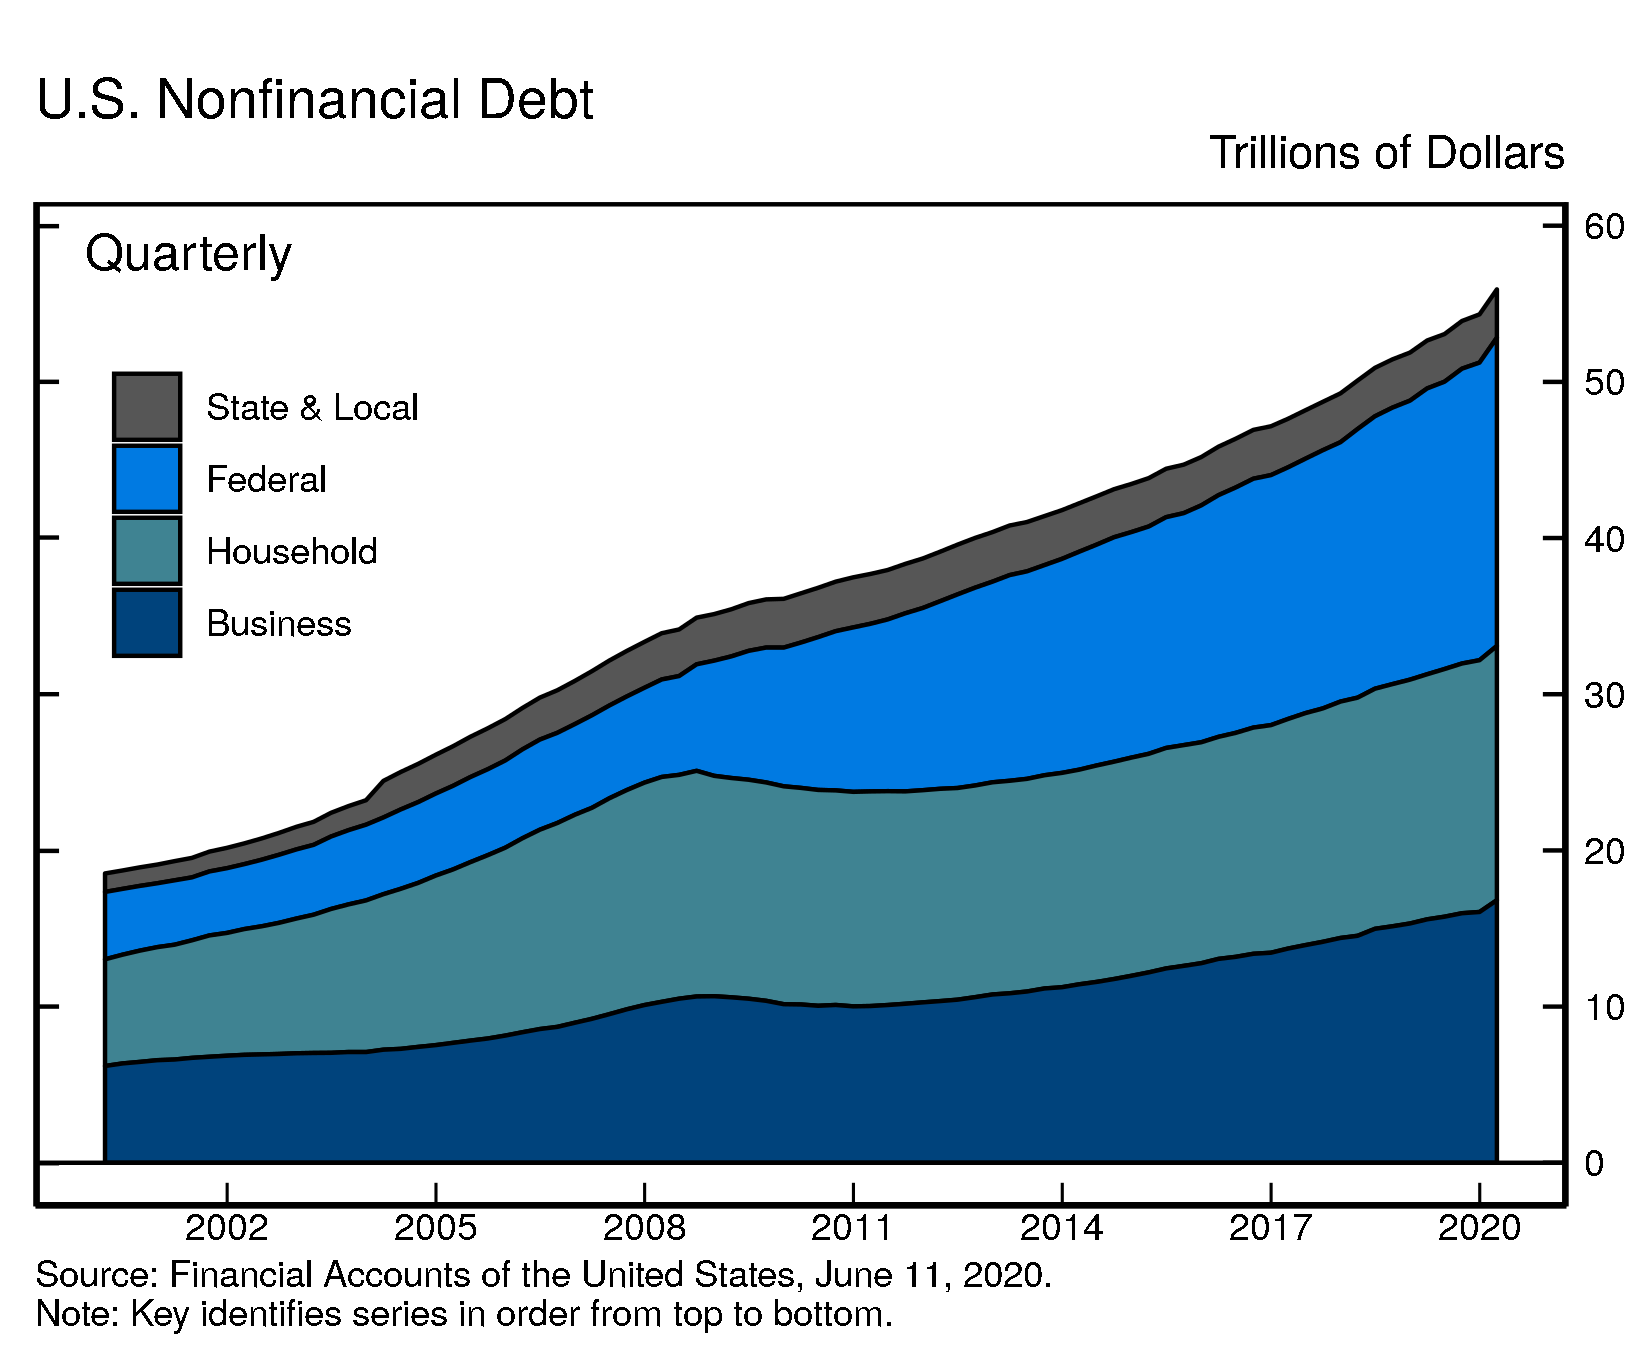
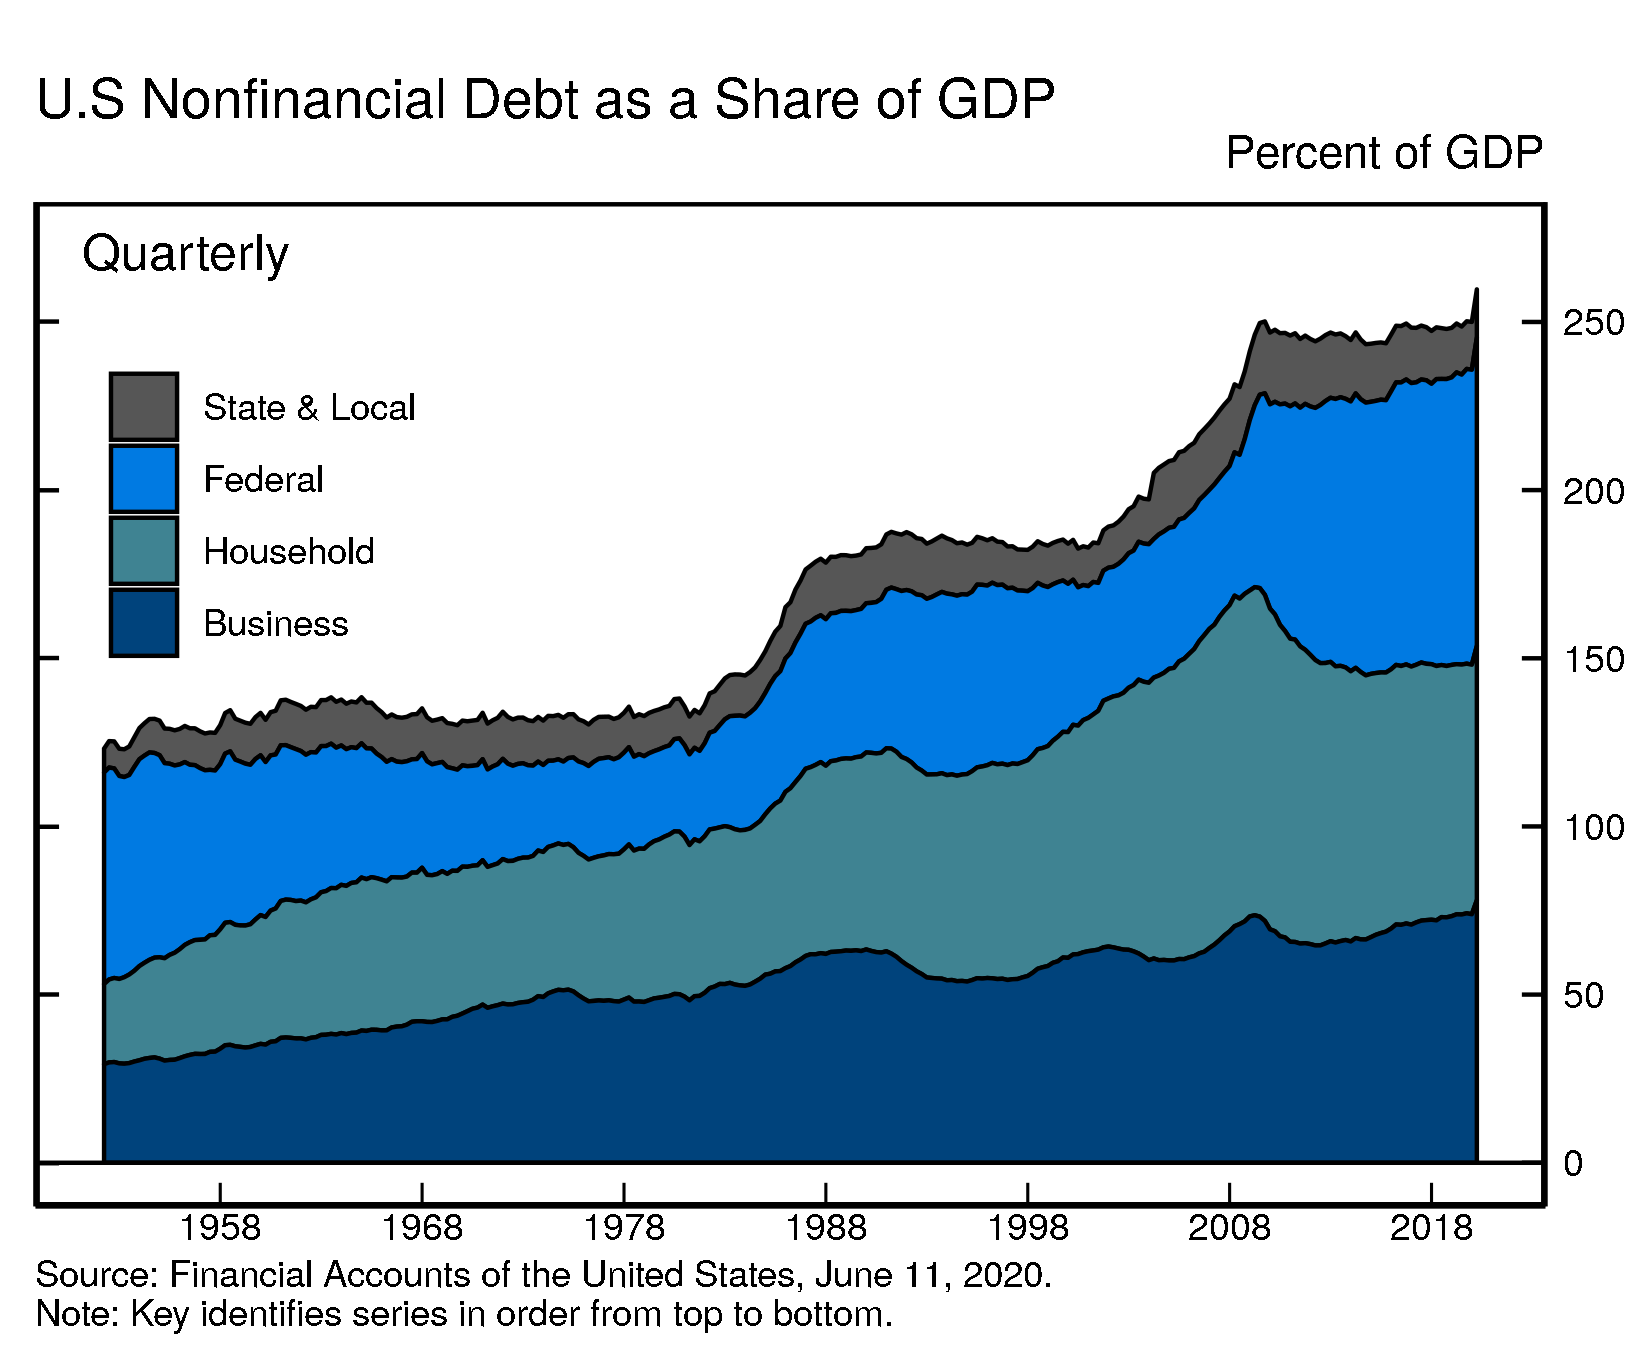
Household debt grew 3.9% in the first quarter of 2020 (this and subsequent rates of growth are reported at a seasonally adjusted annual rate). Home mortgages increased 3.2%, about in line with previous quarters. Nonmortgage consumer credit increased a modest 1.6%, down from previous quarters, primarily owing to a contraction in credit card balances. Nonfinancial business debt expanded rapidly at an annual rate of 18.8%, with a notable expansion in depository loans and robust corporate bond issuance. Federal debt expanded 14.3% while state and local debt was about flat.
For more data on nonfinancial debt, see table D.1 (rates of growth) and table D.3 (outstanding).
Debt Growth by Sector
| Description | 2018 | 2019 | 2019:Q2 | 2019:Q3 | 2019:Q4 | 2020:Q1 |
|---|---|---|---|---|---|---|
| Total Nonfinancial | 4.67 | 4.74 | 3.14 | 6.36 | 3.18 | 11.74 |
| Households and Nonprofits | 3.25 | 3.36 | 4.32 | 3.42 | 3.40 | 3.86 |
| Nonfinancial Business | 4.18 | 4.79 | 4.32 | 5.68 | 1.98 | 18.80 |
| Federal Government | 7.58 | 6.67 | 2.08 | 10.43 | 3.77 | 14.35 |
| State and Local Governments | -1.60 | 0.34 | -2.52 | 0.64 | 4.55 | 0.10 |
Debt Outstanding by Sector
| Description | 2018 | 2019 | 2019:Q2 | 2019:Q3 | 2019:Q4 | 2020:Q1 |
|---|---|---|---|---|---|---|
| Total Nonfinancial | 51.88 | 54.32 | 53.06 | 53.90 | 54.32 | 55.92 |
| Households and Nonprofits | 15.61 | 16.12 | 15.86 | 15.99 | 16.12 | 16.28 |
| Nonfinancial Business | 15.32 | 16.06 | 15.76 | 15.98 | 16.06 | 16.81 |
| Federal Government | 17.87 | 19.06 | 18.40 | 18.88 | 19.06 | 19.74 |
| State and Local Governments | 3.08 | 3.09 | 3.05 | 3.05 | 3.09 | 3.09 |
Accessible version | CSV | Data Dictionary |
Accessible version | CSV | Data Dictionary |
The rapid growth in nonfinancial business debt was driven mainly by an expansion in nonmortgage depository loans, and reflects large drawdowns in existing lines of credit in March 2020.
In the quarter as a whole, net issuance of corporate bonds was robust (though much smaller than the increase in depository loans), owing to a pickup in issuance in January and February after negative net issuance in the previous quarter.
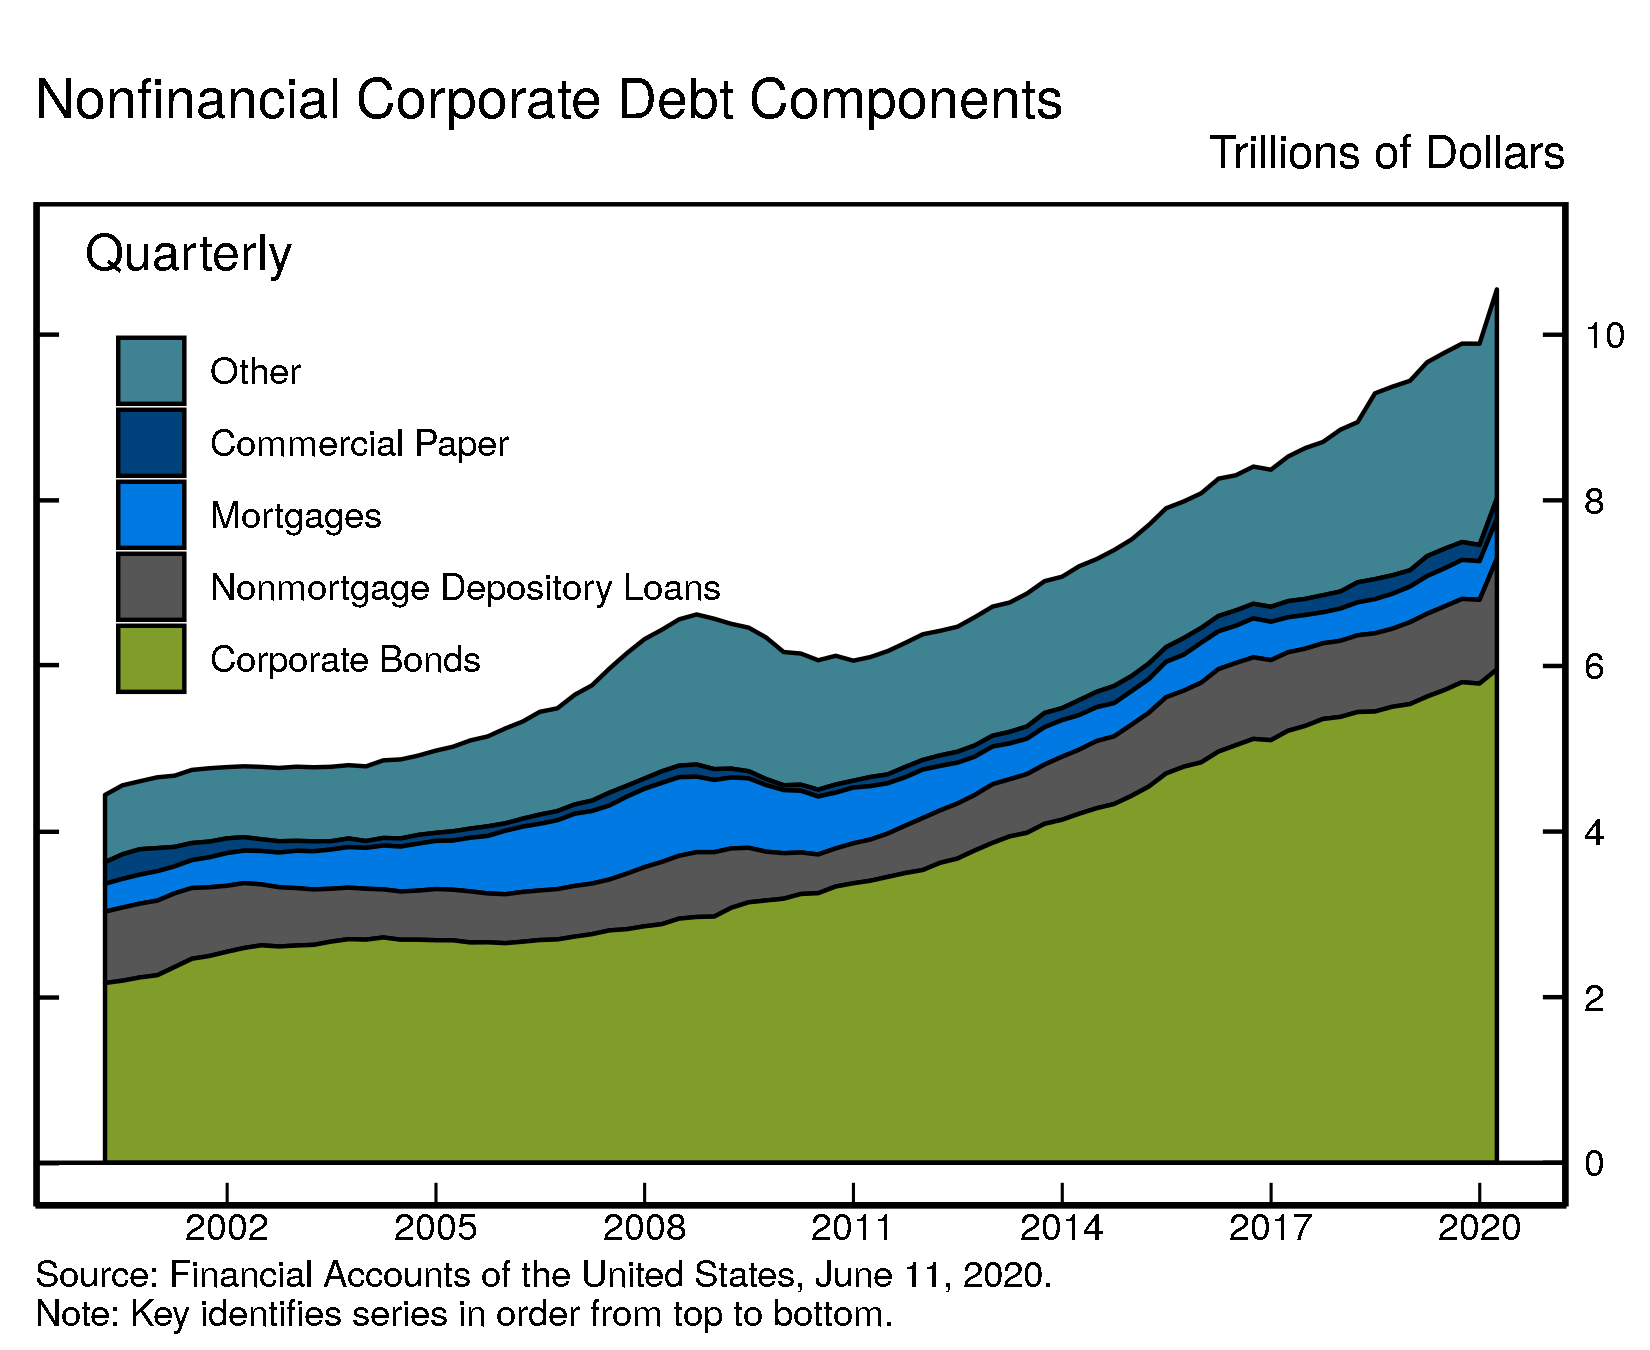
Overall, outstanding nonfinancial corporate debt was $10.5 trillion. Corporate bonds, at nearly $6 trillion, account for 57% of the total. Nonmortgage depository loans were $1.3 trillion. Other types of debt include loans from nonbank institutions, loans from the federal government, and commercial paper.
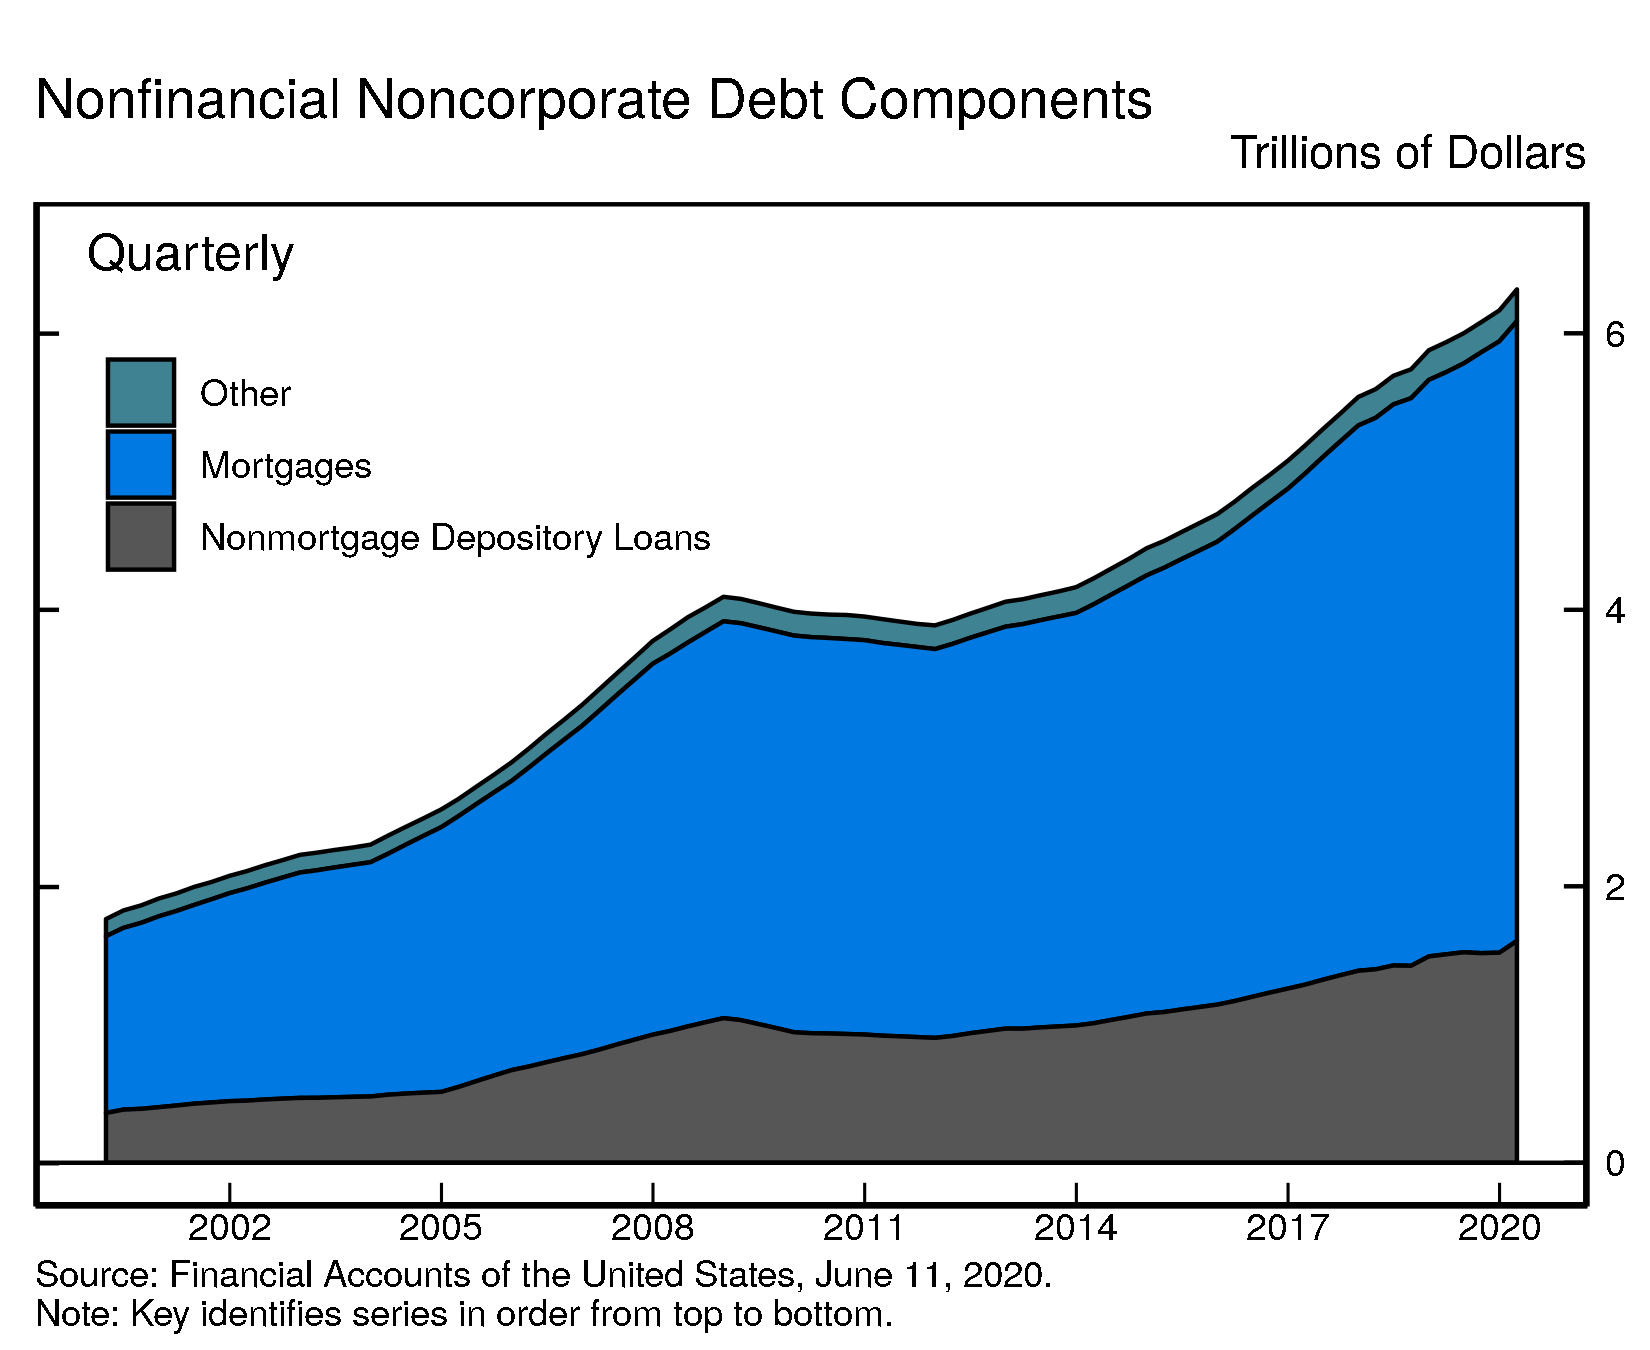
The nonfinancial noncorporate business sector includes mostly smaller businesses, which are typically not incorporated. Nonfinancial noncorporate business debt was $6.3 trillion, of which $4.5 trillion were mortgage loans and $1.6 trillion were nonmortgage depository loans.
Accessible version | CSV | Data Dictionary |
Accessible version | CSV | Data Dictionary |
For more data on nonfinancial business balance sheets, including debt, see tables B.103 and B.104
New data features
New facilities. In response to the coronavirus pandemic, the Federal Reserve, the U.S. Congress, and the Administration rapidly established a number of new programs to support the flow of credit to households and businesses. The Monetary Authority tables (F.109 and L.109) now contain information on facilities including the Money Market Mutual Fund Liquidity Facility (MMLF) and the revived Primary Dealer Credit Facility (PDCF). Facilities that were not yet operational as of March 31, 2020 will appear in future releases of the Financial Accounts. For a description of these facilities, see the main Federal Reserve Board webpage (https://www.federalreserve.gov/)
In general, the Monetary Authority tables F.109 and L.109 summarize the effect of all the Federal Reserve’s actions on its balance sheet during the first quarter. For timely information on developments in the Federal Reserve’s balance sheet, see the H.4.1 Statistical Release on Factors Affecting Reserve Balances (https://www.federalreserve.gov/releases/h41/) For other new data and for methodological data revisions, see current release
Coming soon
- The distributional financial accounts, which provide a quarterly measure of the distribution of U.S. household wealth, will be published Friday next week.
- Financial Accounts data for the second quarter of 2020 will be published on Monday, September 21, 2020, at 12:00 noon.
Chart Notes
- Changes in net worth consist of transactions, revaluations, and other volume changes. Corporate equity and debt securities include directly and indirectly held securities. Real estate is the value of owner-occupied real estate. Other includes equity in noncorporate businesses, consumer durable goods, fixed assets of nonprofit organizations, and all other financial assets apart from corporate equities and debt securities, net of liabilities, as shown on table B.101 Balance Sheet of Households and Nonprofit Organizations
Depository loans include bank loans (bank credit) and loans from nonbank depository institutions such as credit unions and savings and loans associations.↩