Financial Accounts of the United States - Z.1
Recent Developments RSS Data Download
This release reports data through September 30, 2020.
- Household net worth increased by $3.8 trillion in the third quarter, owing to increases in stock prices and home prices and a high saving rate.
- Household debt grew at an annual pace of 5.6%, with continued growth in home mortgages and a more subdued growth in nonmortgage consumer credit.
- Nonfinancial business debt contracted at an annual rate of 0.9%, after two quarters of rapid growth, reflecting primarily a decline in outstanding nonmortgage depository loans 1.
Household Net Worth
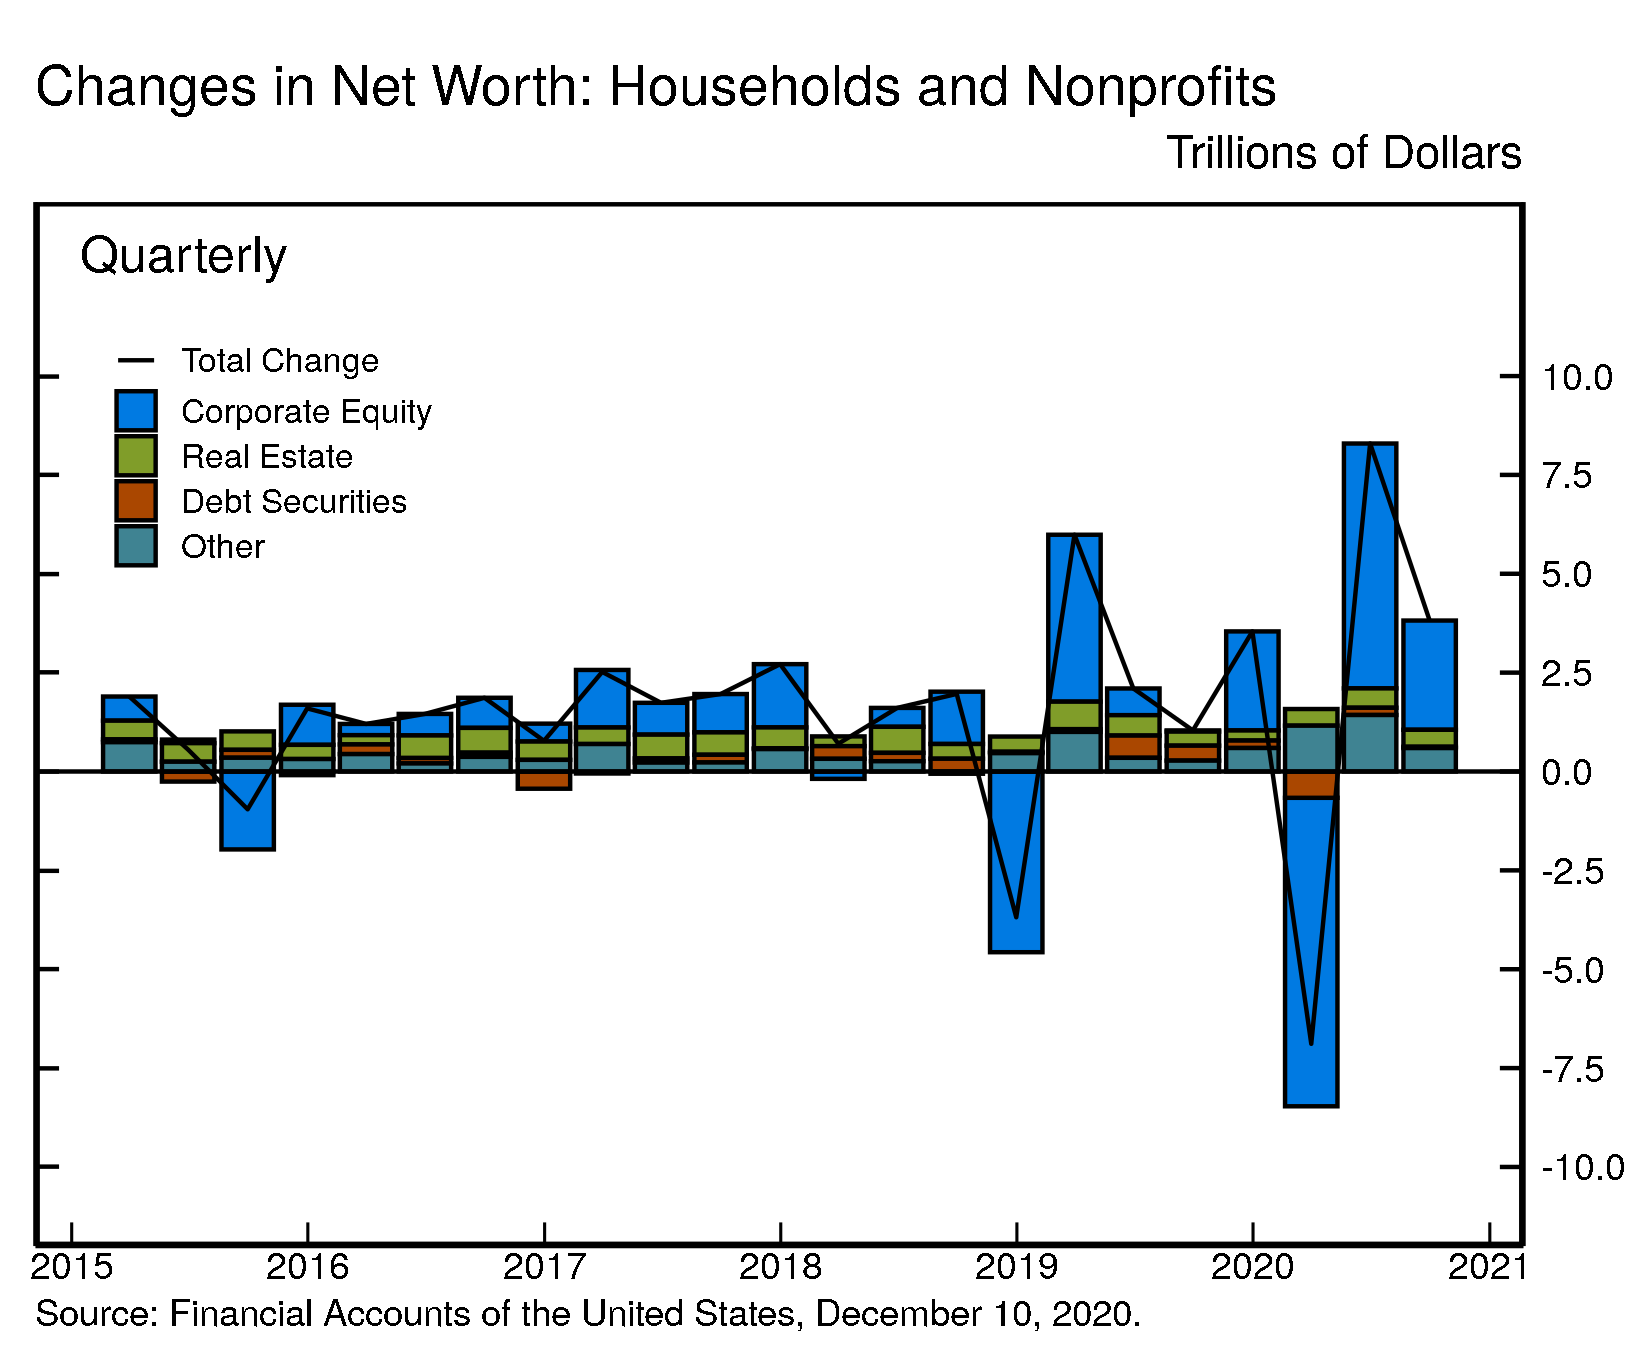
After rebounding in the second quarter from its first quarter dip, the net worth of households and nonprofit organizations increased by $3.8 trillion to $123.5 trillion in the third quarter. The value of directly and indirectly held corporate equities increased by $2.8 trillion thanks to further gains in corporate equity prices. The value of real estate held by housholds increased more modestly, and the still high saving rate also contributed to the increase in net worth.
View interactive | Accessible version | CSV | Data Dictionary | Chart Note (1) |
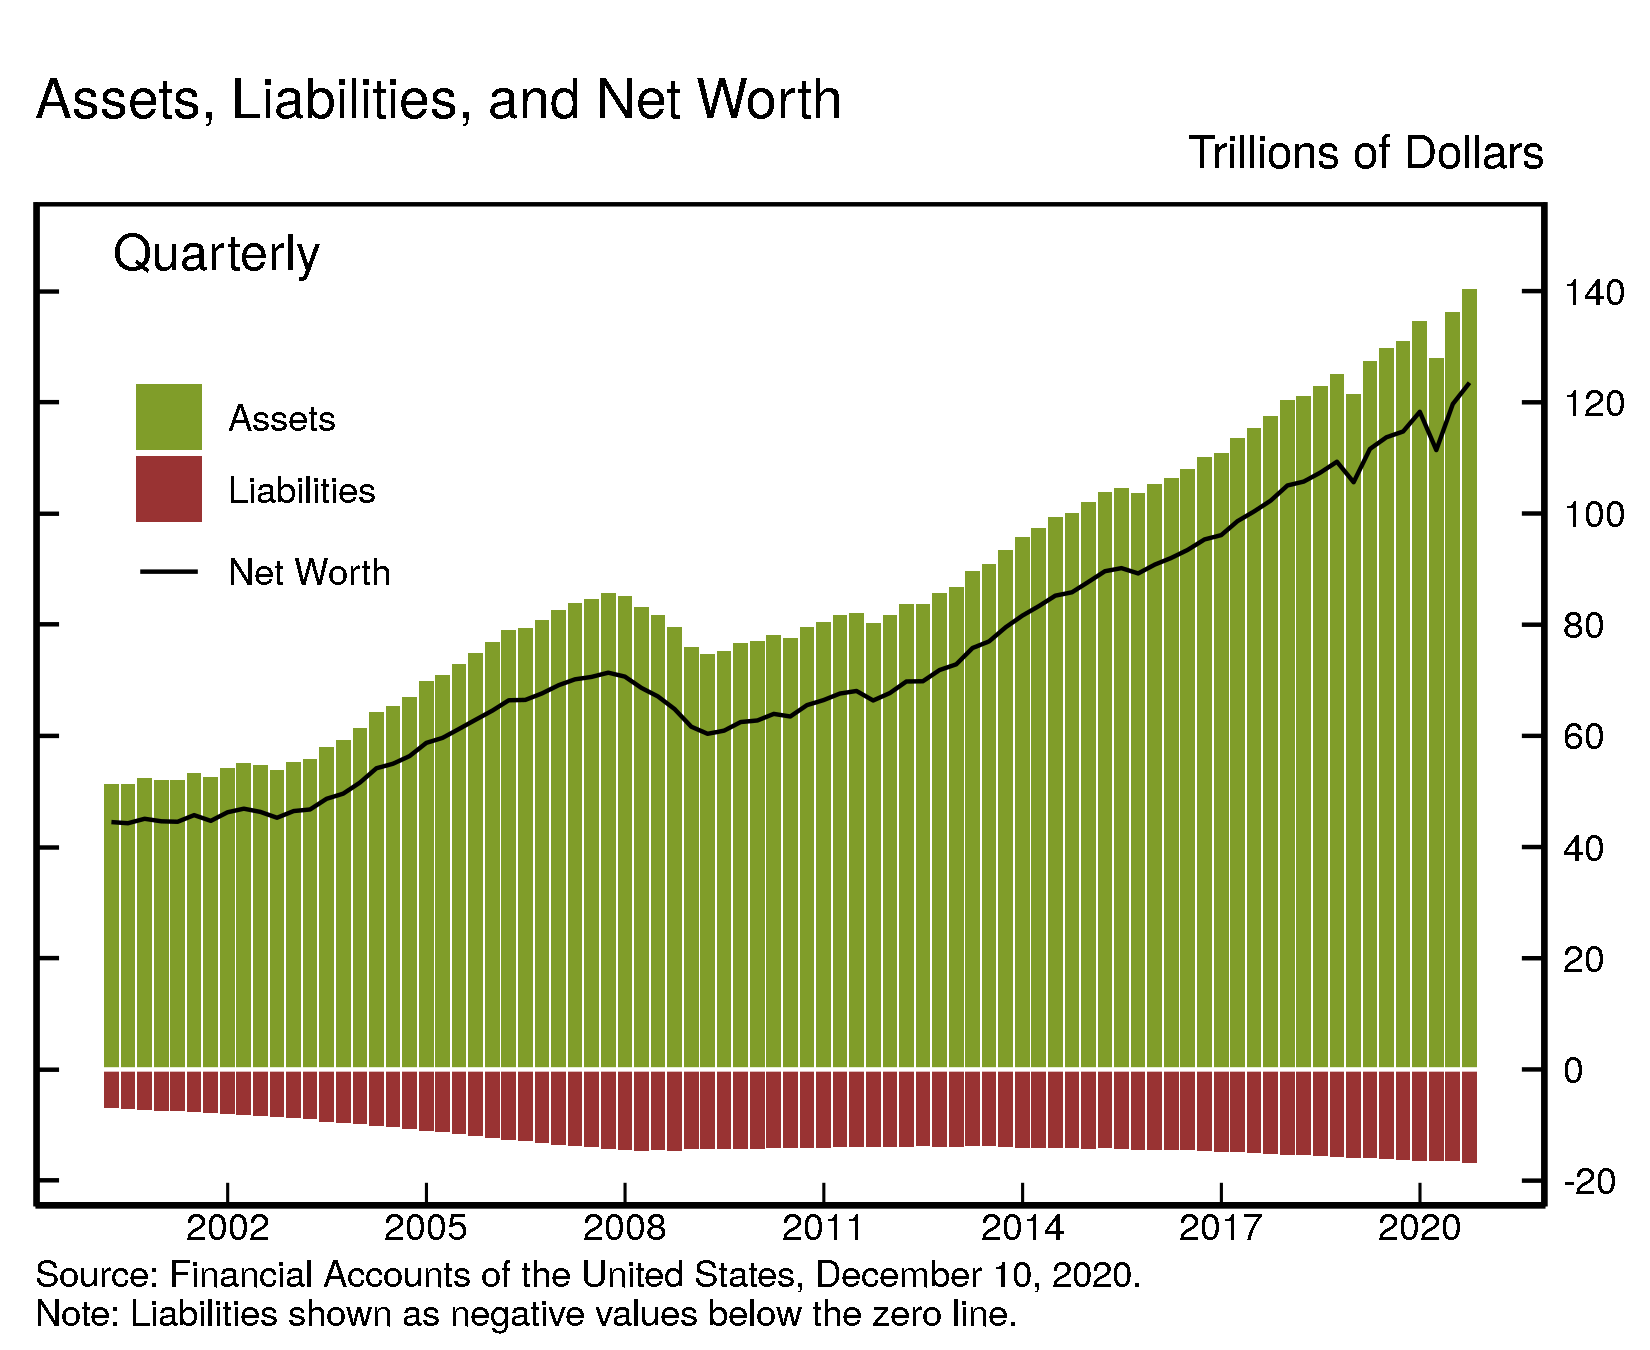
Real estate ($31.2 trillion) and directly and indirectly held corporate equities ($35.6 trillion) were among the largest components of household net worth. Household debt (seasonally adjusted) was $16.4 trillion.
View interactive | Accessible version | CSV | Data Dictionary |
Household Balance Sheet Summary
| Description | 2018 | 2019 | 2019:Q4 | 2020:Q1 | 2020:Q2 | 2020:Q3 |
|---|---|---|---|---|---|---|
| Net Worth | 105.63 | 118.29 | 118.29 | 111.41 | 119.70 | 123.52 |
| Change in Net Worth | 0.59 | 12.67 | 3.54 | -6.89 | 8.29 | 3.82 |
| Equities | 27.00 | 34.43 | 34.43 | 26.63 | 32.82 | 35.58 |
| Change in Equities | -2.96 | 7.43 | 2.50 | -7.80 | 6.19 | 2.76 |
| Real Estate | 28.38 | 29.93 | 29.93 | 30.32 | 30.79 | 31.23 |
| Change in Real Estate | 1.58 | 1.55 | 0.32 | 0.39 | 0.46 | 0.45 |
For more data on household net worth, see table B.101
Nonfinancial debt
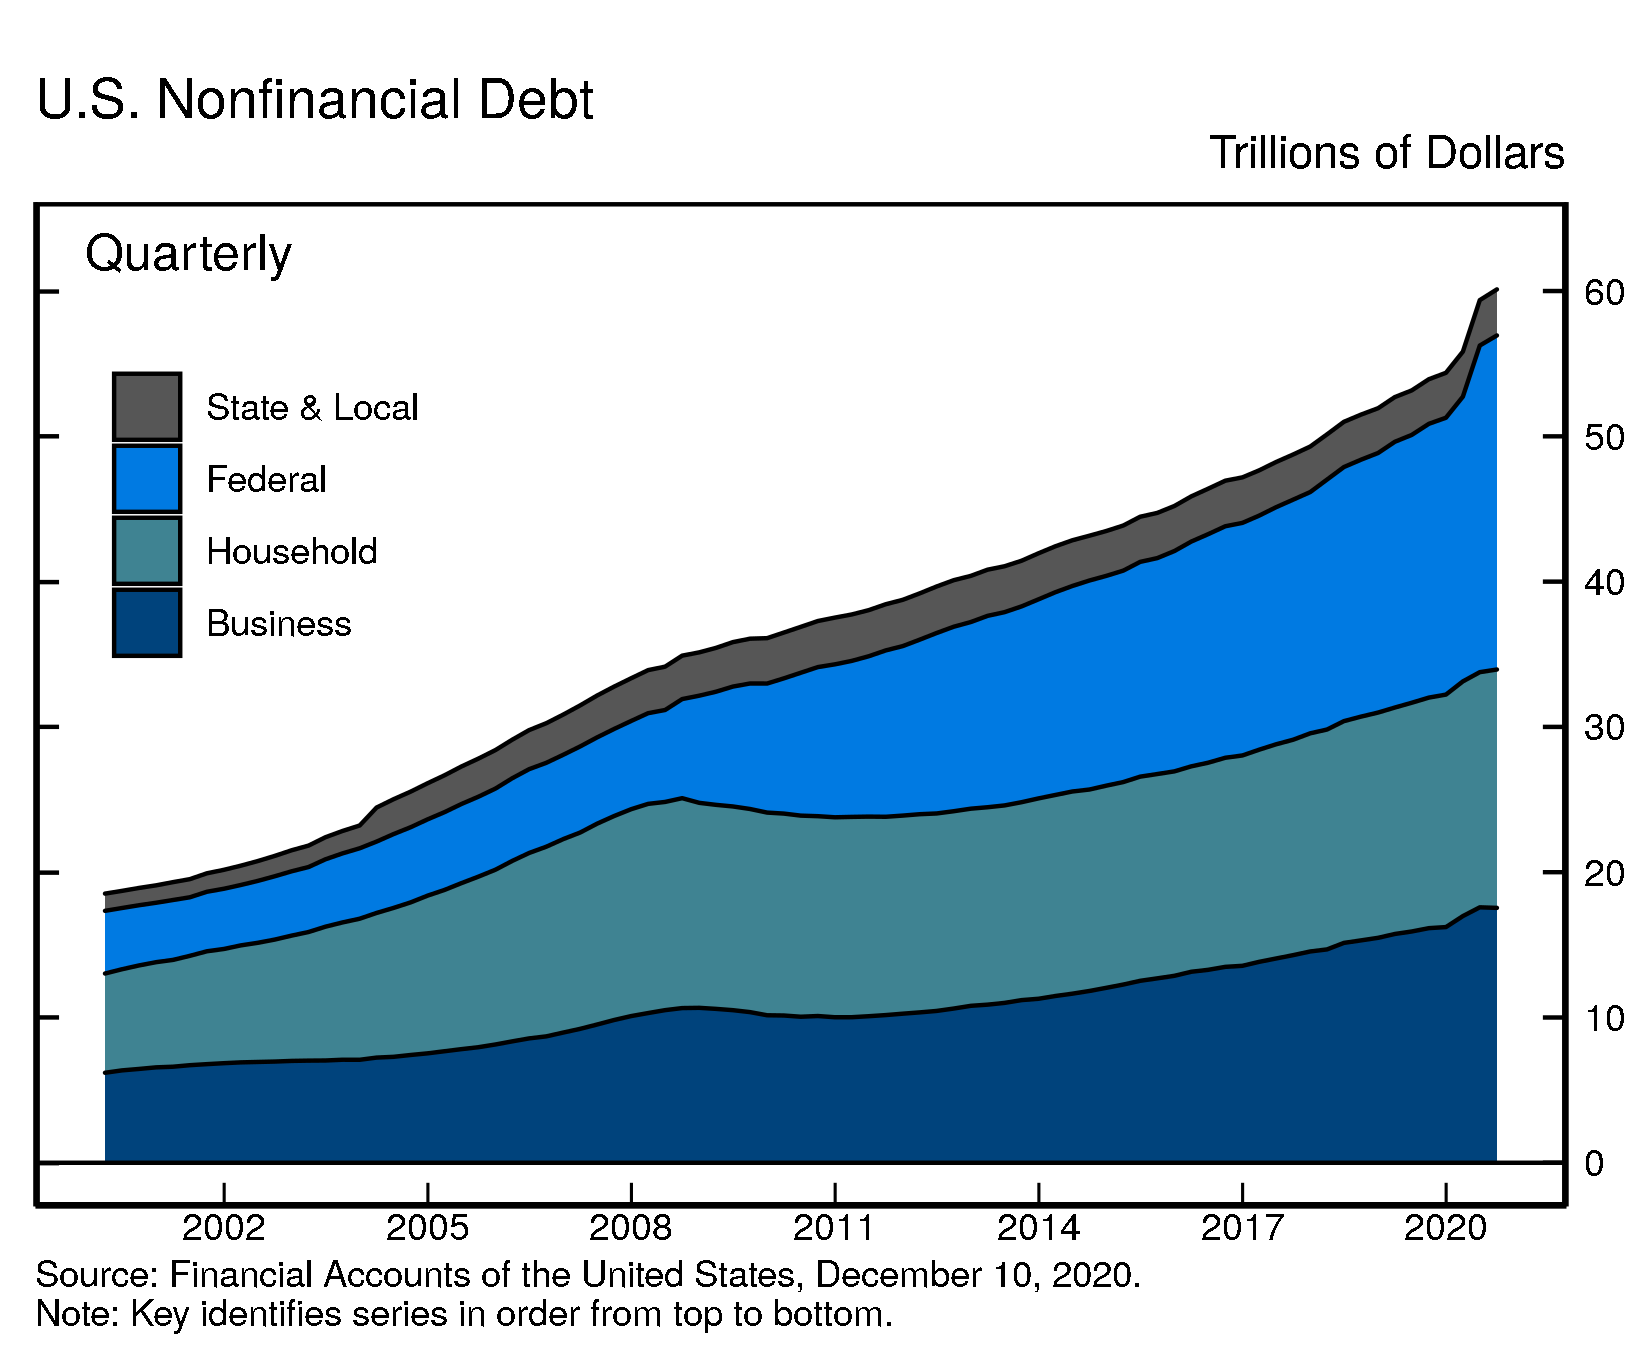
Household debt grew 5.6% in the third quarter of 2020 (this and subsequent rates of growth are reported at a seasonally adjusted annual rate). Home mortgages increased 5.6%, a slightly faster pace than in previous quarters. Nonmortgage consumer credit increased 1.9%, after a decline in the second quarter. The increase in consumer credit reflects growth in auto loans and student loans, while credit card balances continued to decline.
After two quarters of rapid growth, nonfinancial business debt decreased at an annual rate of 0.9%. Federal debt rose 9.1%. State and local debt increased 5.6%.
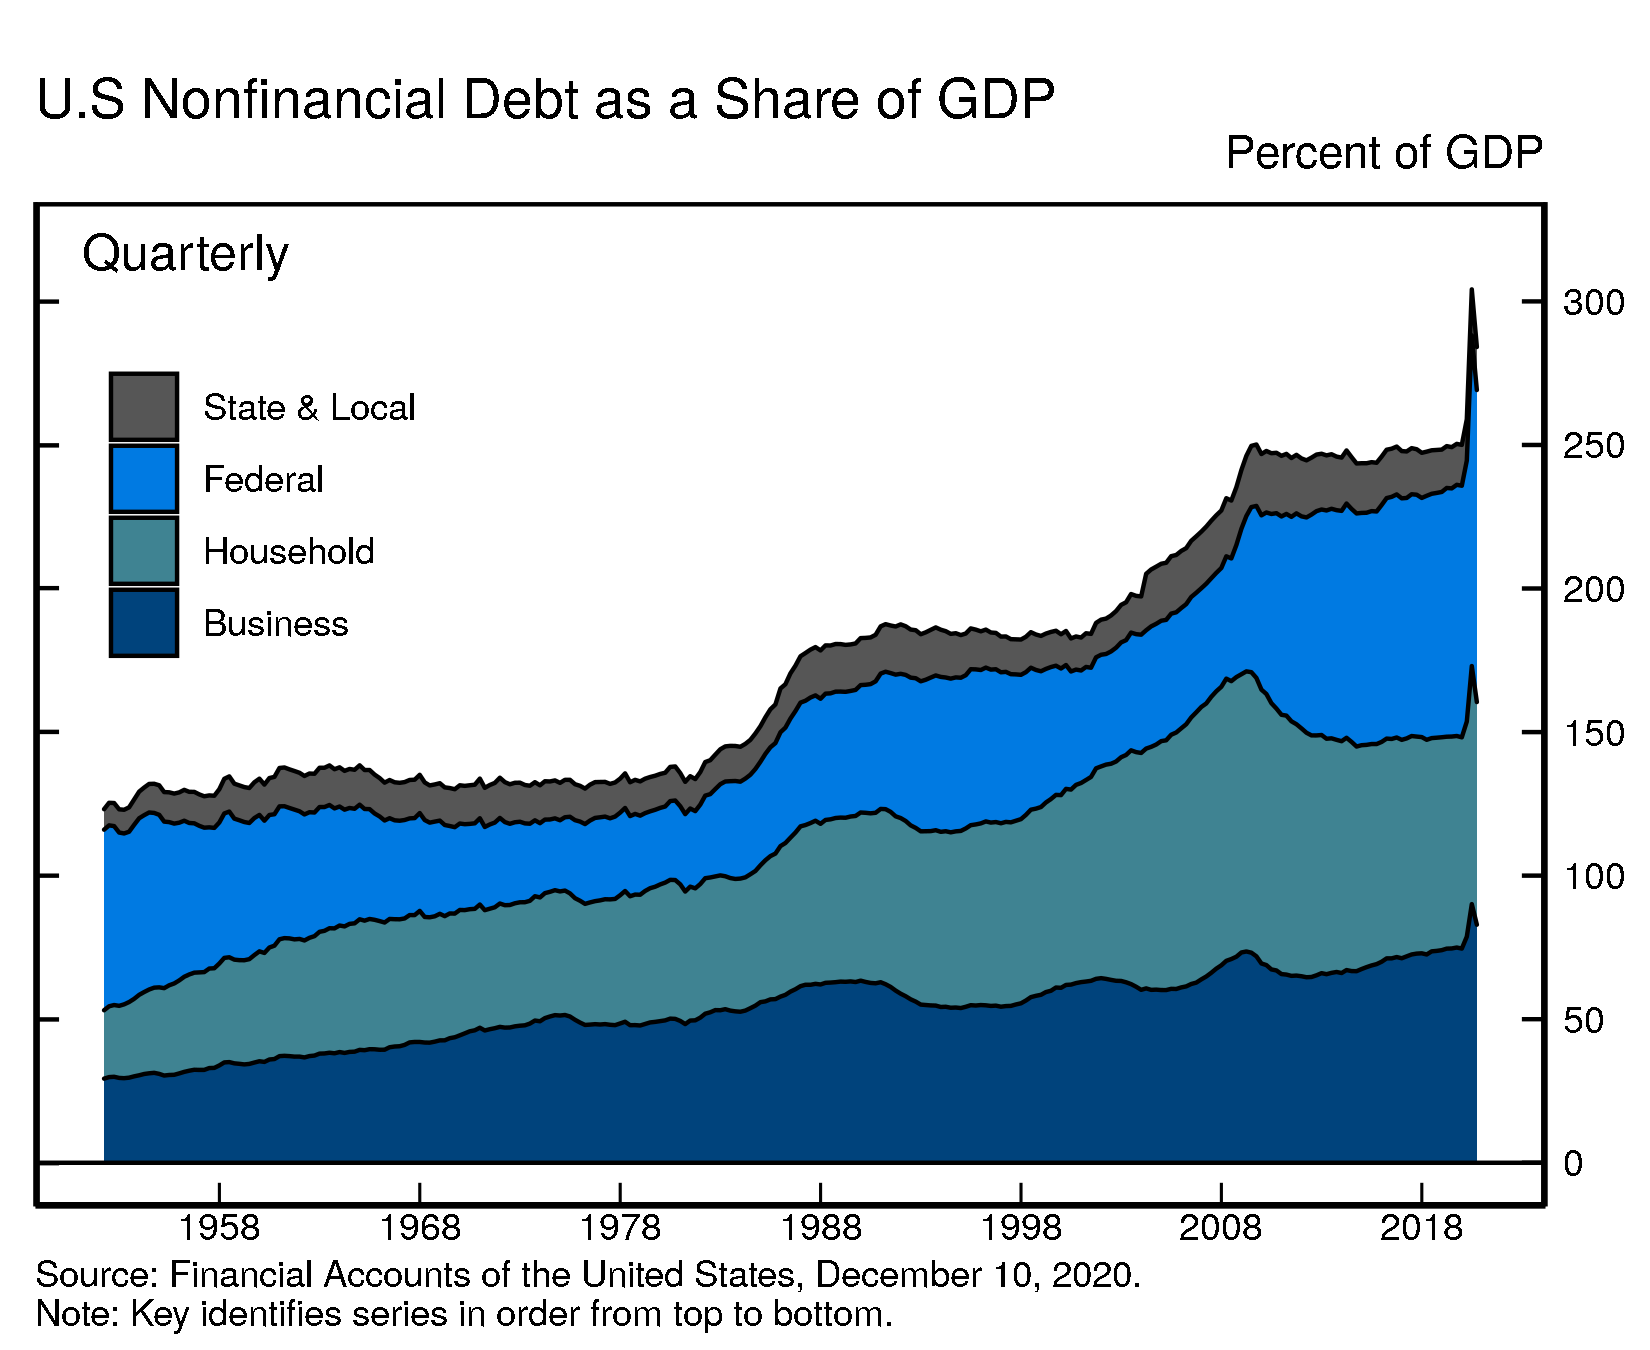
As GDP recovered in the third quarter, the ratio of nonfinancial debt to GDP moved down a bit. In the second quarter, the ratio had spiked, driven by the drop in GDP and the expansion in federal debt related to the fiscal stimulus.
For more data on nonfinancial debt, see table D.1 (rates of growth) and table D.3 (outstanding).
Debt Growth by Sector
| Description | 2018 | 2019 | 2019:Q4 | 2020:Q1 | 2020:Q2 | 2020:Q3 |
|---|---|---|---|---|---|---|
| Total Nonfinancial | 4.72 | 4.72 | 3.30 | 10.70 | 25.42 | 4.98 |
| Households and Nonprofits | 3.36 | 3.30 | 3.43 | 3.76 | 0.84 | 5.56 |
| Nonfinancial Business | 4.22 | 4.77 | 1.87 | 18.64 | 14.21 | -0.92 |
| Federal Government | 7.58 | 6.67 | 4.49 | 11.38 | 58.86 | 9.10 |
| State and Local Governments | -1.59 | 0.33 | 2.90 | 0.86 | 3.47 | 5.55 |
Debt Outstanding by Sector
| Description | 2018 | 2019 | 2019:Q4 | 2020:Q1 | 2020:Q2 | 2020:Q3 |
|---|---|---|---|---|---|---|
| Total Nonfinancial | 51.94 | 54.37 | 54.37 | 55.83 | 59.38 | 60.11 |
| Households and Nonprofits | 15.50 | 16.00 | 16.00 | 16.15 | 16.19 | 16.41 |
| Nonfinancial Business | 15.48 | 16.22 | 16.22 | 16.98 | 17.58 | 17.54 |
| Federal Government | 17.87 | 19.06 | 19.06 | 19.60 | 22.48 | 22.99 |
| State and Local Governments | 3.08 | 3.09 | 3.09 | 3.10 | 3.13 | 3.17 |
Accessible version | CSV | Data Dictionary |
Accessible version | CSV | Data Dictionary |
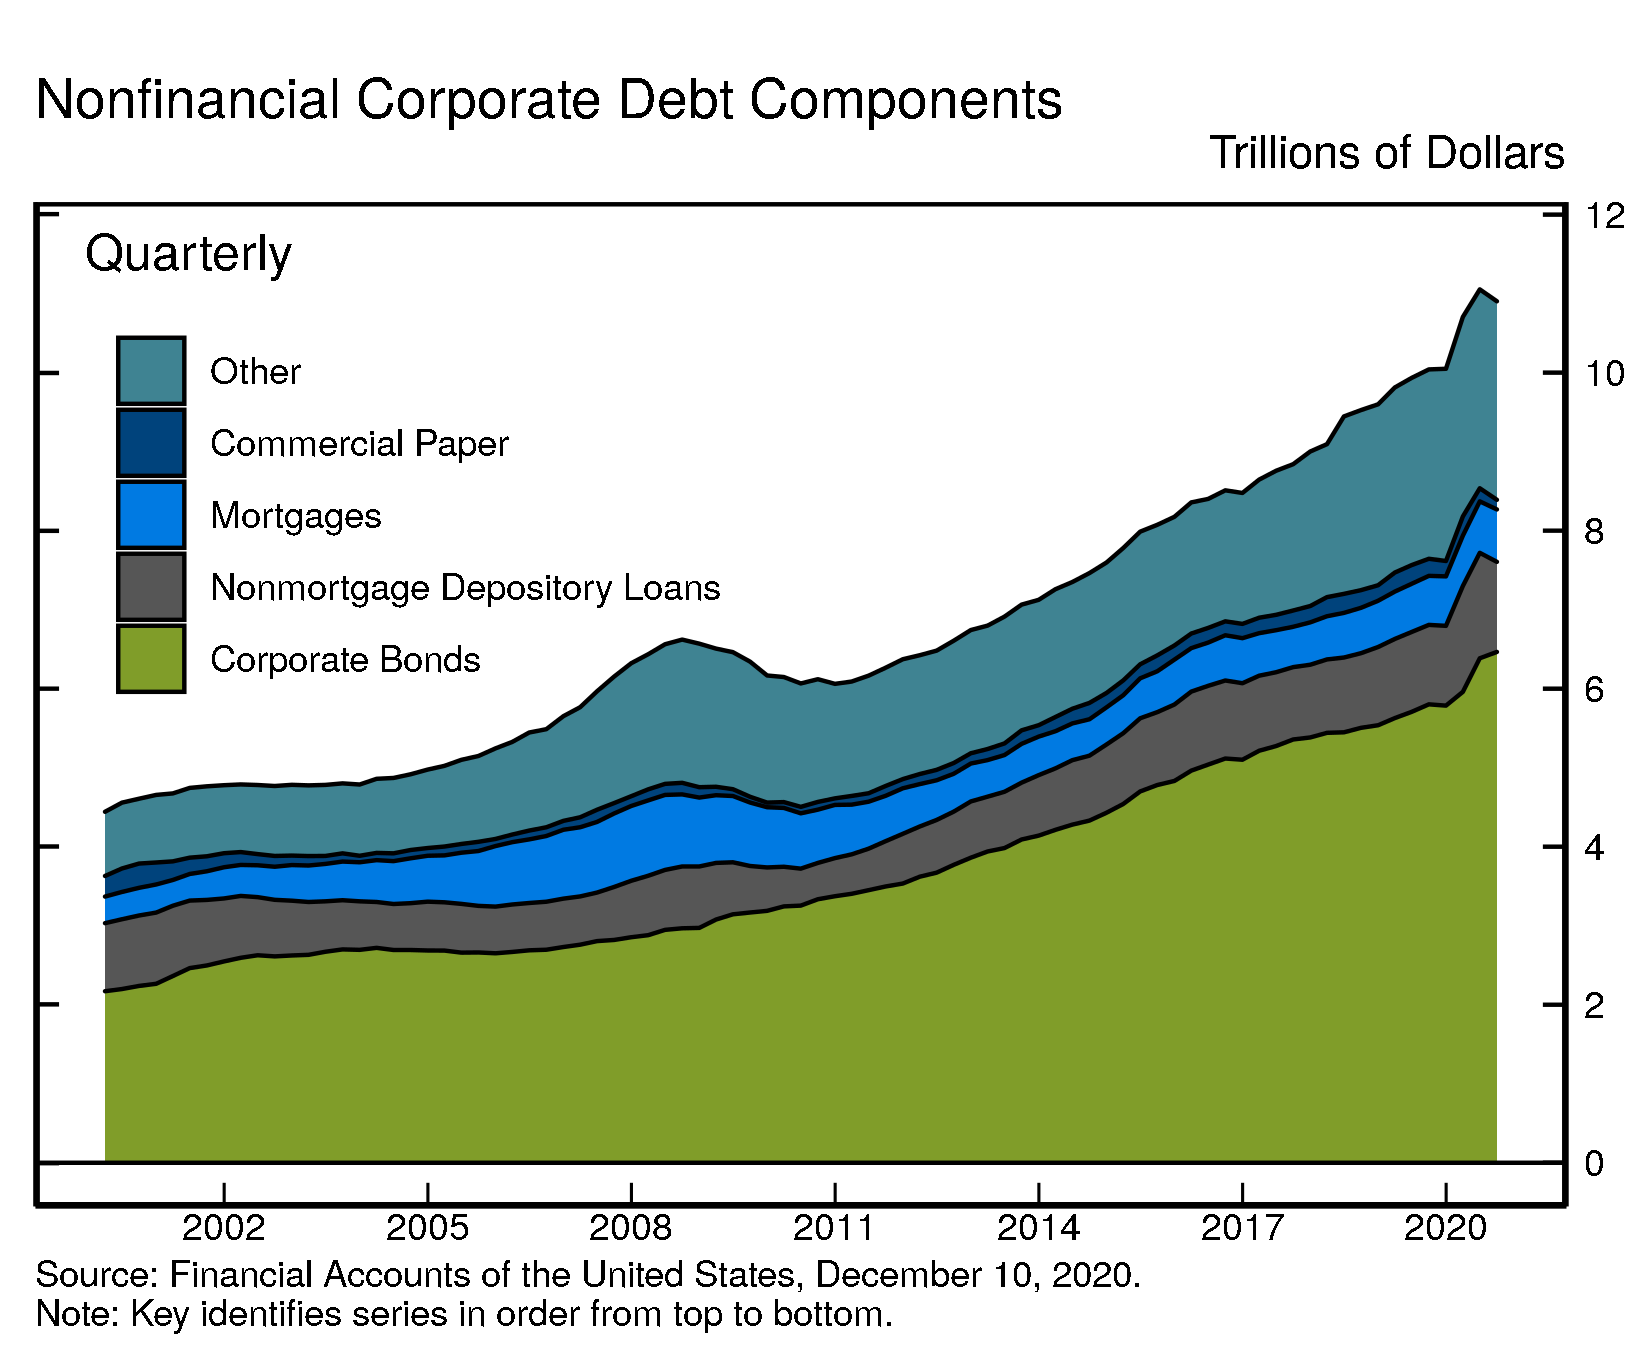
Looking at the various components of nonfinancial business debt, nonmortgage depository loans to nonfinancial business declined $187 billion. In the first quarter, these loans had expanded notably, as firms tapped their lines of credit at banks. Since then, outstanding loan balances (excluding loans extended under the Paycheck Protection Program, or PPP), have been declining, as firms have paid back their lines of credit and fewer new loans have been originated. The last PPP loans were extended in the first half of the third quarter. The vast majority of the roughly $525 billion of loans that were disbursed under the PPP are still on the lenders’ balance sheet as of the end of the third quarter, and thus are still included in our measure of nonfinancial business debt, even though a large fraction of them is expected to be forgiven. A technical Q&A (www.federalreserve.gov/releases/z1/z1_technical_qa.htm) provides additional details on the treatment of PPP loans in the Financial Accounts.
Partly offsetting the decline in nonmortgage bank loans, corporate bonds continued to increase, although at a slower pace than in the second quarter.
Overall, outstanding nonfinancial corporate debt was nearly $10.9 trillion. Corporate bonds, at roughly $6.5 trillion, accounted for 59% of the total. Nonmortgage depository loans were $1.1 trillion. Other types of debt include loans from nonbank institutions, loans from the federal government, and commercial paper.
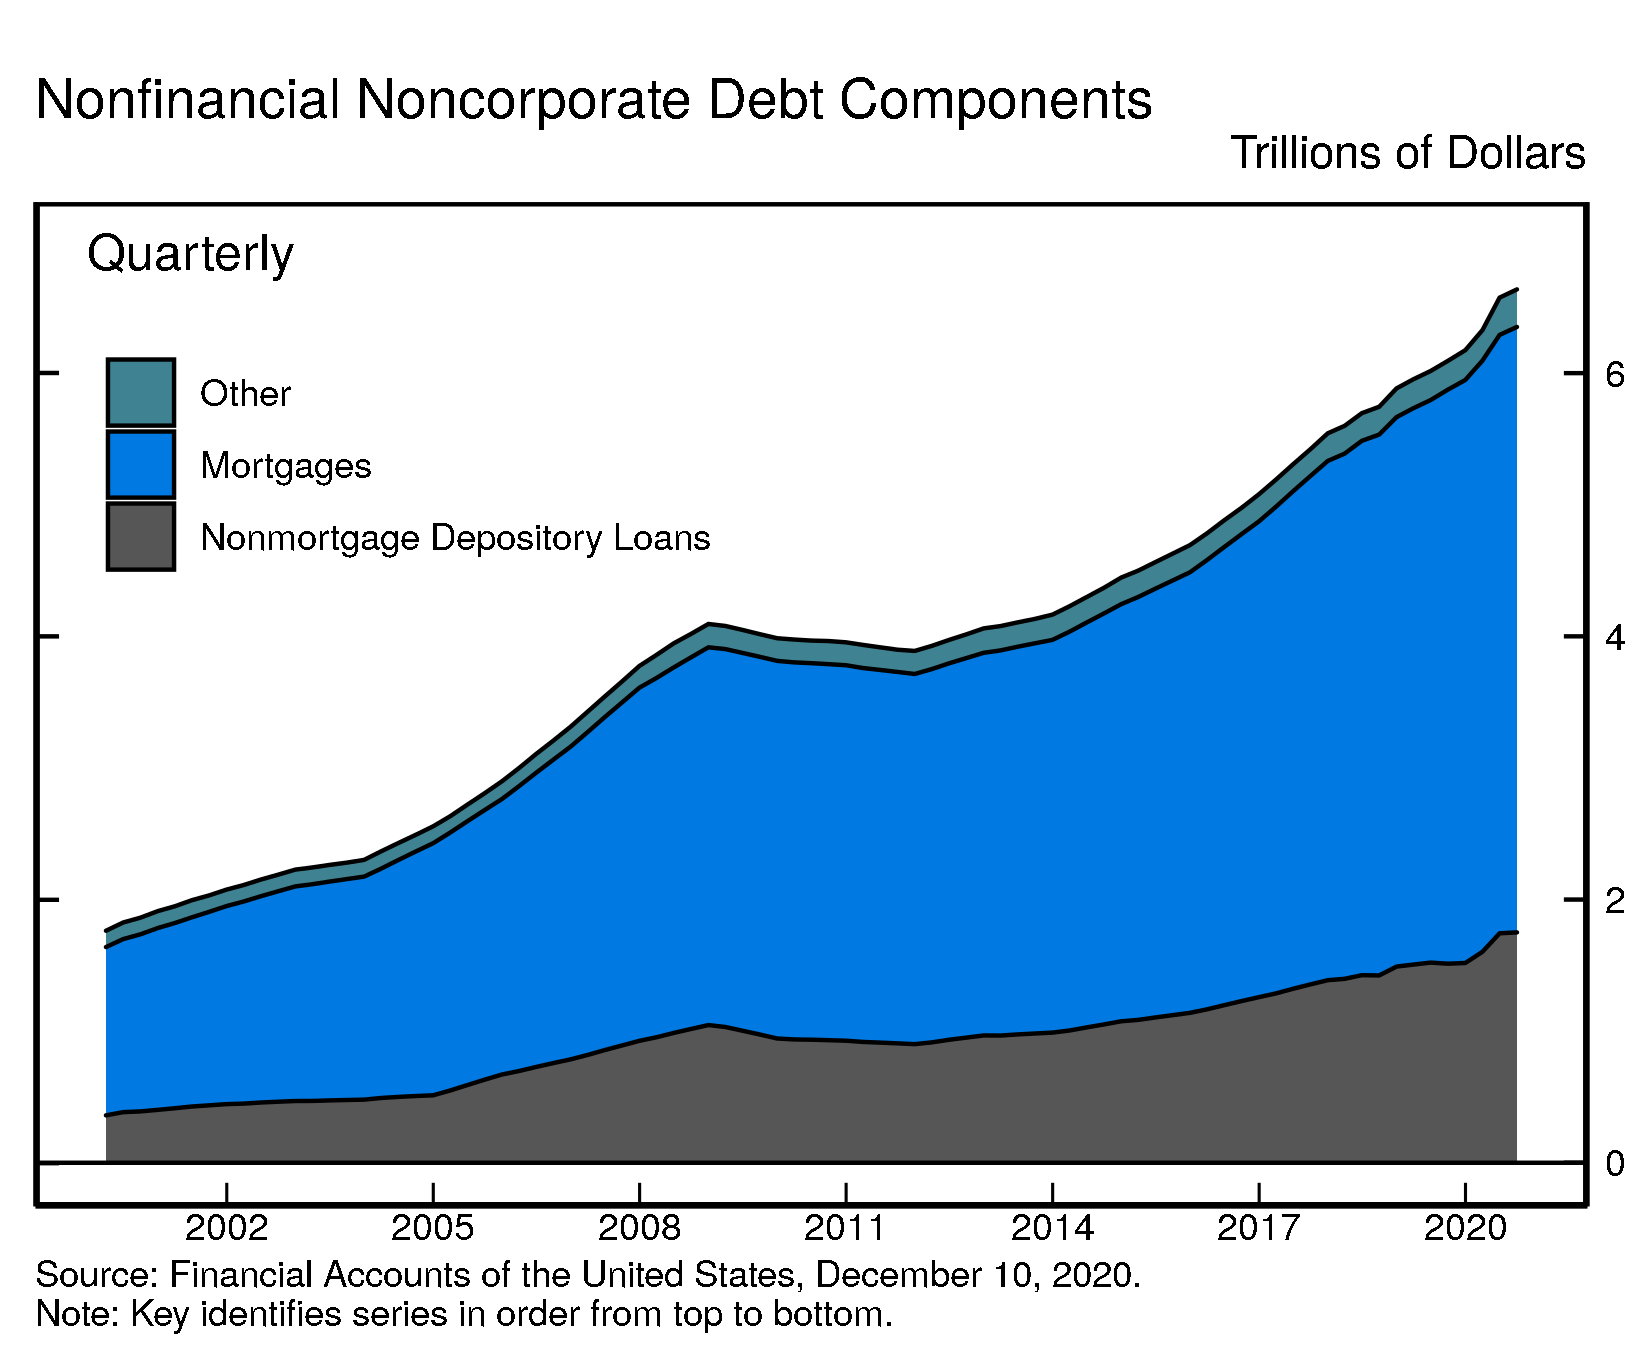
The nonfinancial noncorporate business sector is composed of mostly smaller businesses, which are typically not incorporated. Nonfinancial noncorporate business debt was $6.6 trillion, of which $4.6 trillion were mortgage loans and $1.8 trillion were nonmortgage depository loans.
Accessible version | CSV | Data Dictionary |
Accessible version | CSV | Data Dictionary |
For more data on nonfinancial business balance sheets, including debt, see tables B.103 and B.104
New data features
Hedge funds. A new supplementary table showing the aggregate assets and liabilities of hedge funds that file Form PF with the Securities and Exchange Commission was published in September and will be updated with second quarter data on Friday, December 18 (https://www.federalreserve.gov/releases/efa/efa-hedge-funds.htm).
For other new data and for methodological data revisions, see current release
Coming soon
- The distributional financial accounts, which provide a quarterly measure of the distribution of U.S. household wealth, will be published on Friday, December 18. Other Enhanced Financial Accounts Projects (www.federalreserve.gov/releases/efa/enhanced-financial-accounts.htm) will also be updated on December 18.
- Financial Accounts data for the fourth quarter of 2020 will be published on Thursday, March 11, 2021, at 12:00 noon.
Chart Notes
- Changes in net worth consist of transactions, revaluations, and other volume changes. Corporate equity and debt securities include directly and indirectly held securities. Real estate is the value of owner-occupied real estate. Other includes equity in noncorporate businesses, consumer durable goods, fixed assets of nonprofit organizations, and all other financial assets apart from corporate equities and debt securities, net of liabilities, as shown on table B.101 Balance Sheet of Households and Nonprofit Organizations
Depository loans include bank loans (bank credit) and loans from nonbank depository institutions such as credit unions and savings and loans associations.↩︎