Financial Accounts of the United States - Z.1
Recent Developments RSS Data Download
This release reports data through March 31, 2021.
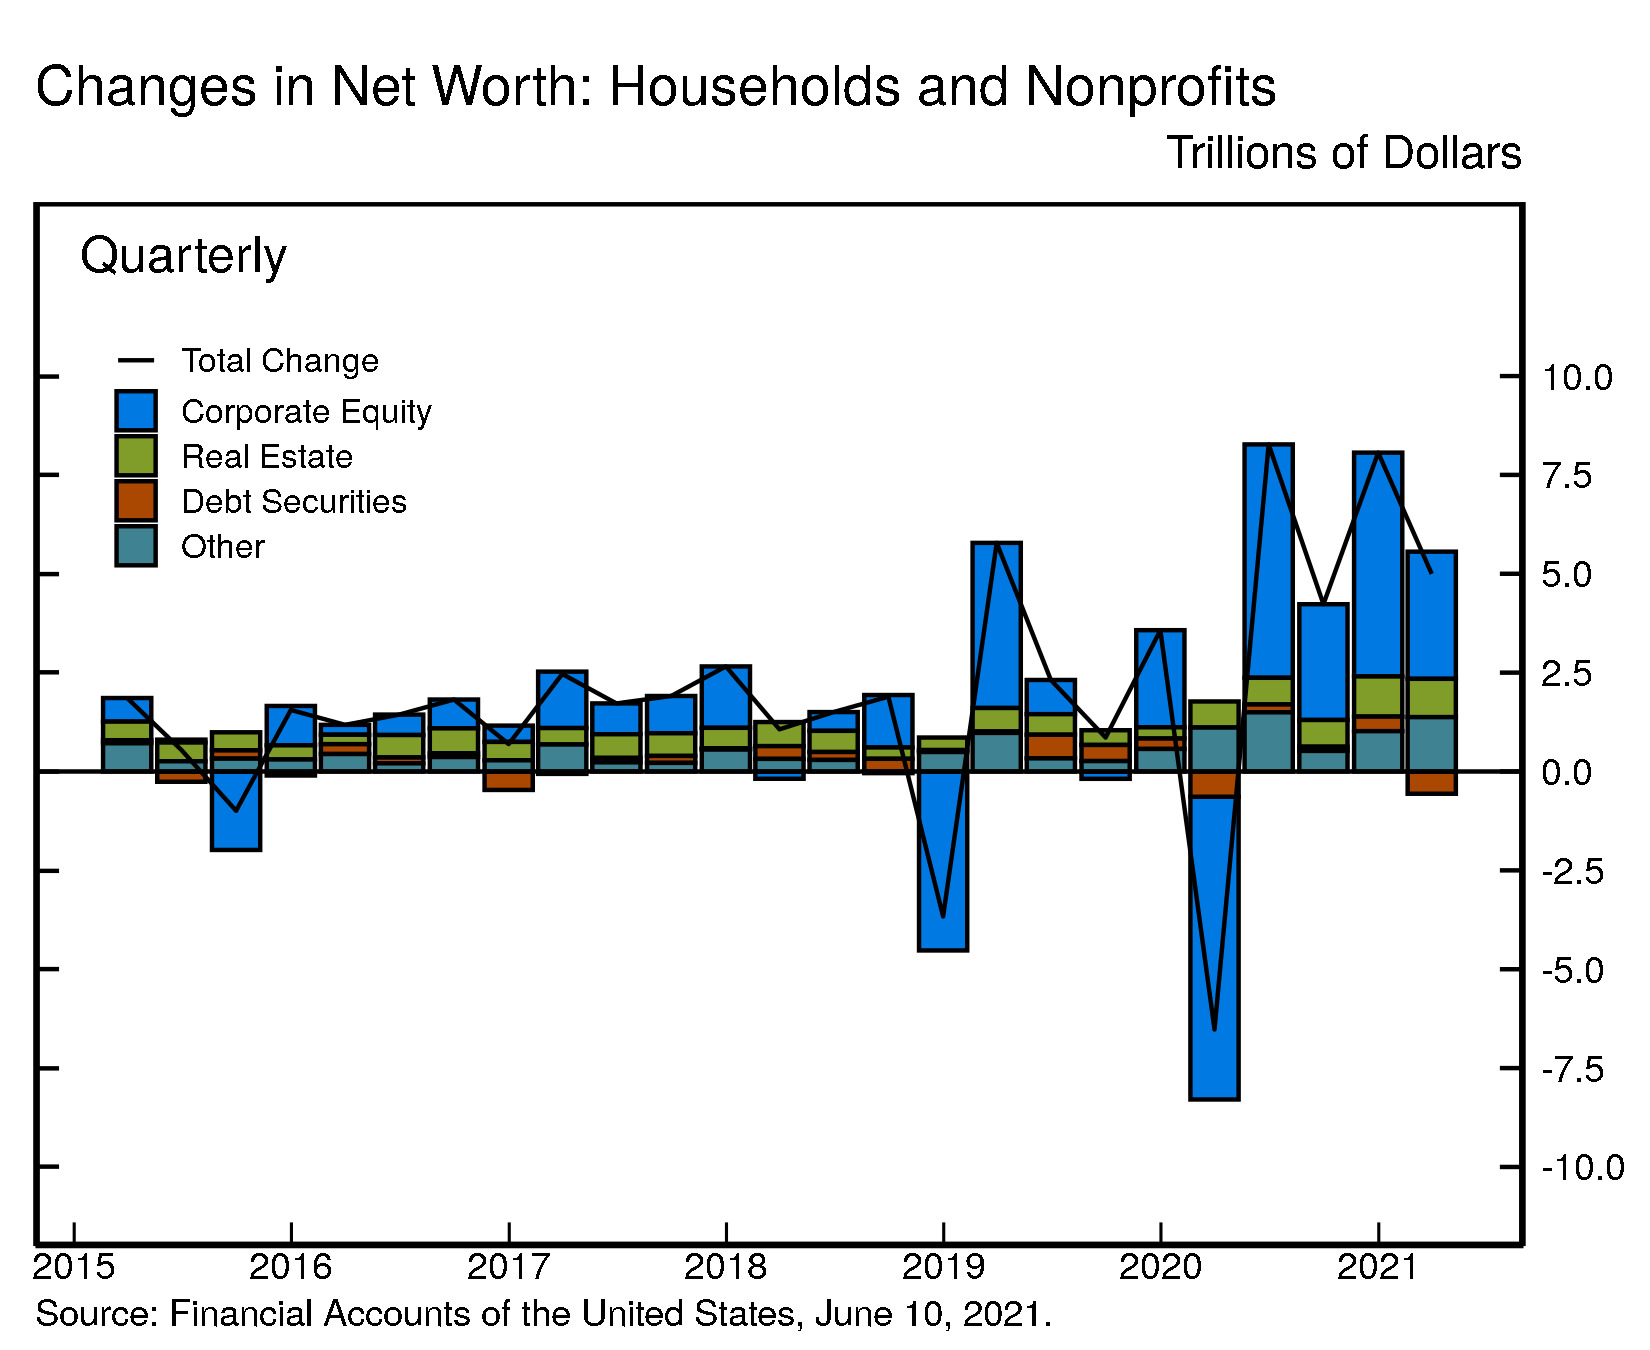
- Household net worth increased by about $5 trillion in the first quarter, reflecting large gains in stock prices, home prices, and a high saving rate.
- Household debt grew at an annual pace of 6.5%, mainly because of continued growth in home mortgages.
- Nonfinancial business debt increased at an annual rate of 4.4%, reflecting the second round of loans extended under the Paycheck Protection Program (PPP) and solid corporate bond issuance 1.
Household Net Worth
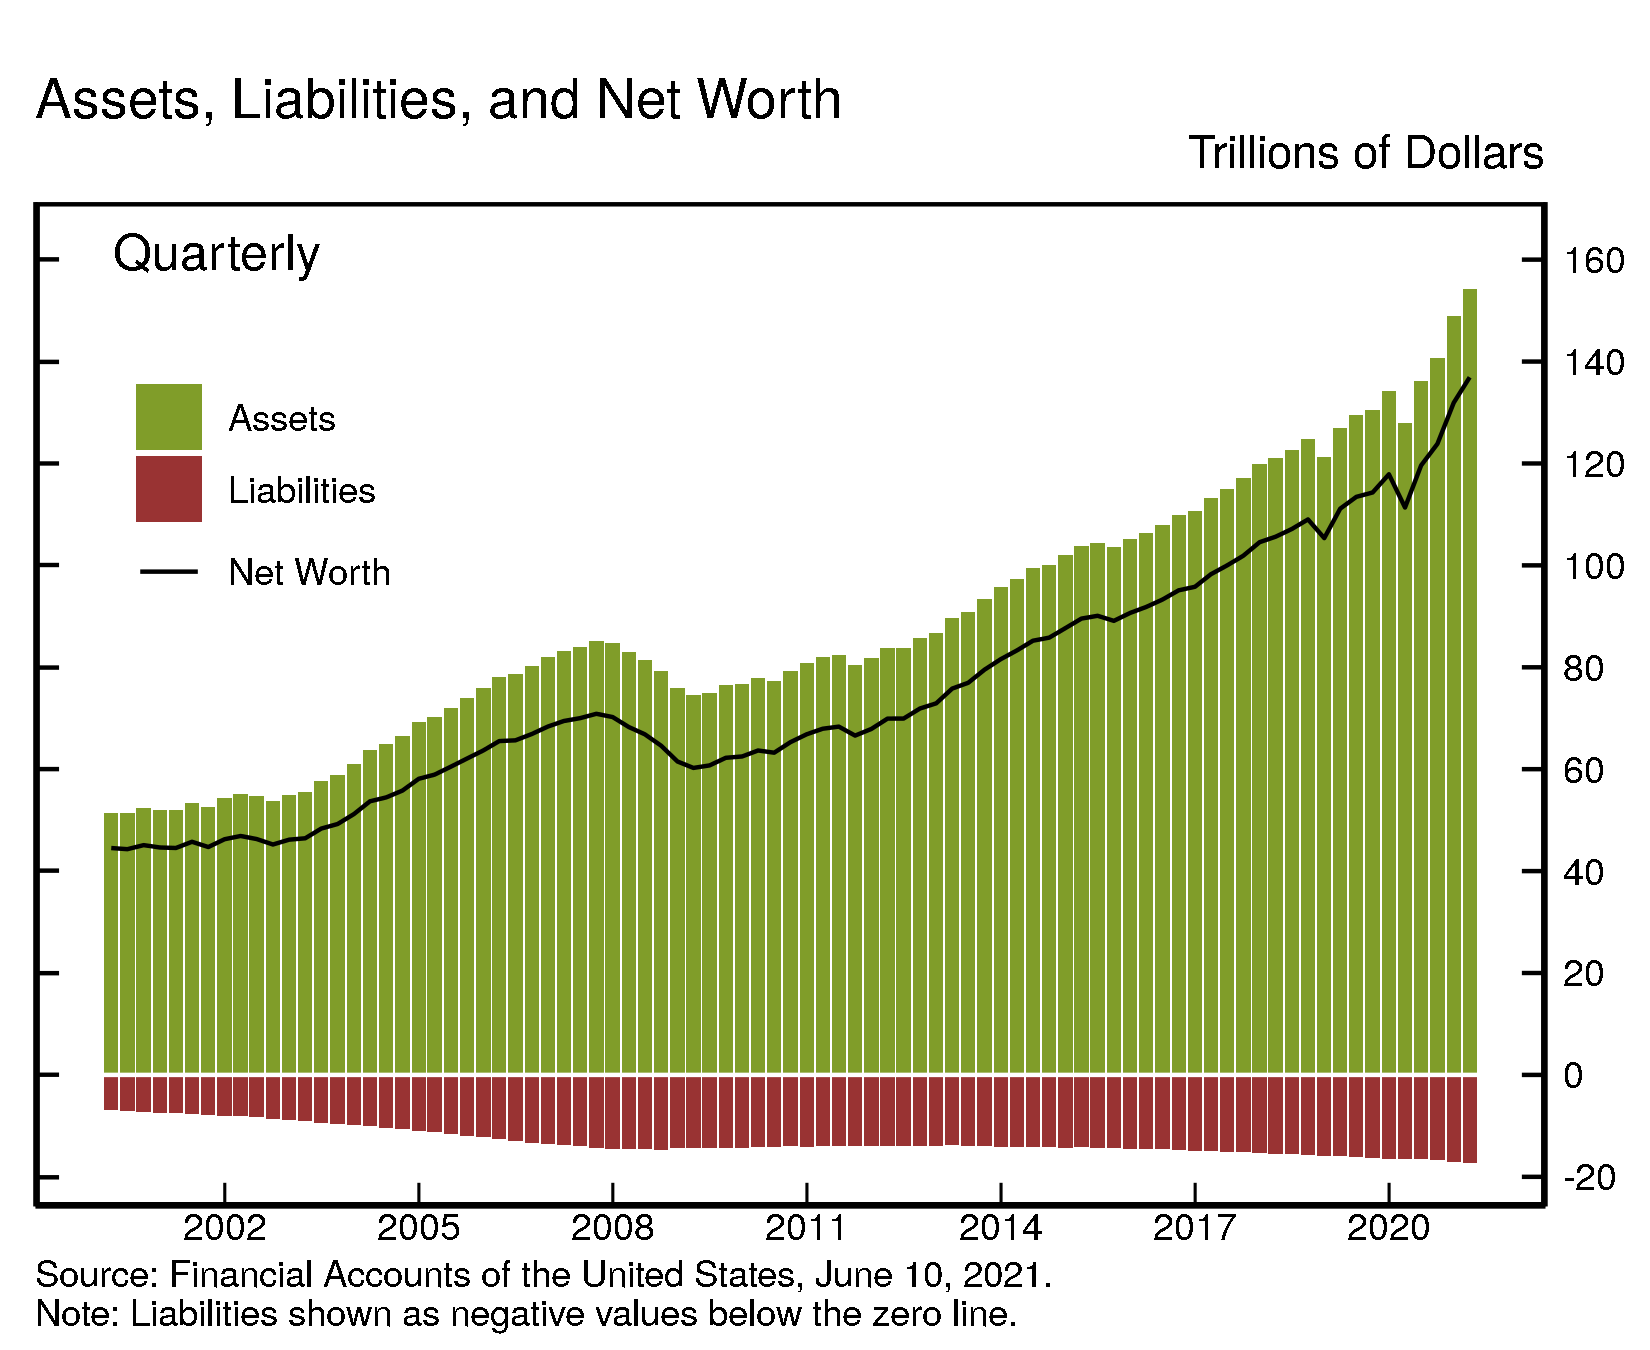
The net worth of households and nonprofit organizations increased by $5.0 trillion to $136.9 trillion in the first quarter. The value of directly and indirectly held corporate equities increased by $3.2 trillion largely because of further gains in corporate equity prices. The value of real estate held by households increased by about $1.0 trillion. After four quarters of solid growth, household net worth is now about $19 trillion above its level at the end of 2019.
View interactive | Accessible version | CSV | Data Dictionary | Chart Note (1) |
Real estate ($33.8 trillion) and directly and indirectly held corporate equities ($44.1 trillion) were among the largest components of household net worth. Household debt (seasonally adjusted) was $16.9 trillion.
View interactive | Accessible version | CSV | Data Dictionary |
Household Balance Sheet Summary
| Description | 2019 | 2020 | 2020:Q2 | 2020:Q3 | 2020:Q4 | 2021:Q1 |
|---|---|---|---|---|---|---|
| Net Worth | 117.88 | 131.92 | 119.63 | 123.86 | 131.92 | 136.92 |
| Change in Net Worth | 12.53 | 14.04 | 8.27 | 4.23 | 8.06 | 5.00 |
| Equities | 34.05 | 40.88 | 32.30 | 35.22 | 40.88 | 44.10 |
| Change in Equities | 7.31 | 6.83 | 5.90 | 2.93 | 5.66 | 3.22 |
| Real Estate | 29.99 | 32.84 | 31.27 | 31.95 | 32.84 | 33.78 |
| Change in Real Estate | 1.49 | 2.85 | 0.65 | 0.68 | 0.89 | 0.94 |
For more data on household net worth, see table B.101
Nonfinancial debt
Household debt grew by 6.5% in the first quarter of 2021 (this and subsequent rates of growth are reported at a seasonally adjusted annual rate). Home mortgages increased by 5.4%, about in line with the previous quarter. Nonmortgage consumer credit grew at a more moderate 3.0% pace, a slightly more rapid pace than in the fourth quarter of 2020. The increase in consumer credit reflects growth in auto loans and student loans, while credit card balances continued to decline. Robust growth in margin debt also boosted household debt growth.
Nonfinancial business debt grew at a rate of 4.4%, reflecting the second round of PPP loans and solid corporate bond issuance. Federal debt rose 6.5%. State and local debt increased 3.8%.
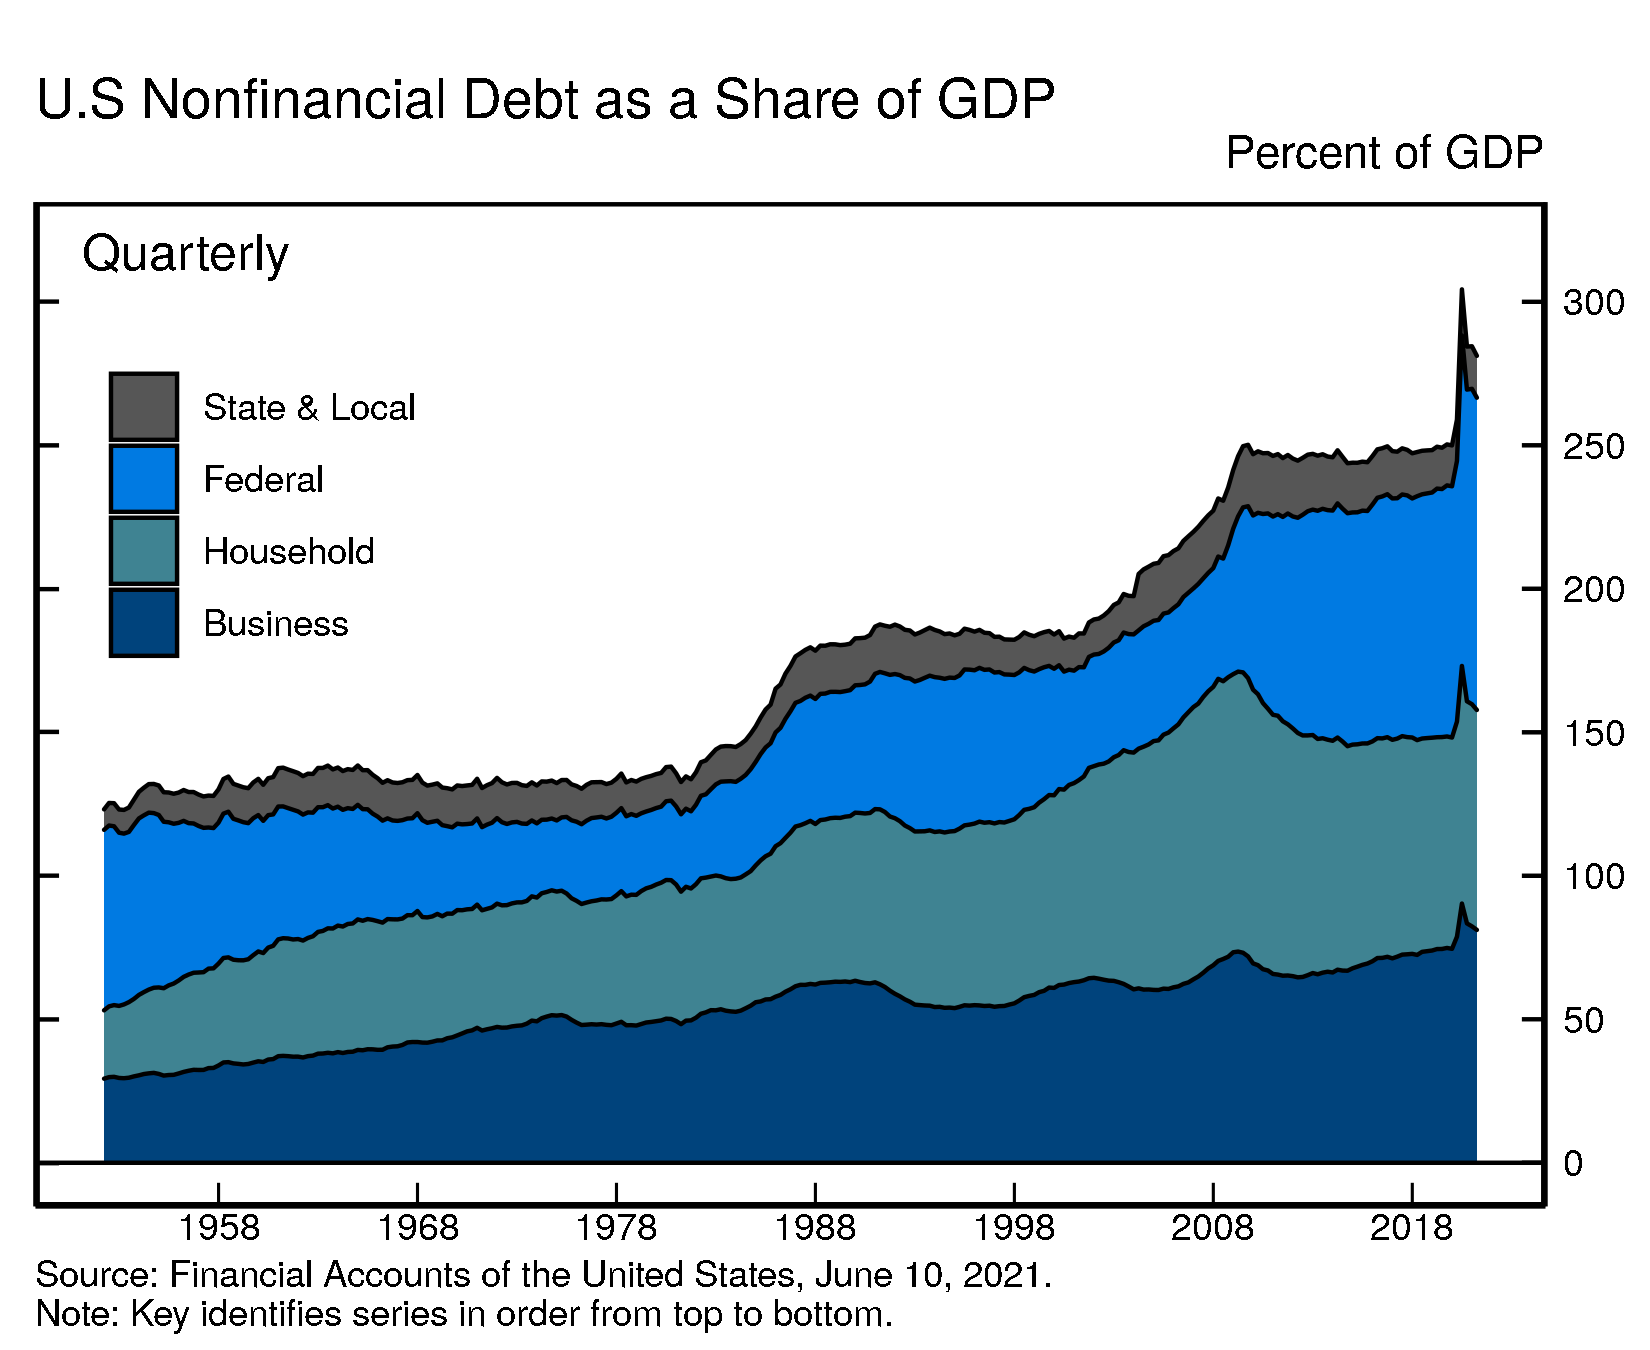
As GDP continued to grow, the ratio of nonfinancial debt to GDP moved down further. In the second quarter of 2020, the ratio had spiked, driven by the drop in GDP and the expansion in federal debt related to the fiscal stimulus.
For more data on nonfinancial debt, see table D.1 (rates of growth) and table D.3 (outstanding).
Debt Growth by Sector
| Description | 2019 | 2020 | 2020:Q2 | 2020:Q3 | 2020:Q4 | 2021:Q1 |
|---|---|---|---|---|---|---|
| Total Nonfinancial | 4.72 | 12.50 | 25.60 | 5.45 | 6.27 | 5.76 |
| Households and Nonprofits | 3.36 | 3.94 | 0.06 | 5.58 | 6.24 | 6.49 |
| Nonfinancial Business | 4.83 | 9.22 | 15.16 | 0.65 | 1.08 | 4.39 |
| Federal Government | 6.58 | 24.06 | 59.23 | 9.10 | 10.93 | 6.53 |
| State and Local Governments | 0.34 | 2.88 | 3.45 | 5.53 | 1.55 | 3.82 |
Debt Outstanding by Sector
| Description | 2019 | 2020 | 2020:Q2 | 2020:Q3 | 2020:Q4 | 2021:Q1 |
|---|---|---|---|---|---|---|
| Total Nonfinancial | 54.36 | 61.15 | 59.40 | 60.21 | 61.15 | 62.03 |
| Households and Nonprofits | 16.01 | 16.64 | 16.16 | 16.38 | 16.64 | 16.91 |
| Nonfinancial Business | 16.21 | 17.71 | 17.63 | 17.66 | 17.71 | 17.90 |
| Federal Government | 19.04 | 23.62 | 22.48 | 22.99 | 23.62 | 24.01 |
| State and Local Governments | 3.10 | 3.19 | 3.13 | 3.18 | 3.19 | 3.22 |
Accessible version | CSV | Data Dictionary |
Accessible version | CSV | Data Dictionary |
Looking at the various components of nonfinancial business debt, nonmortgage depository loans to nonfinancial business increased very modestly, on net, by $11 billion. Excluding the loans extended under the Paycheck Protection Program, nonmortgage depository loans declined. Moreover, the extension of new PPP loans was partially offset by the forgiveness of some of the PPP loans extended in 2020. A technical Q&A (www.federalreserve.gov/releases/z1/z1_technical_qa.htm) provides additional details on the treatment of PPP loans in the Financial Accounts.
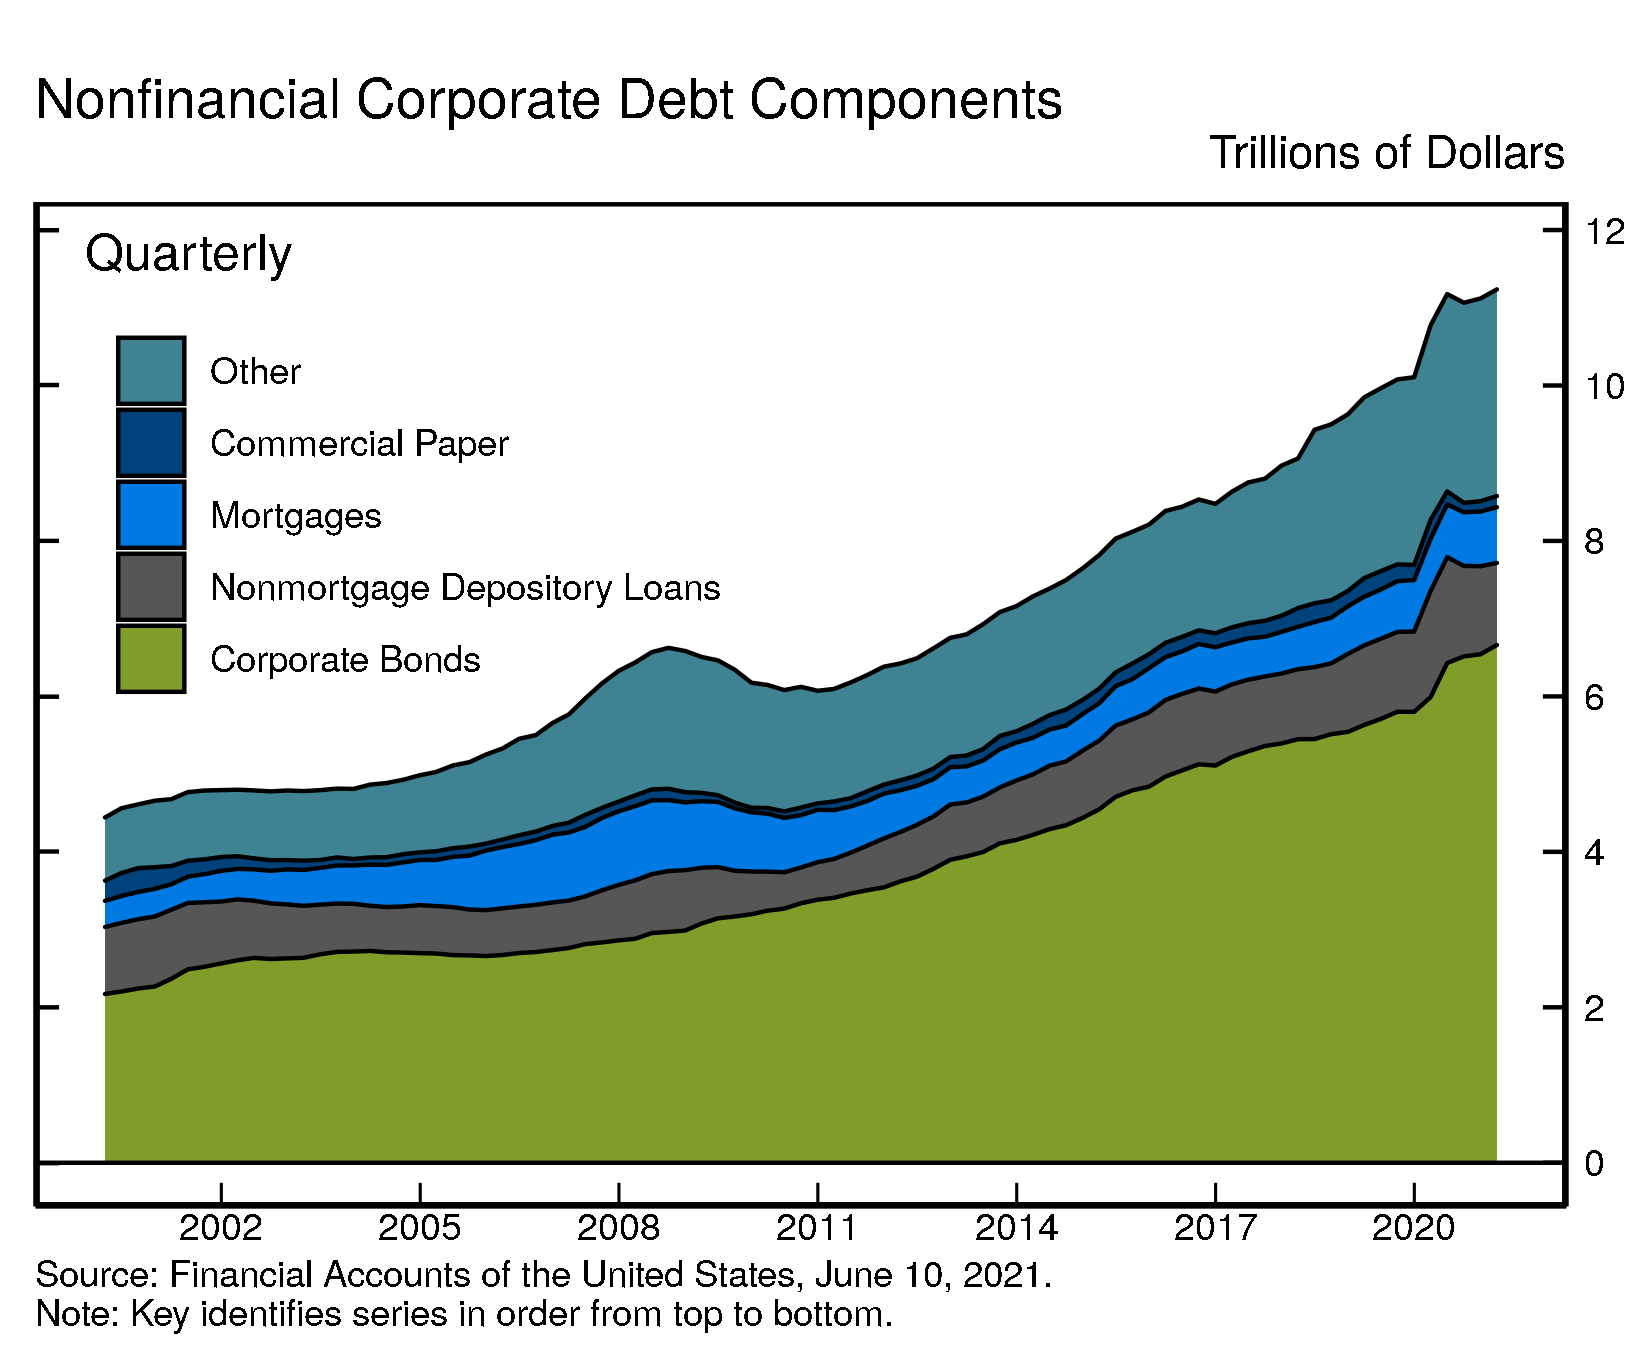
Overall, outstanding nonfinancial corporate debt was $11.2 trillion. Corporate bonds, at roughly $6.7 trillion, accounted for 60% of the total. Nonmortgage depository loans were about $1.1 trillion. Other types of debt include loans from nonbank institutions, loans from the federal government, and commercial paper.
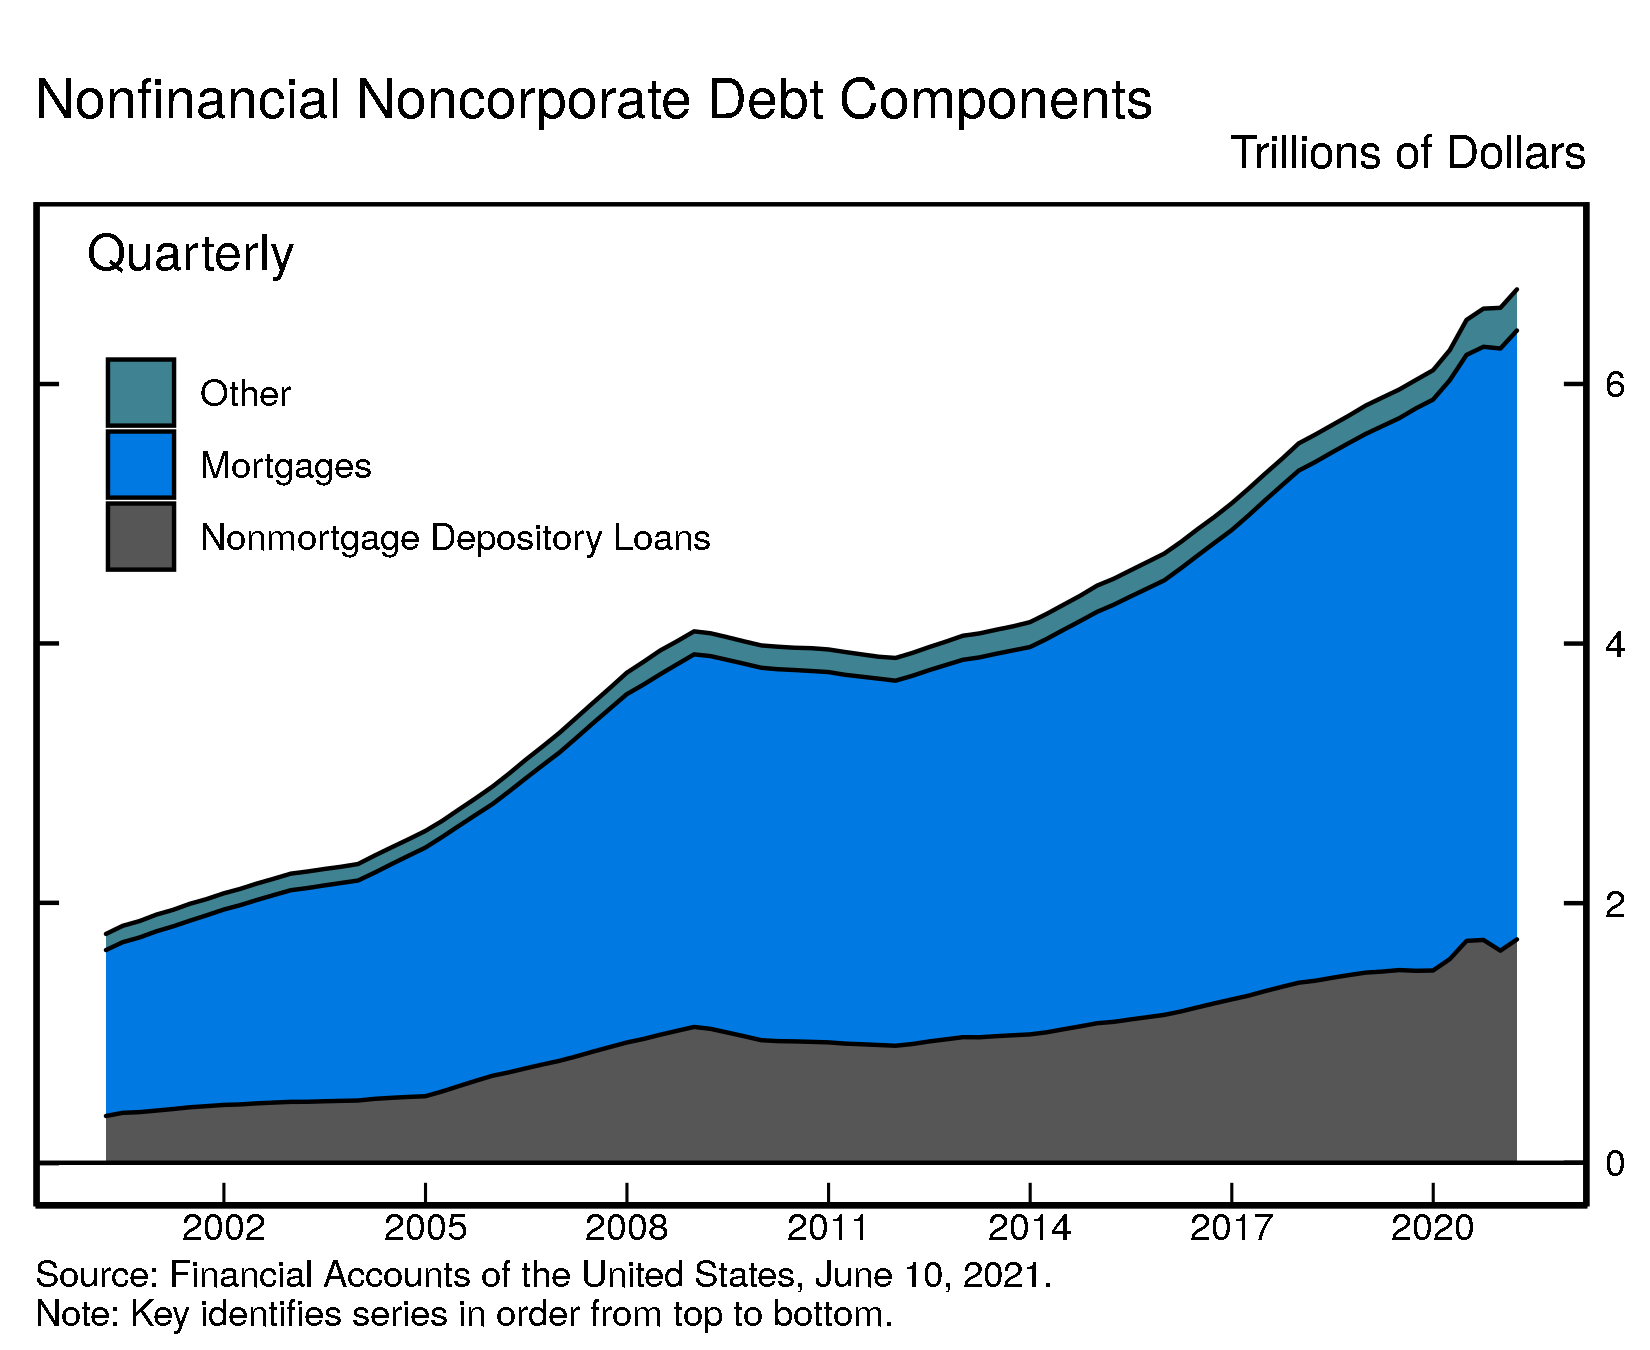
The nonfinancial noncorporate business sector consists mostly of smaller businesses, which are typically not incorporated. Nonfinancial noncorporate business debt was $6.7 trillion, of which $4.7 trillion were mortgage loans and $1.7 trillion were nonmortgage depository loans.
Accessible version | CSV | Data Dictionary |
Accessible version | CSV | Data Dictionary |
For more data on nonfinancial business balance sheets, including debt, see tables B.103 and B.104
Coming soon
- The Distributional Financial Accounts, which provide a quarterly measure of the distribution of U.S. household wealth, will be published on Friday, June 18. Other Enhanced Financial Accounts Projects (www.federalreserve.gov/releases/efa/enhanced-financial-accounts.htm) will also be updated on June 18.
- Financial Accounts data for the second quarter of 2021 will be published on Thursday, September 23, 2021, at 12:00 noon.
Chart Notes
- Changes in net worth consist of transactions, revaluations, and other volume changes. Corporate equity and debt securities include directly and indirectly held securities. Real estate is the value of owner-occupied real estate. Other includes equity in noncorporate businesses, consumer durable goods, fixed assets of nonprofit organizations, and all other financial assets apart from corporate equities and debt securities, net of liabilities, as shown on table B.101 Balance Sheet of Households and Nonprofit Organizations
Depository loans include bank loans (bank credit) and loans from nonbank depository institutions such as credit unions and savings and loans associations.↩