Financial Accounts of the United States - Z.1
Recent Developments RSS Data Download
The recent developments discussed below refer to data through September 30, 2021.
- Household net worth increased by $2.4 trillion in the third quarter, in part reflecting gains in house prices.
- Household debt grew at an annual pace of 6.2%, as both home mortgages and consumer credit grew rapidly.
- Nonfinancial business debt increased at an annual rate of 3.9%. Corporate bonds, commercial mortgages, and nonbank loans continued to increase, but nonmortgage depository loans declined.1
Household Net Worth
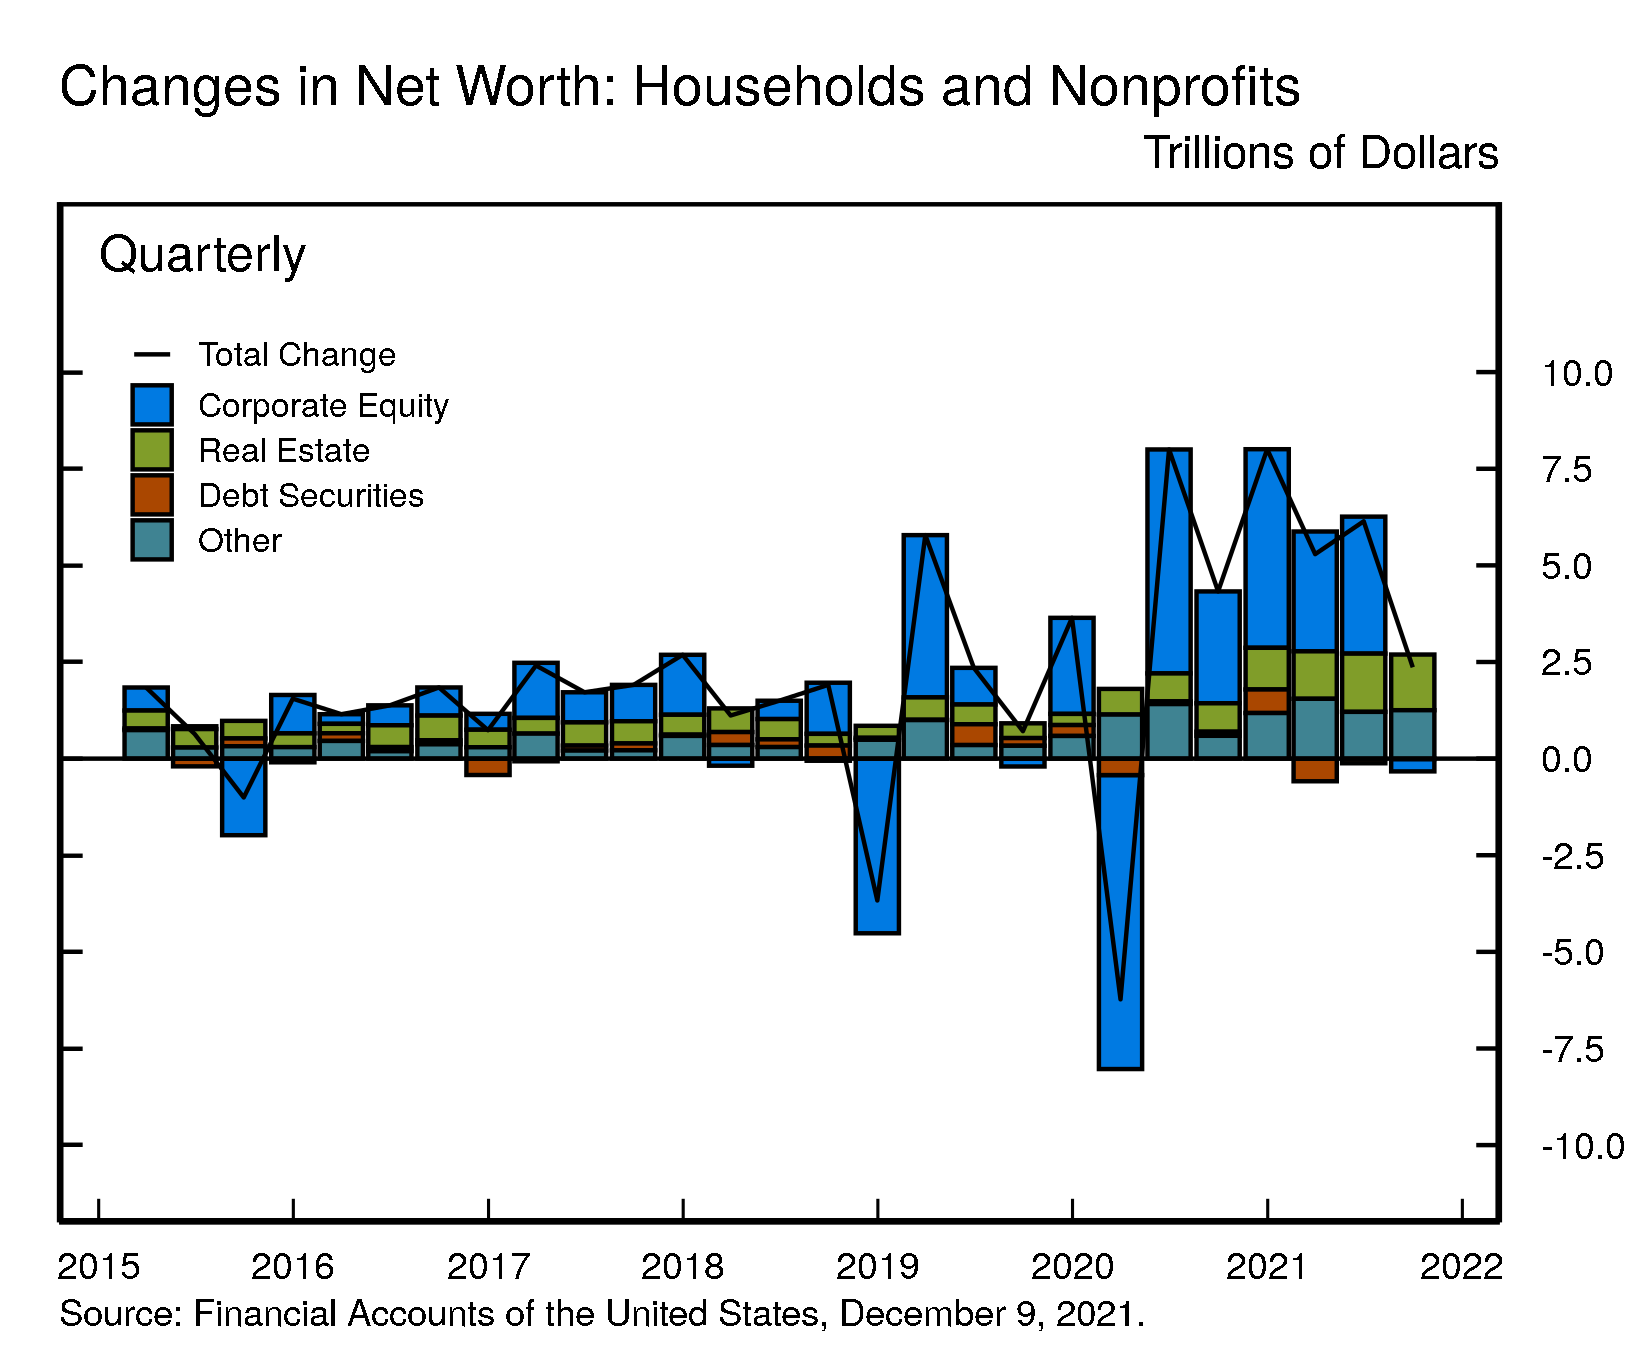
The net worth of households and nonprofit organizations increased by $2.4 trillion to $144.7 trillion in the third quarter. The value of real estate held by households increased by about $1.4 trillion largely because of gains in home prices. The value of directly and indirectly held corporate equities decreased by $0.3 trillion, in line with the decline in stock prices. After more than a year of solid growth, household net worth is now $27.8 trillion above its level at the end of 2019.
View interactive | Accessible version | CSV | Data Dictionary | Chart Note (1) |
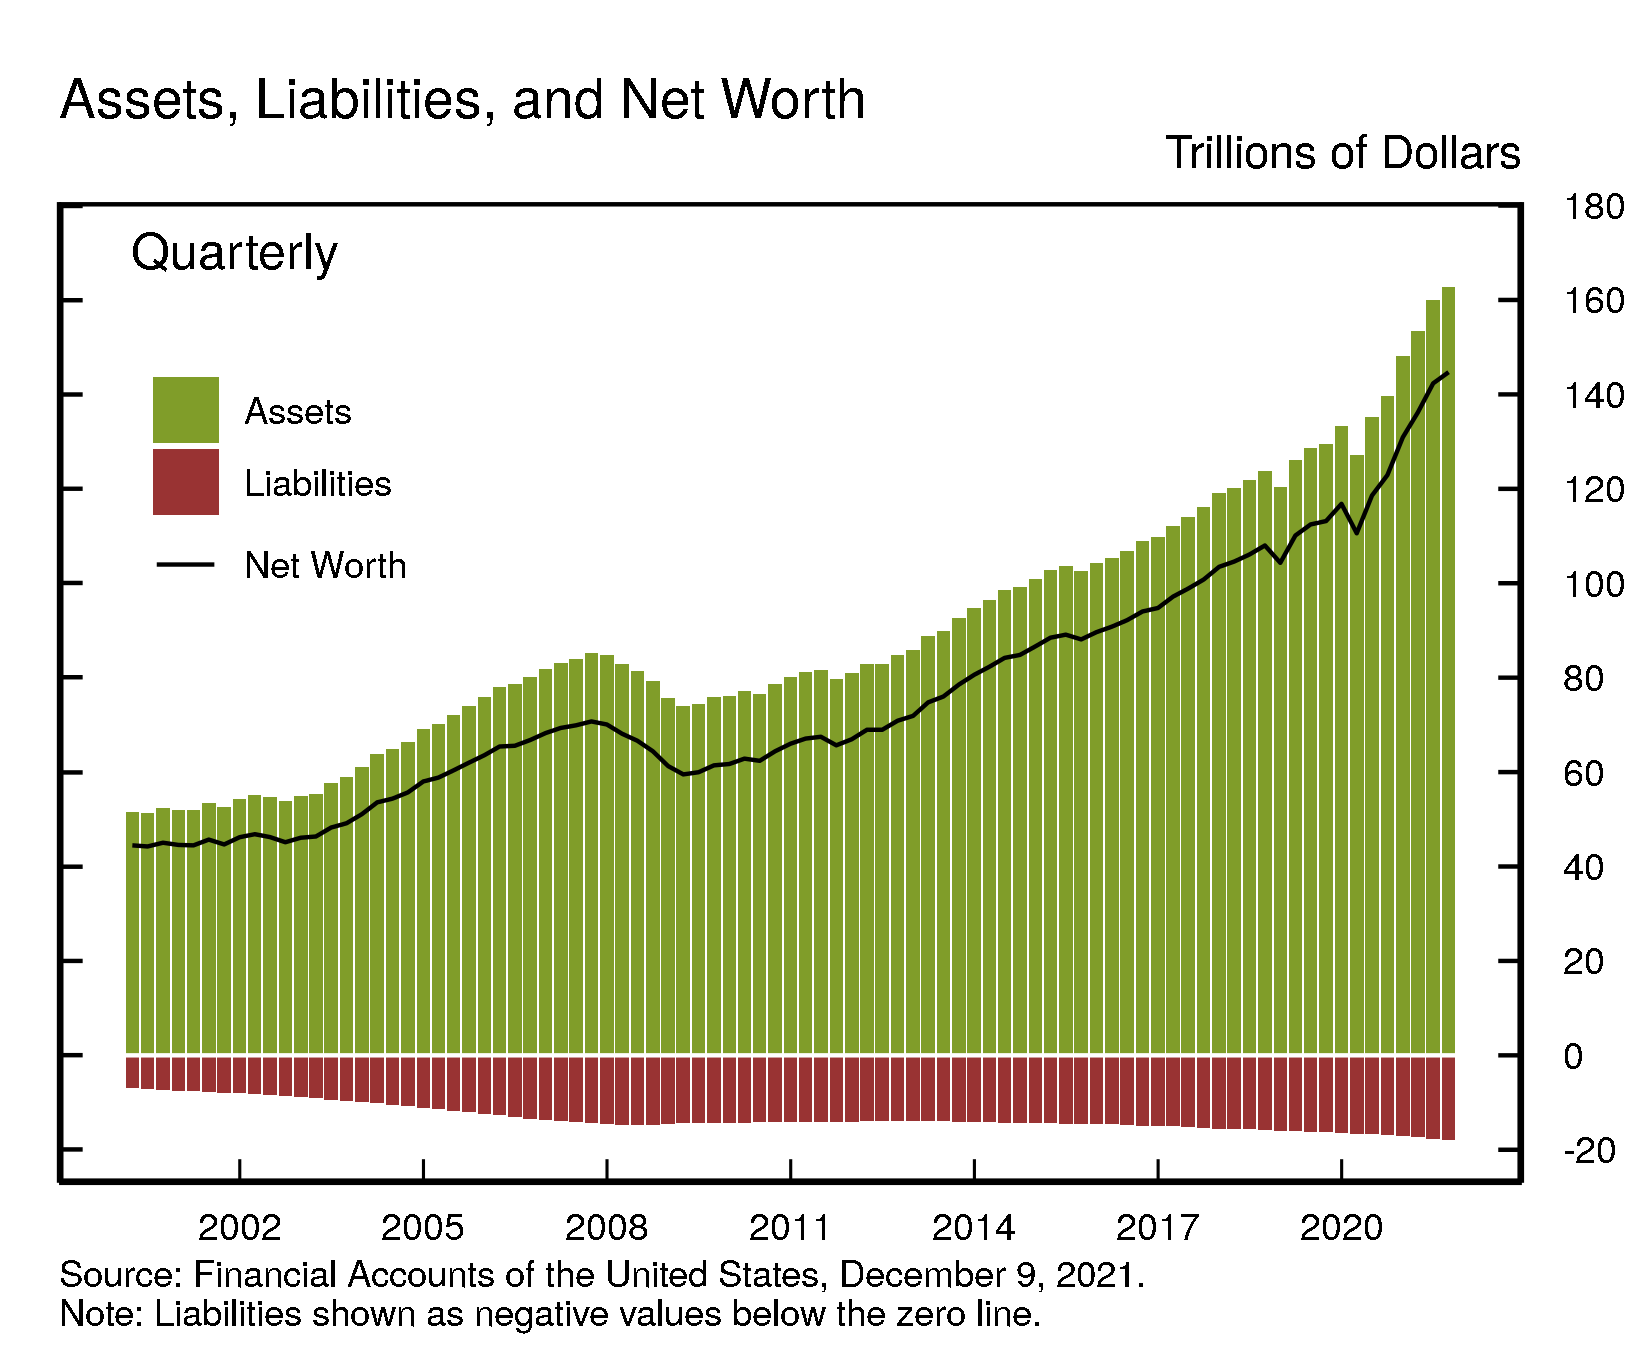
Real estate ($36.8 trillion) and directly and indirectly held corporate equities ($46.7 trillion) were among the largest components of household net worth. Household debt (seasonally adjusted) was $17.6 trillion.
View interactive | Accessible version | CSV | Data Dictionary |
Household Balance Sheet Summary
| Description | 2019 | 2020 | 2020:Q4 | 2021:Q1 | 2021:Q2 | 2021:Q3 |
|---|---|---|---|---|---|---|
| Net Worth | 116.81 | 130.92 | 130.92 | 136.21 | 142.35 | 144.71 |
| Change in Net Worth | 12.48 | 14.10 | 8.01 | 5.29 | 6.14 | 2.36 |
| Equities | 34.13 | 40.35 | 40.35 | 43.45 | 47.00 | 46.68 |
| Change in Equities | 7.43 | 6.22 | 5.14 | 3.10 | 3.54 | -0.32 |
| Real Estate | 29.99 | 32.99 | 32.99 | 34.18 | 35.55 | 36.81 |
| Change in Real Estate | 1.49 | 3.00 | 0.94 | 1.19 | 1.37 | 1.26 |
For more data on household net worth, see table B.101
Nonfinancial debt
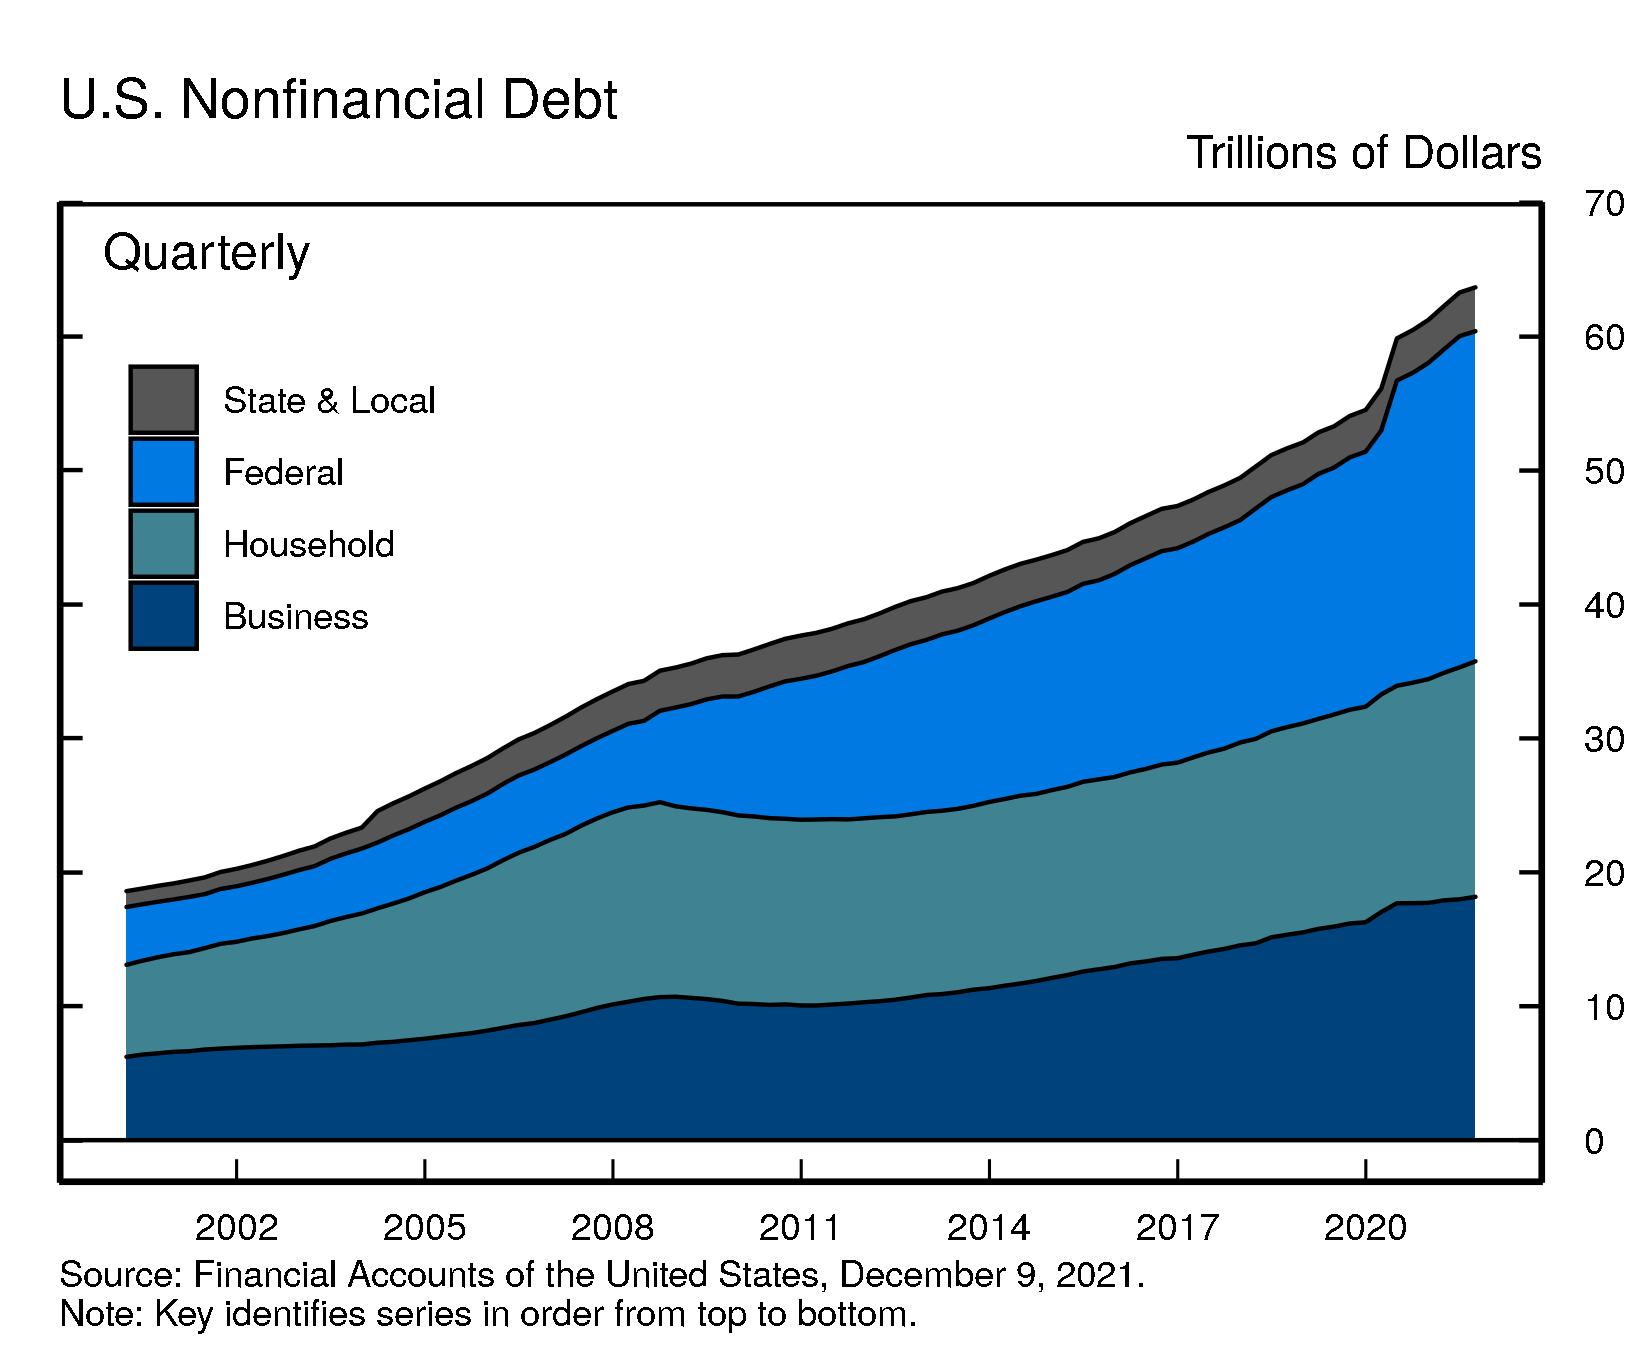
Household debt grew by 6.2% in the third quarter of 2021 (this and subsequent rates of growth are reported at a seasonally adjusted annual rate), a touch less rapidly than in the first half of the year. Home mortgages increased by 7.8%, spurred by rising home prices and sale activity, and nonmortgage consumer credit increased by 5.3%, as credit cards, auto loans, and student debt all increased.
Nonfinancial business debt grew at a rate of 3.9%, reflecting continuing growth in commercial mortagages, nonbank loans, and corporate bonds and a decline in nonmortgage depository loans. Federal debt edged down by 1.3%. State and local debt increased 1.7%.
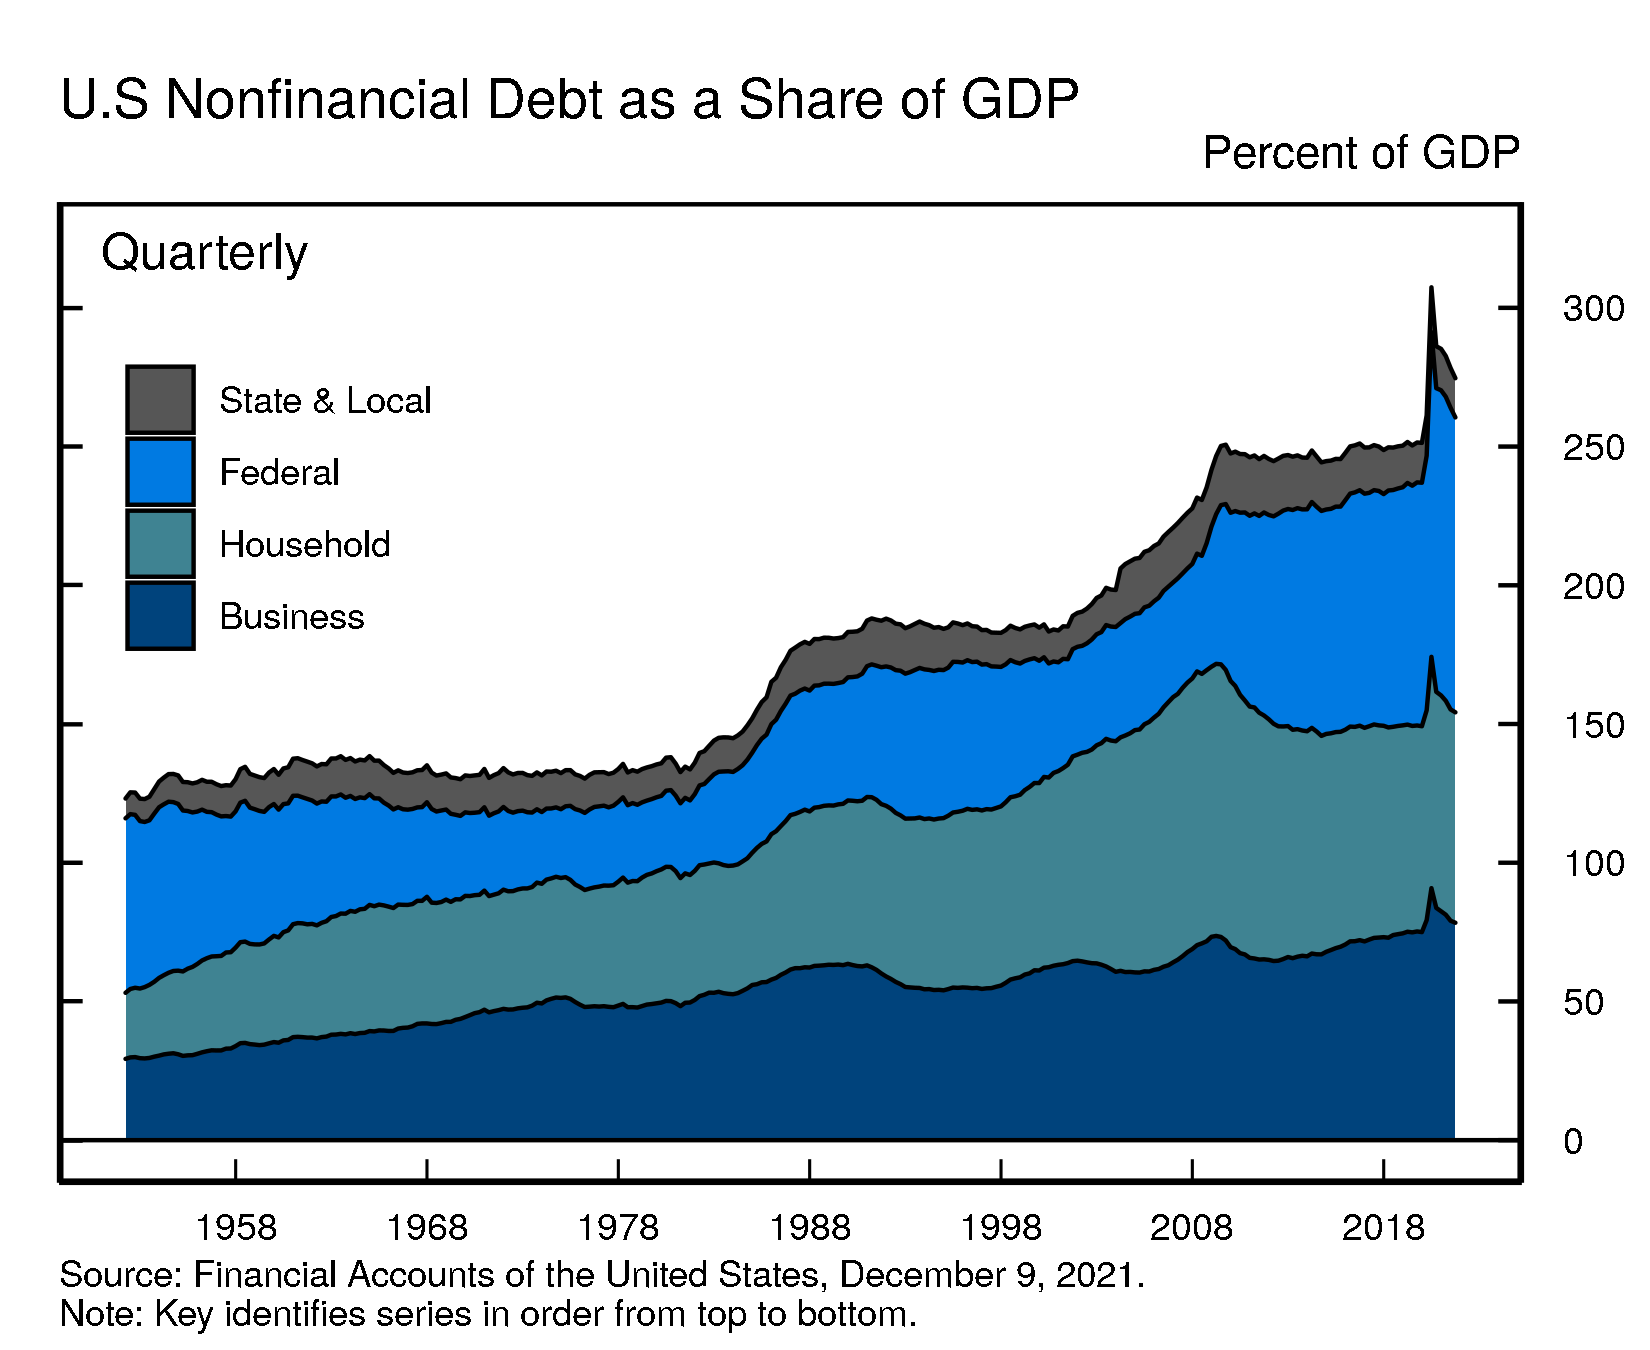
As GDP continued to grow, the ratio of nonfinancial debt to GDP edged down a bit further. In the second quarter of 2020, the ratio had spiked, driven by the drop in GDP and the expansion in federal debt related to the fiscal stimulus.
For more data on nonfinancial debt, see table D.1 (rates of growth) and table D.3 (outstanding).
Debt Growth by Sector
| Description | 2019 | 2020 | 2020:Q4 | 2021:Q1 | 2021:Q2 | 2021:Q3 |
|---|---|---|---|---|---|---|
| Total Nonfinancial | 4.68 | 12.35 | 5.09 | 6.73 | 6.51 | 2.36 |
| Households and Nonprofits | 3.29 | 3.82 | 6.08 | 6.74 | 7.78 | 6.16 |
| Nonfinancial Business | 4.86 | 8.90 | 0.45 | 4.29 | 1.75 | 3.86 |
| Federal Government | 6.58 | 24.06 | 8.42 | 8.98 | 9.58 | -1.32 |
| State and Local Governments | -0.04 | 2.94 | 1.56 | 3.47 | 3.17 | 1.70 |
Debt Outstanding by Sector
| Description | 2019 | 2020 | 2020:Q4 | 2021:Q1 | 2021:Q2 | 2021:Q3 |
|---|---|---|---|---|---|---|
| Total Nonfinancial | 54.53 | 61.26 | 61.26 | 62.29 | 63.30 | 63.68 |
| Households and Nonprofits | 16.10 | 16.71 | 16.71 | 16.99 | 17.32 | 17.59 |
| Nonfinancial Business | 16.27 | 17.72 | 17.72 | 17.91 | 17.99 | 18.17 |
| Federal Government | 19.04 | 23.62 | 23.62 | 24.15 | 24.73 | 24.65 |
| State and Local Governments | 3.12 | 3.21 | 3.21 | 3.24 | 3.26 | 3.27 |
Accessible version | CSV | Data Dictionary |
Accessible version | CSV | Data Dictionary |
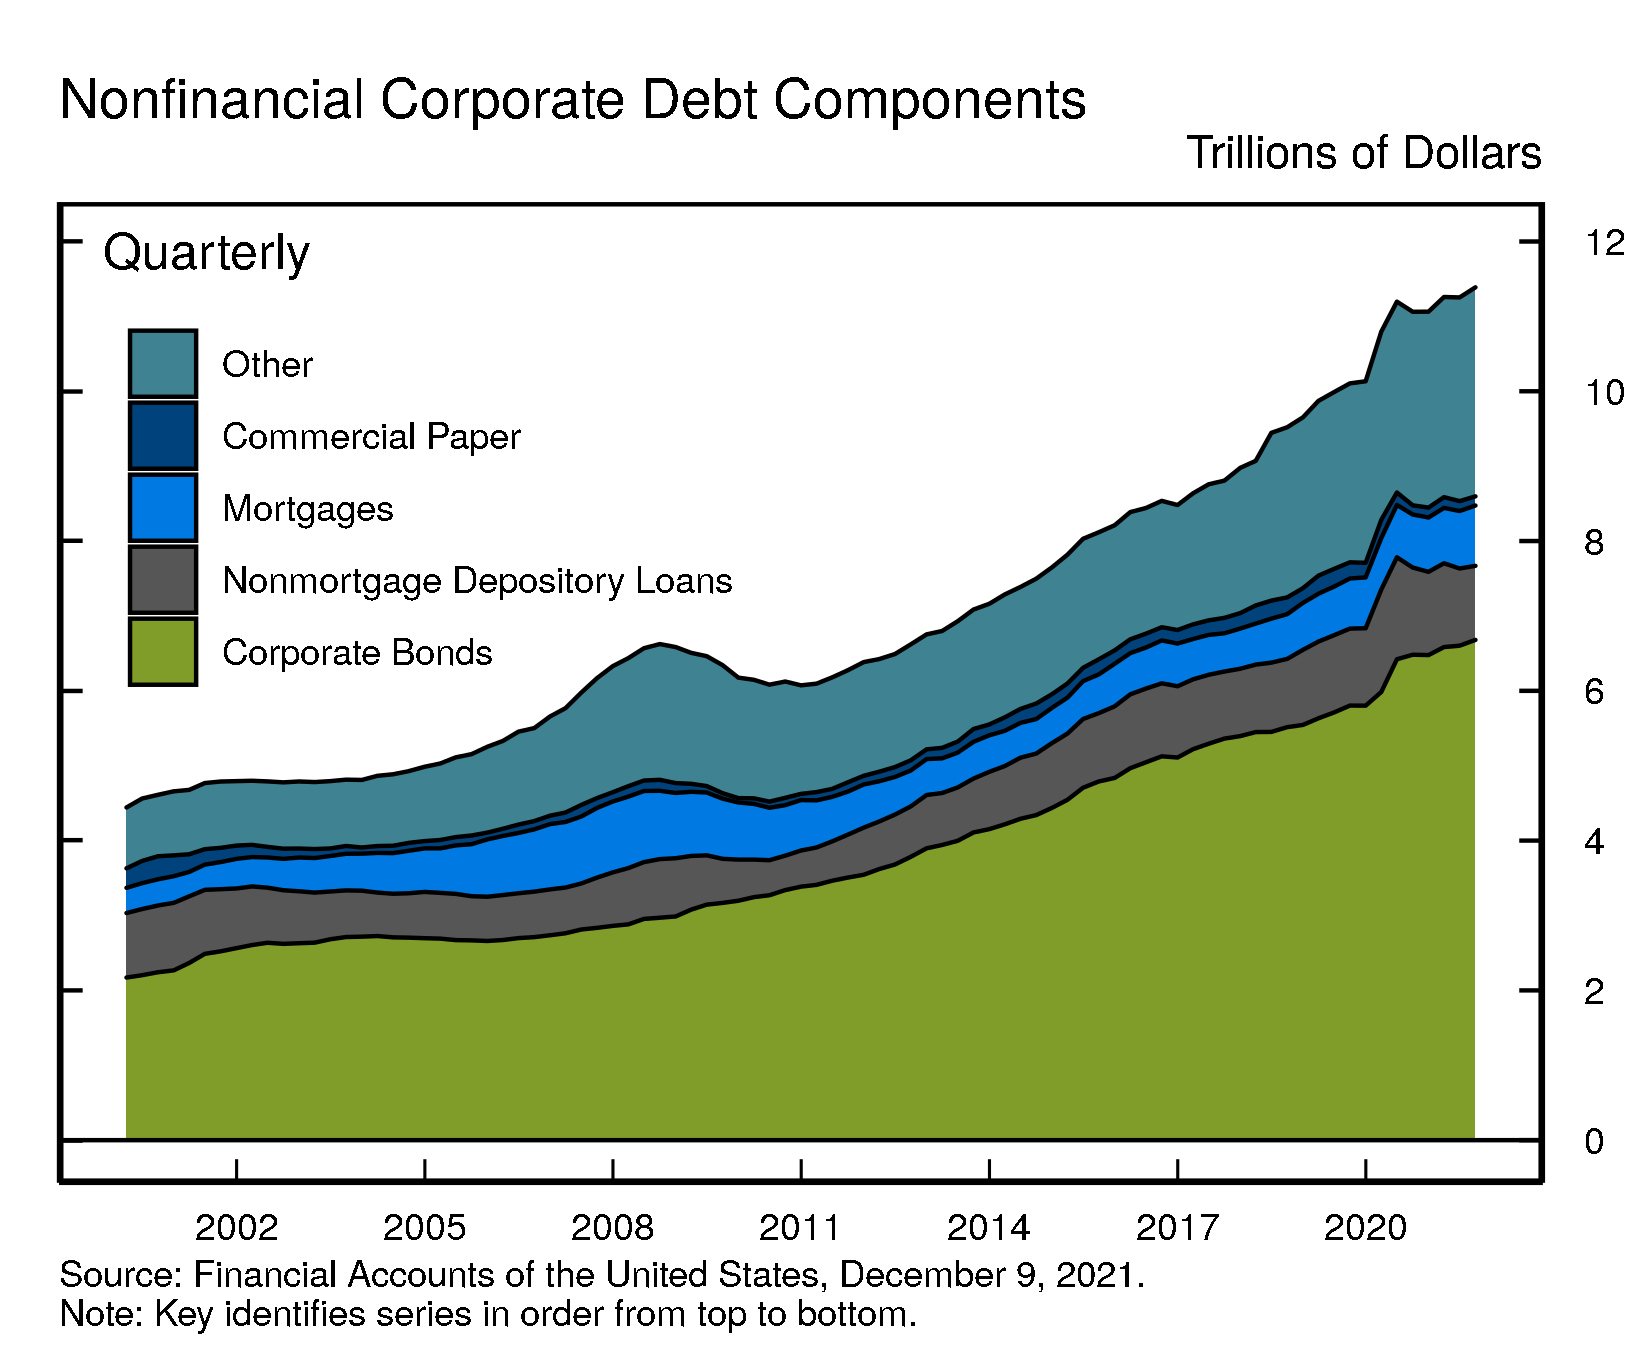
Looking at the various components of nonfinancial business debt, nonmortgage depository loans to nonfinancial business decreased $100 billion in the third quarter. Contributing to the decline was the continued forgiveness of many loans extended under the Paycheck Protection Program (PPP). About $240 billion of PPP loans were on the lenders' balance sheet at the end of the third quarter and thus are still included in our measure of nonfinancial business debt. A technical Q&A (www.federalreserve.gov/releases/z1/z1_technical_qa.htm) provides additional details on the treatment of PPP loans in the Financial Accounts.
In contrast to nonmortgage depository loans, corporate bonds, commercial mortgages and nonbank loans continued to increase.
Overall, outstanding nonfinancial corporate debt was $11.4 trillion. Corporate bonds, at roughly $6.7 trillion, accounted for 59% of the total. Nonmortgage depository loans were about $1.0 trillion. Other types of debt include loans from nonbank institutions, loans from the federal government, and commercial paper.
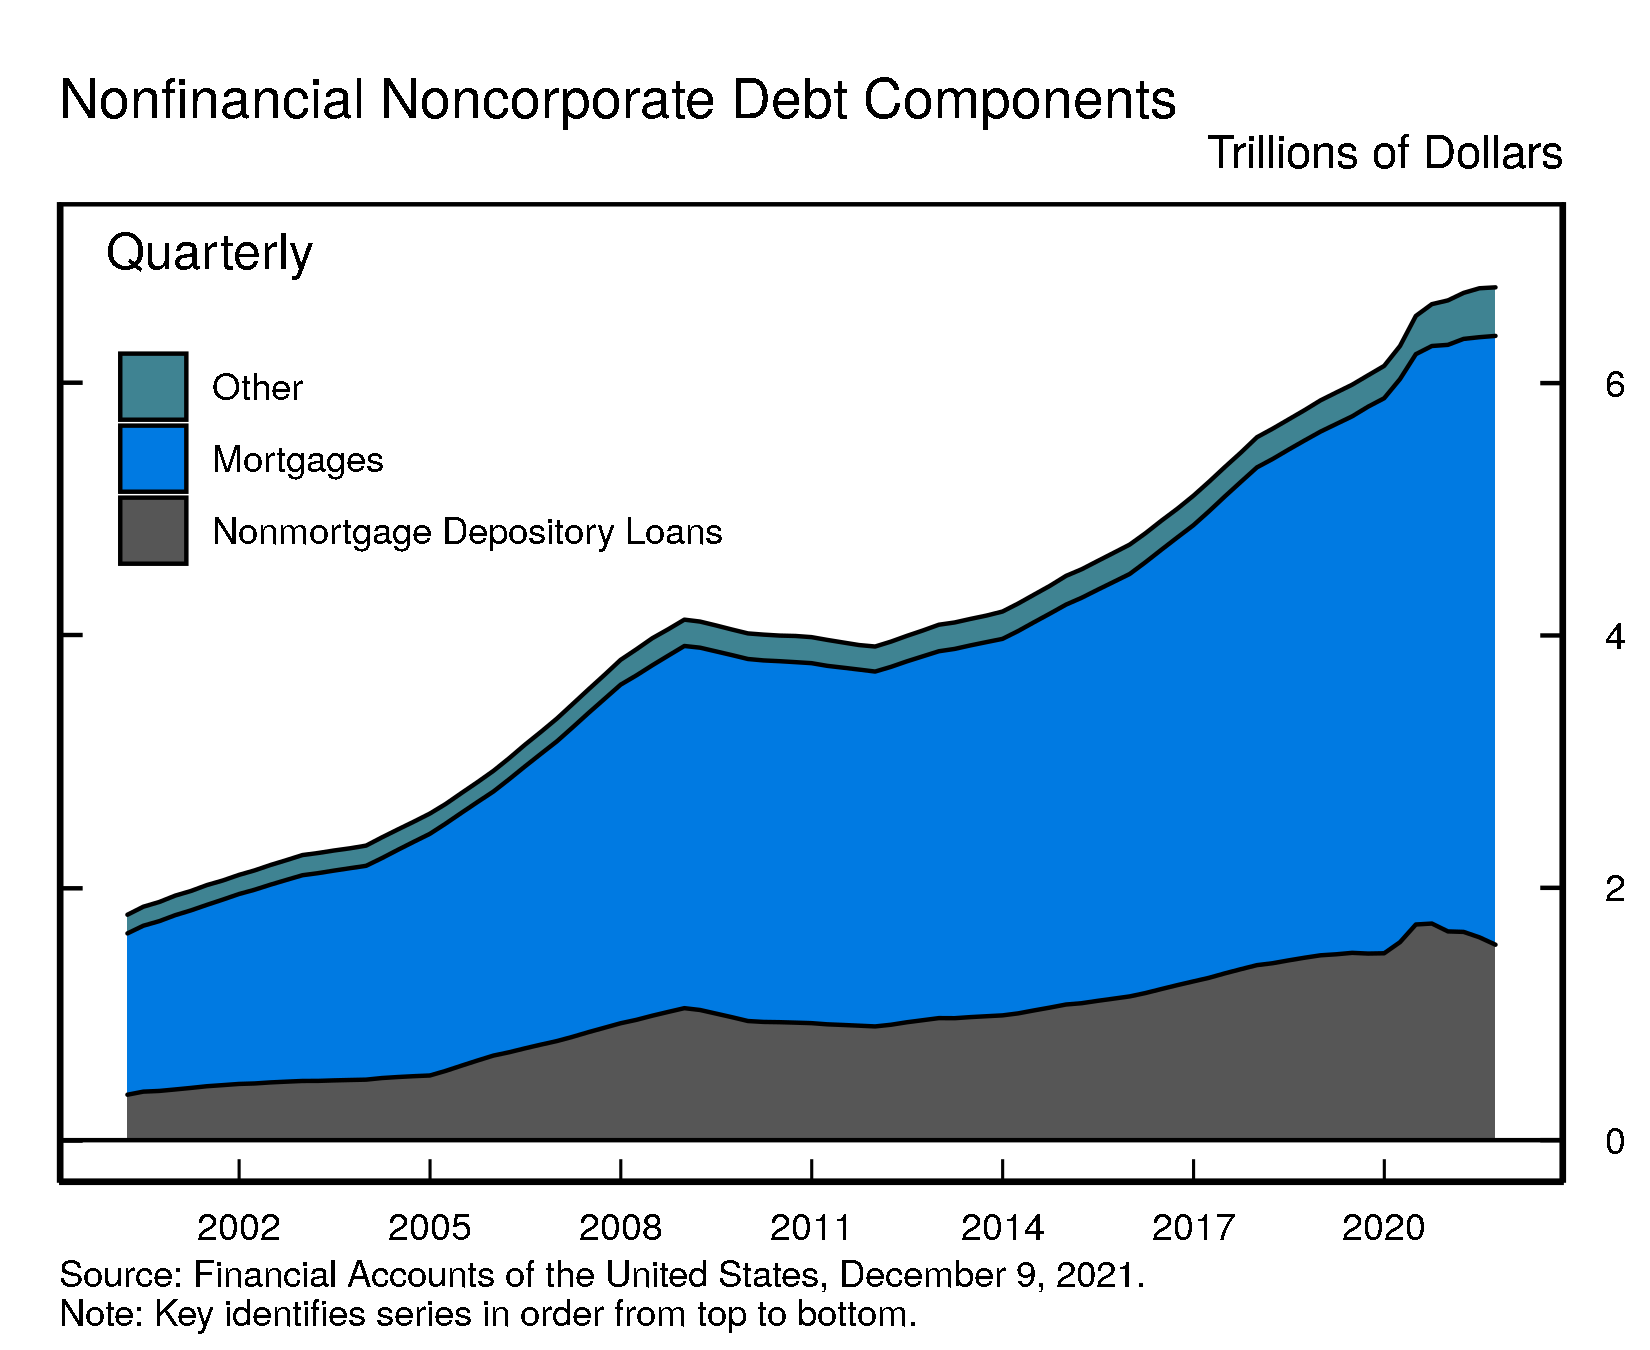
The nonfinancial noncorporate business sector consists mostly of smaller businesses, which are typically not incorporated. Nonfinancial noncorporate business debt was $6.8 trillion, of which $4.8 trillion were mortgage loans and $1.5 trillion were nonmortgage depository loans.
Accessible version | CSV | Data Dictionary |
Accessible version | CSV | Data Dictionary |
For more data on nonfinancial business balance sheets, including debt, see tables B.103 and B.104.
Coming soon
- The Distributional Financial Accounts, which provide a quarterly measure of the distribution of U.S. household wealth, will be published on Friday, December 17. Other Enhanced Financial Accounts Projects (www.federalreserve.gov/releases/efa/enhanced-financial-accounts.htm) will also be updated on Friday, December 17.
- Financial Accounts data for the fourth quarter of 2021 will be published on Thursday, March 10, 2022, at 12:00 noon.
Chart Notes
- Changes in net worth consist of transactions, revaluations, and other volume changes. Corporate equity and debt securities include directly and indirectly held securities. Real estate is the value of owner-occupied real estate. Other includes equity in noncorporate businesses, consumer durable goods, fixed assets of nonprofit organizations, and all other financial assets apart from corporate equities and debt securities, net of liabilities, as shown on table B.101 Balance Sheet of Households and Nonprofit Organizations.
Depository loans include bank loans (bank credit) and loans from nonbank depository institutions such as credit unions and savings and loans associations.↩