Financial Accounts of the United States - Z.1
Recent Developments RSS Data Download
The recent developments discussed below refer to data through March 31, 2022.
- Household net worth decreased by $0.5 trillion in the first quarter, primarily driven by a drop in stock prices and robust gains in house prices.
- Household debt grew at an annual pace of 8.3%, reflecting strong growth in both home mortgages and consumer credit.
- Nonfinancial business debt increased at an annual rate of 8.0%, boosted by a rapid expansion in loans at depository institutions and at nondepository institutions.1
Household Net Worth
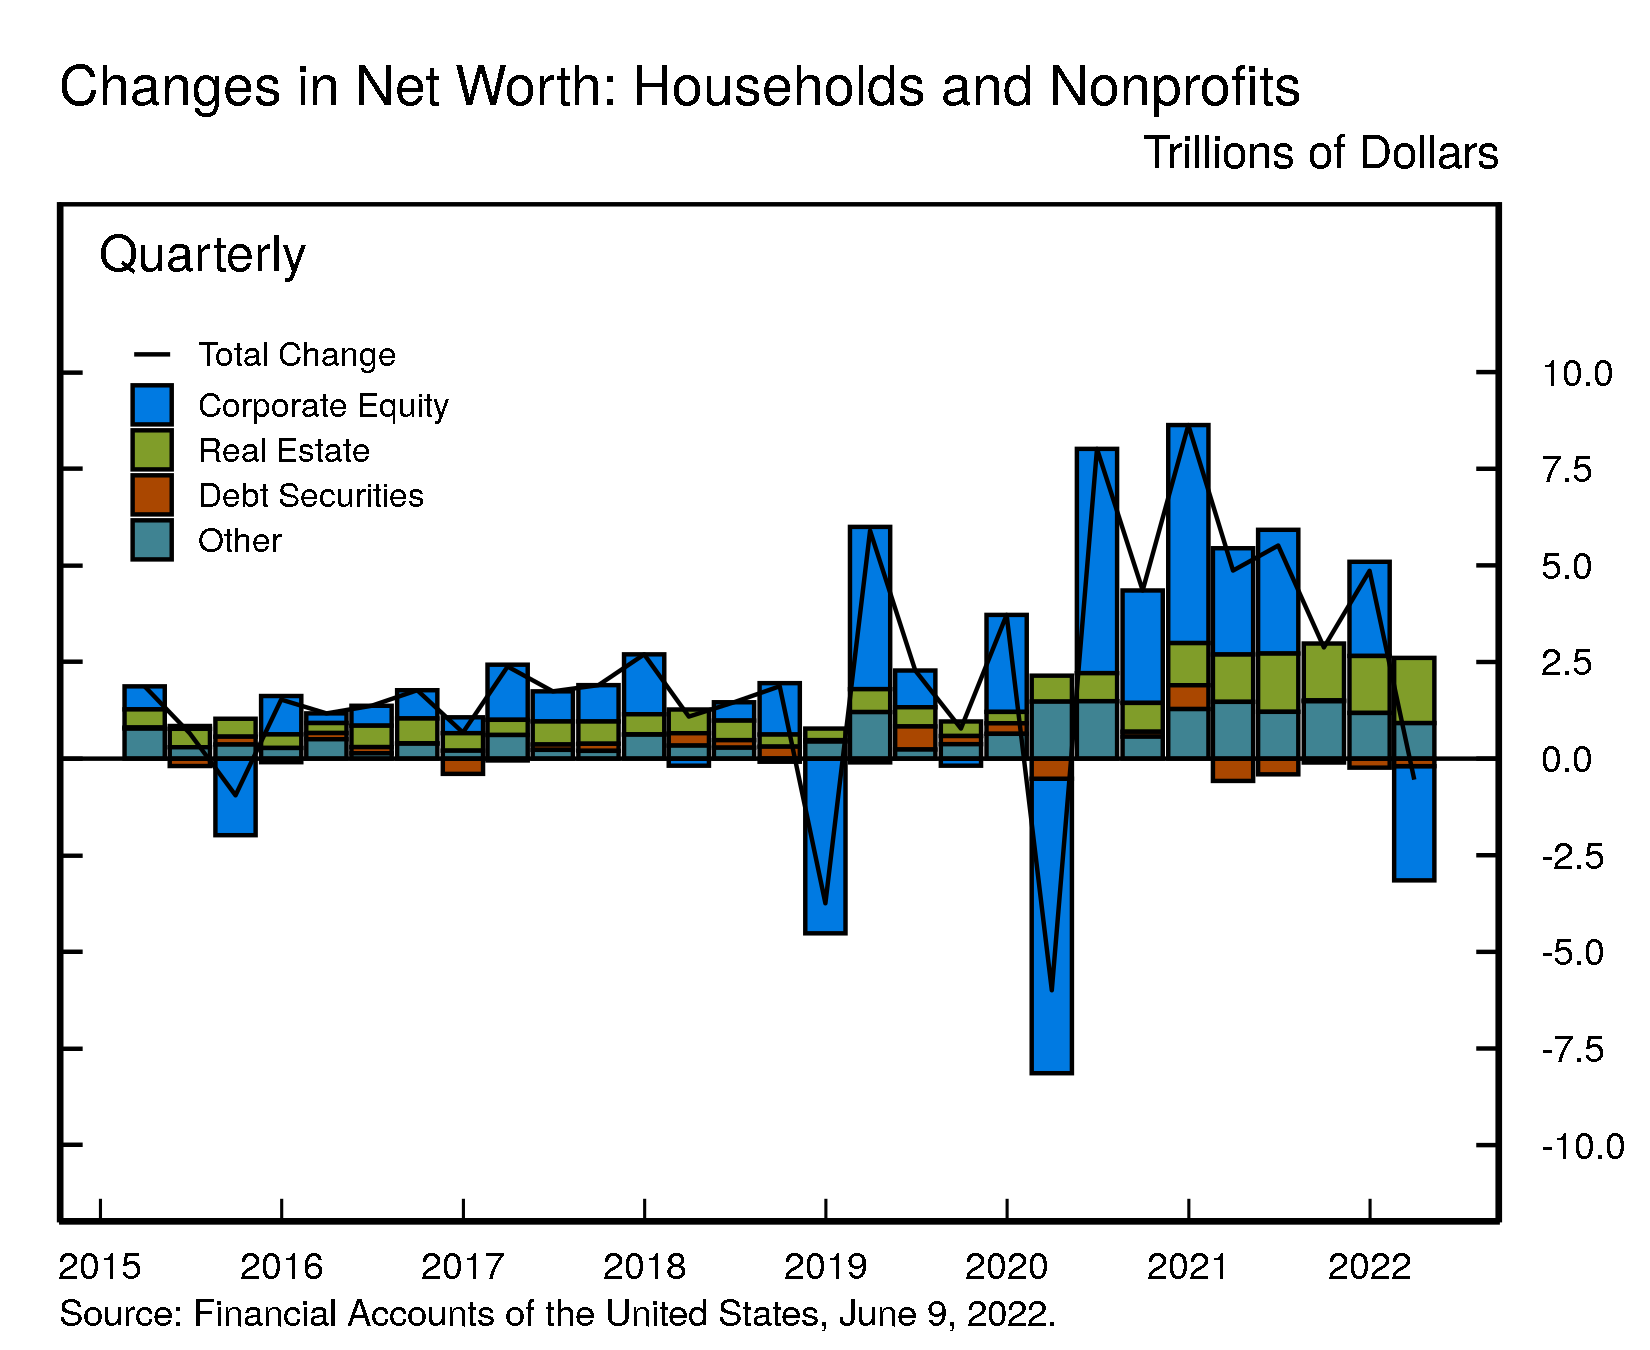
The net worth of households and nonprofit organizations declined $0.5 trillion to $149.3 trillion in the first quarter. A sizeable $3 trillion decline in the value of stocks on the household balance sheet was partially offset by an increase in the value of real estate ($1.6 trillion) and a continued high rate of personal saving. The ratio of household net worth to disposable income was about equal to the record high of 8.2 posted last quarter and remains well above the level seen just before the pandemic in 2019.
View interactive | Accessible version | CSV | Data Dictionary | Chart Note (1) |
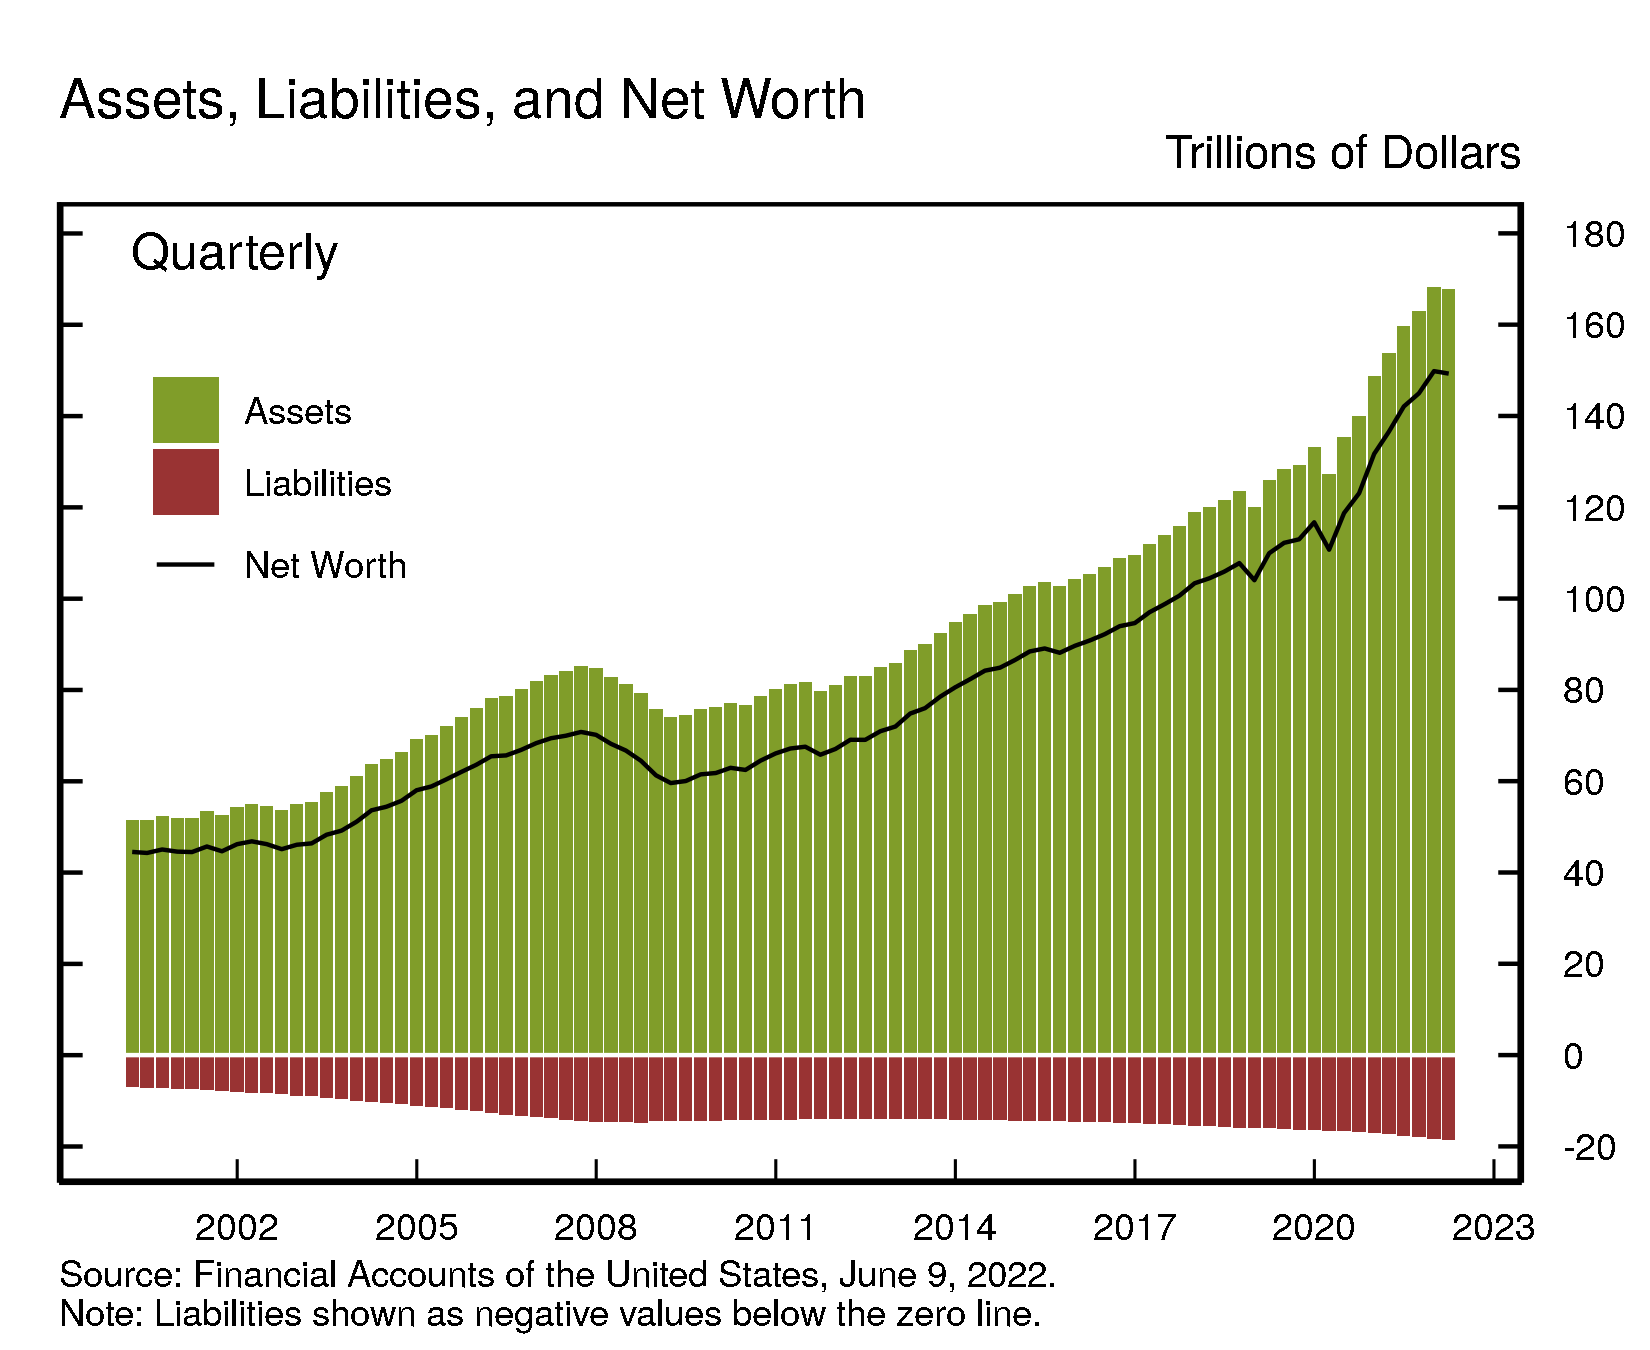
Directly and indirectly held corporate equities ($46.3 trillion) and household real estate ($39.7 trillion) were among the largest components of household net worth. Household debt (seasonally adjusted) was $18.3 trillion.
View interactive | Accessible version | CSV | Data Dictionary |
Household Balance Sheet Summary
| Description | 2020 | 2021 | 2021:Q2 | 2021:Q3 | 2021:Q4 | 2022:Q1 |
|---|---|---|---|---|---|---|
| Net Worth | 131.71 | 149.82 | 142.09 | 144.96 | 149.82 | 149.28 |
| Change in Net Worth | 15.00 | 18.12 | 5.51 | 2.88 | 4.86 | -0.54 |
| Equities | 40.92 | 49.21 | 46.88 | 46.77 | 49.21 | 46.26 |
| Change in Equities | 6.73 | 8.29 | 3.20 | -0.10 | 2.44 | -2.96 |
| Real Estate | 33.00 | 38.12 | 35.56 | 36.82 | 38.12 | 39.74 |
| Change in Real Estate | 3.00 | 5.12 | 1.37 | 1.26 | 1.29 | 1.62 |
For more data on household net worth, see table B.101
Nonfinancial debt
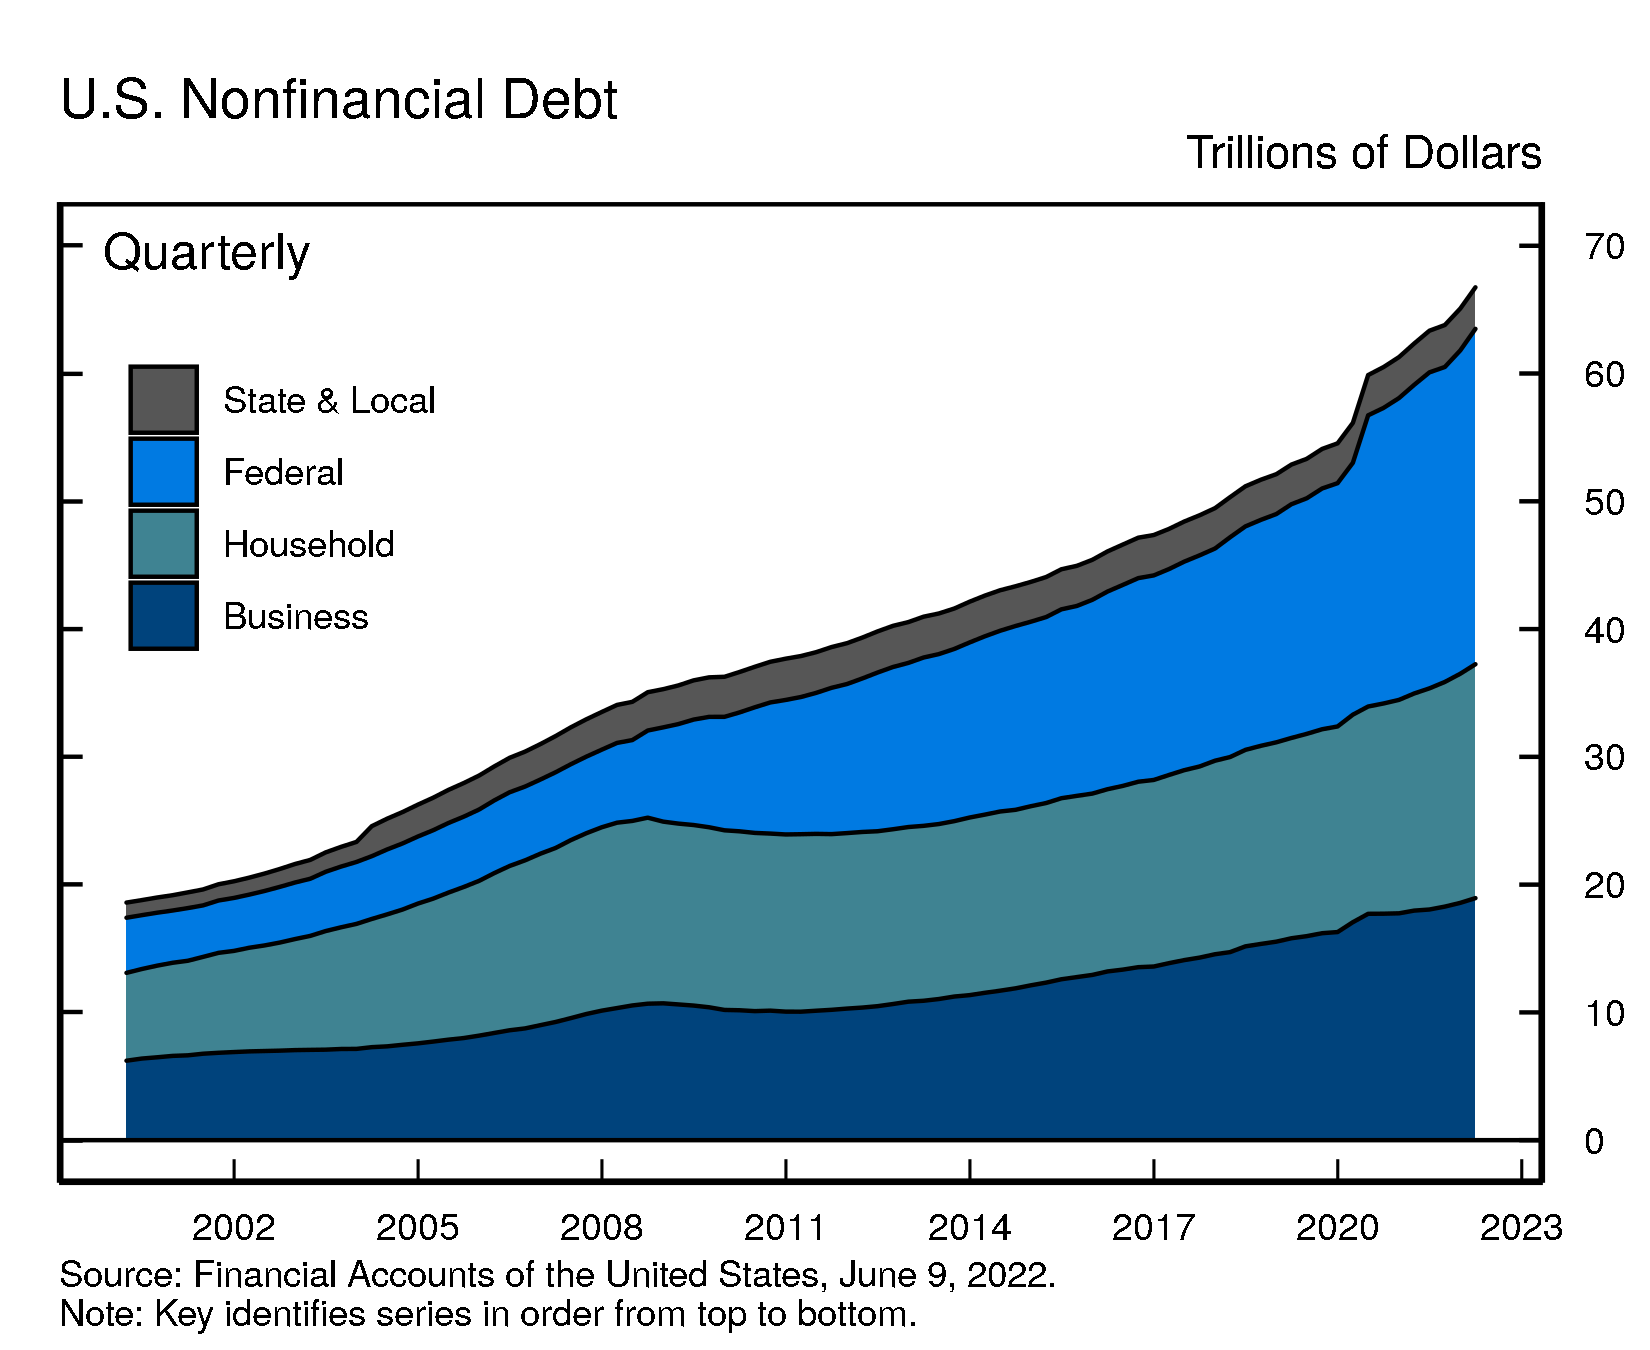
Household debt grew by 8.3% in the first quarter of 2022 (this and subsequent rates of growth are reported at a seasonally adjusted annual rate), a bit higher than in the previous quarter. Home mortgages increased by 8.6% amid surging home prices, and nonmortgage consumer credit increased by 8.7%, buoyed by rapid growth in credit card borrowing and auto loans.
Nonfinancial business debt grew at a rate of 8.0%, reflecting strong growth in loans, both from depository institutions and from nondepository institutions, and modest net issuance of corporate bonds. Federal debt increased by 14.9%. State and local debt decreased by 3.0%.
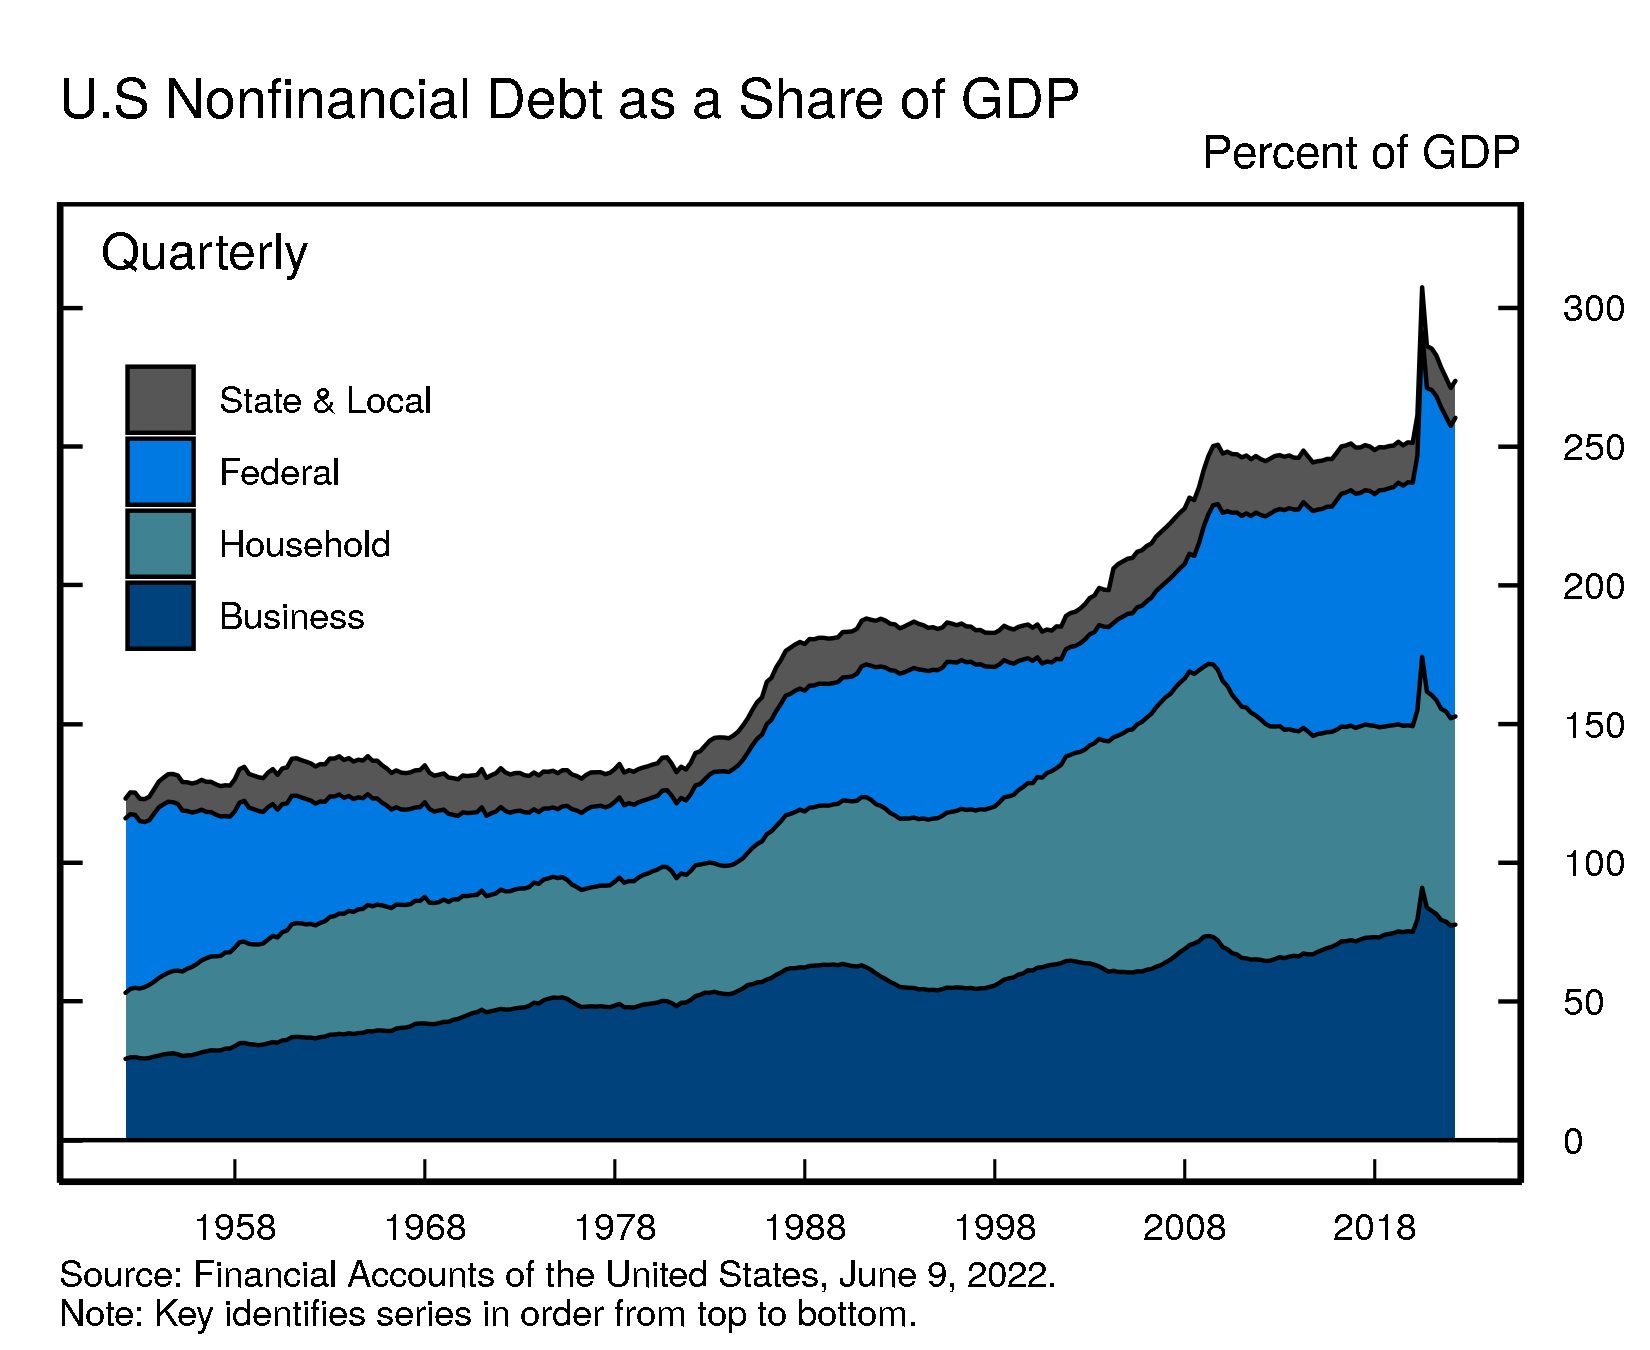
As GDP growth slowed in the first quarter, the ratio of nonfinancial debt to GDP edged up. In the second quarter of 2020, the ratio had spiked, driven by the drop in GDP and the expansion in federal debt related to the fiscal stimulus.
For more data on nonfinancial debt, see table D.1 (rates of growth) and table D.3 (outstanding).
Debt Growth by Sector
| Description | 2020 | 2021 | 2021:Q2 | 2021:Q3 | 2021:Q4 | 2022:Q1 |
|---|---|---|---|---|---|---|
| Total Nonfinancial | 12.39 | 6.23 | 6.46 | 2.80 | 8.21 | 10.20 |
| Households and Nonprofits | 3.84 | 7.37 | 7.44 | 6.38 | 7.98 | 8.32 |
| Nonfinancial Business | 9.01 | 4.70 | 1.92 | 5.00 | 6.81 | 7.98 |
| Federal Government | 24.06 | 7.13 | 9.58 | -1.32 | 10.64 | 14.88 |
| State and Local Governments | 2.88 | 2.10 | 3.22 | 2.81 | -1.05 | -3.03 |
Debt Outstanding by Sector
| Description | 2020 | 2021 | 2021:Q2 | 2021:Q3 | 2021:Q4 | 2022:Q1 |
|---|---|---|---|---|---|---|
| Total Nonfinancial | 61.29 | 65.09 | 63.35 | 63.80 | 65.09 | 66.74 |
| Households and Nonprofits | 16.70 | 17.93 | 17.31 | 17.58 | 17.93 | 18.30 |
| Nonfinancial Business | 17.75 | 18.57 | 18.05 | 18.28 | 18.57 | 18.94 |
| Federal Government | 23.62 | 25.30 | 24.73 | 24.65 | 25.30 | 26.25 |
| State and Local Governments | 3.21 | 3.27 | 3.26 | 3.28 | 3.27 | 3.25 |
Accessible version | CSV | Data Dictionary |
Accessible version | CSV | Data Dictionary |
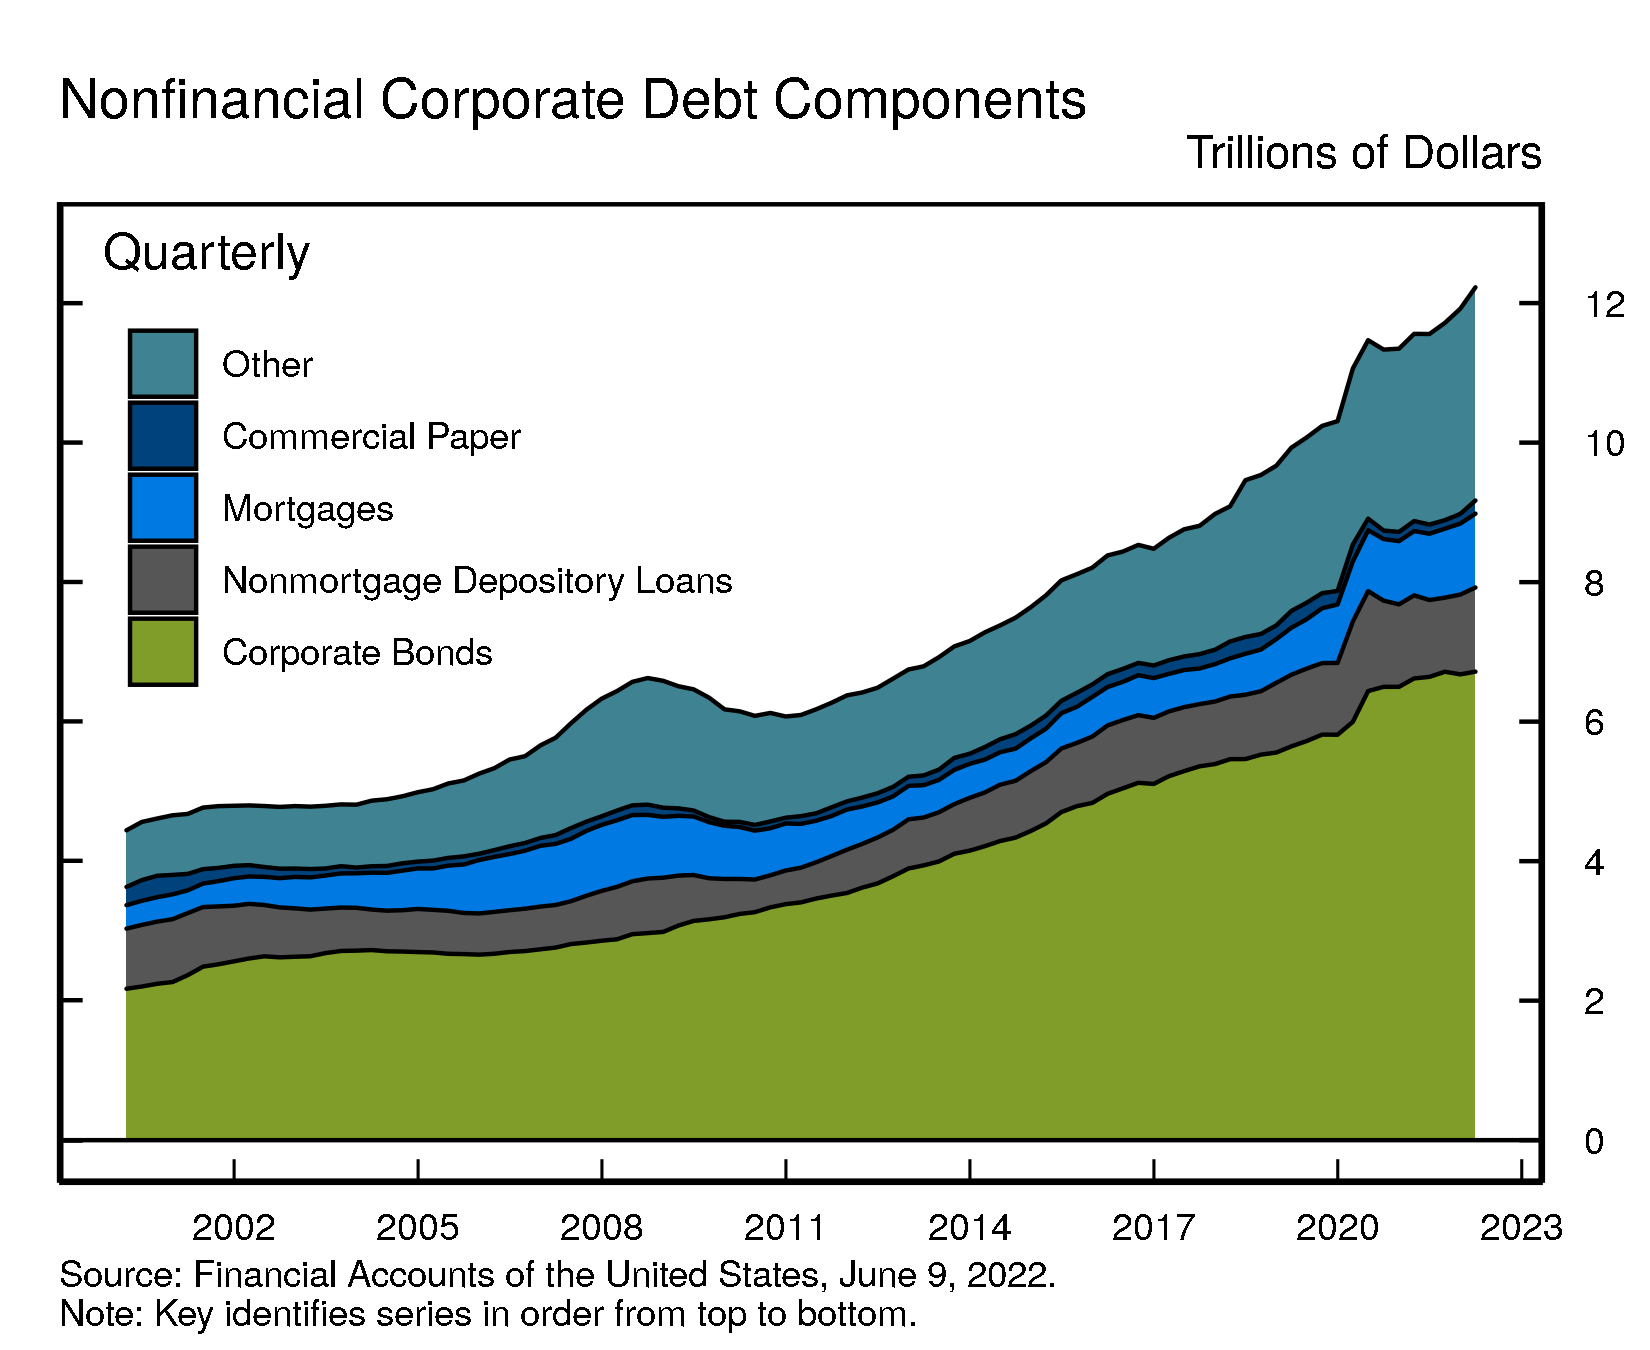
Looking at the various components of nonfinancial business debt, nonmortgage depository loans to nonfinancial business increased by $79 billion in the first quarter. Loans from nondepository institutions also increased, as did commercial mortgages and corporate bonds outstanding.
Overall, outstanding nonfinancial corporate debt was $12.2 trillion. Corporate bonds, at roughly $6.7 trillion, accounted for 55% of the total. Nonmortgage depository loans were about $1.2 trillion. Other types of debt include loans from nonbank institutions, loans from the federal government, and commercial paper.
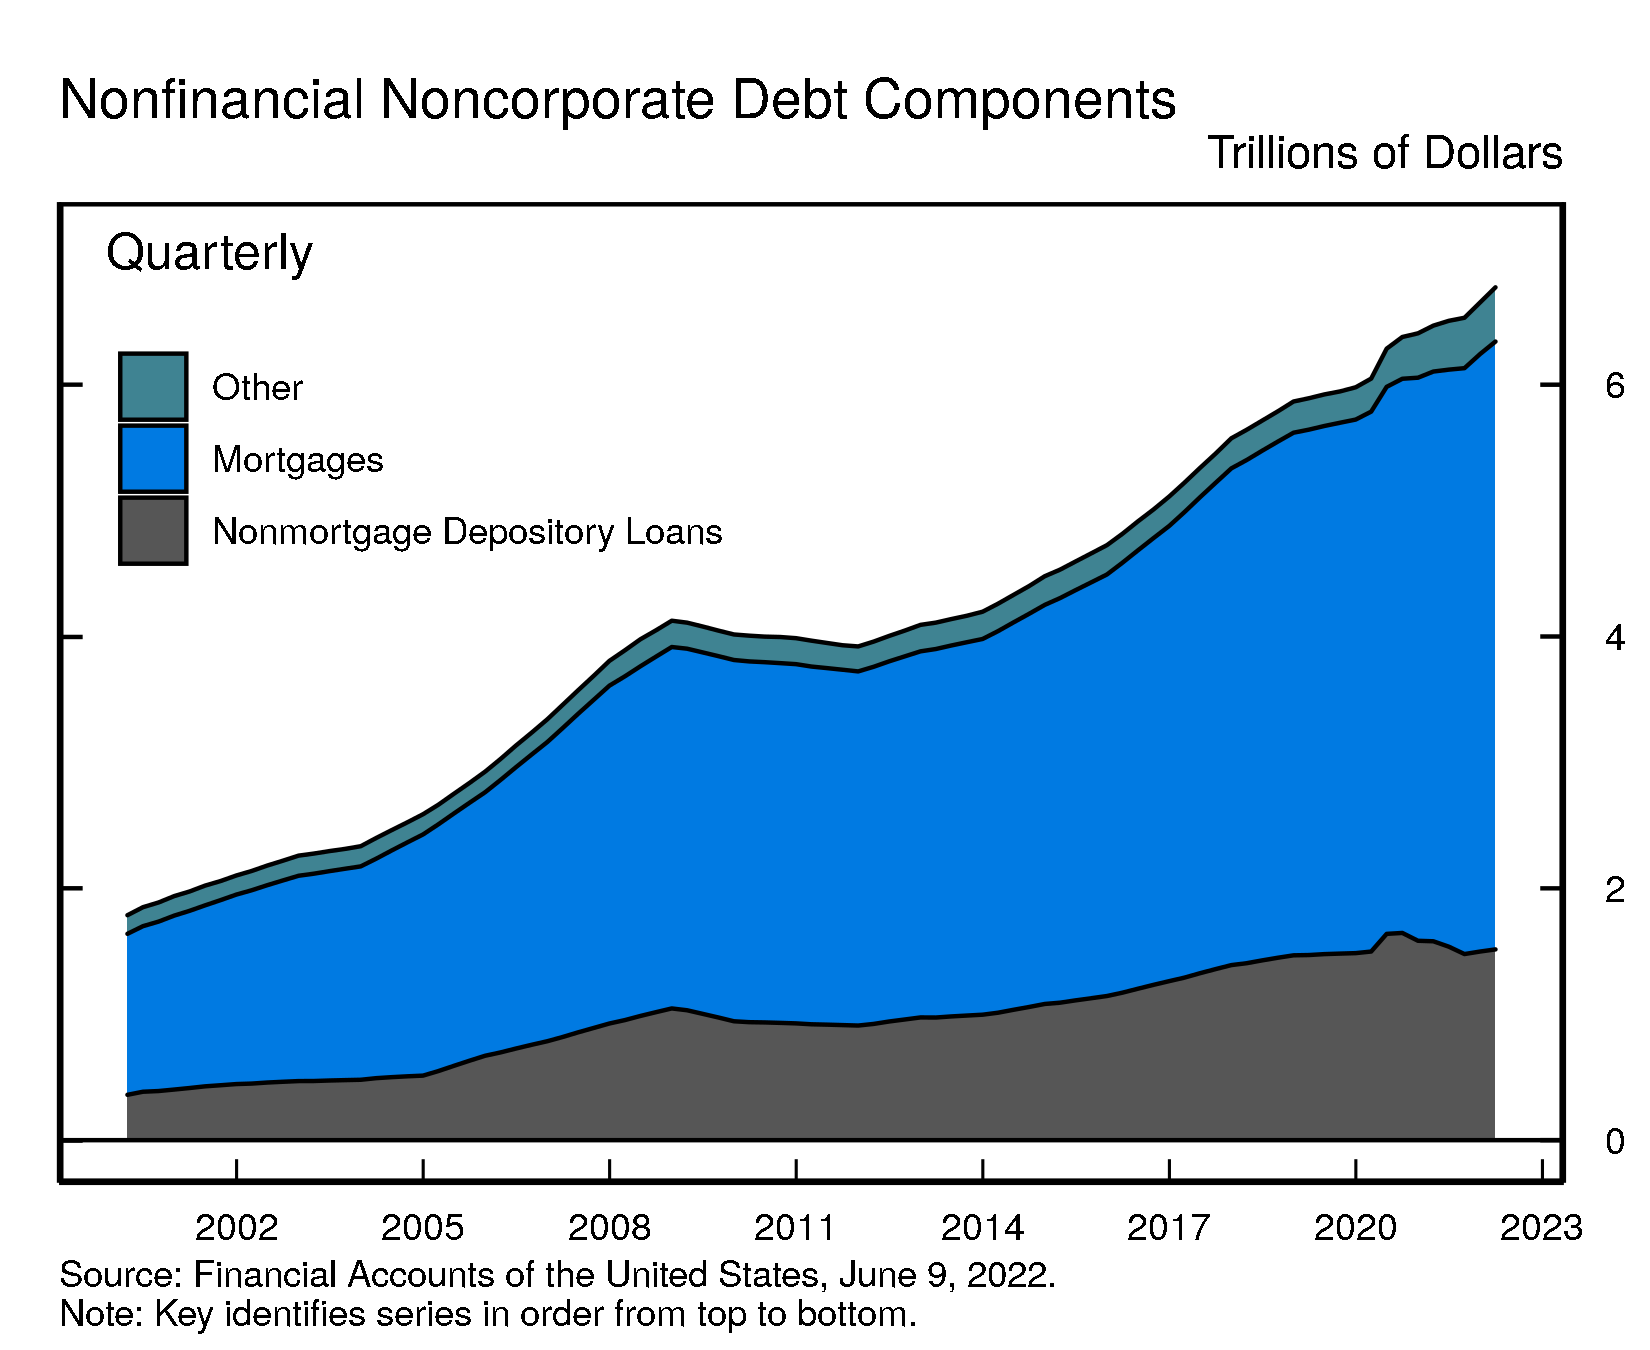
The nonfinancial noncorporate business sector consists mostly of smaller businesses, which are typically not incorporated. Nonfinancial noncorporate business debt was $6.8 trillion, of which $4.8 trillion were mortgage loans and $1.5 trillion were nonmortgage depository loans.
Accessible version | CSV | Data Dictionary |
Accessible version | CSV | Data Dictionary |
For more data on nonfinancial business balance sheets, including debt, see tables B.103 and B.104.
Coming soon
- The Distributional Financial Accounts, which provide a quarterly estimate of the distribution of U.S. household wealth, will be published on Friday, June 17. Other Enhanced Financial Accounts Projects (www.federalreserve.gov/releases/efa/enhanced-financial-accounts.htm) will also be updated on Friday, June 17.
- Financial Accounts data for the second quarter of 2022 will be published on Friday, September 9, 2022, at 12:00 noon.
Chart Notes
- Changes in net worth consist of transactions, revaluations, and other volume changes. Corporate equity and debt securities include directly and indirectly held securities. Real estate is the value of owner-occupied real estate. Other includes equity in noncorporate businesses, consumer durable goods, fixed assets of nonprofit organizations, and all other financial assets apart from corporate equities and debt securities, net of liabilities, as shown on table B.101 Balance Sheet of Households and Nonprofit Organizations.
Depository loans include bank loans (bank credit) and loans from nonbank depository institutions such as credit unions and savings and loans associations.↩