Financial Accounts of the United States - Z.1
Recent Developments RSS Data Download
The recent developments discussed below refer to data through September 30, 2023.
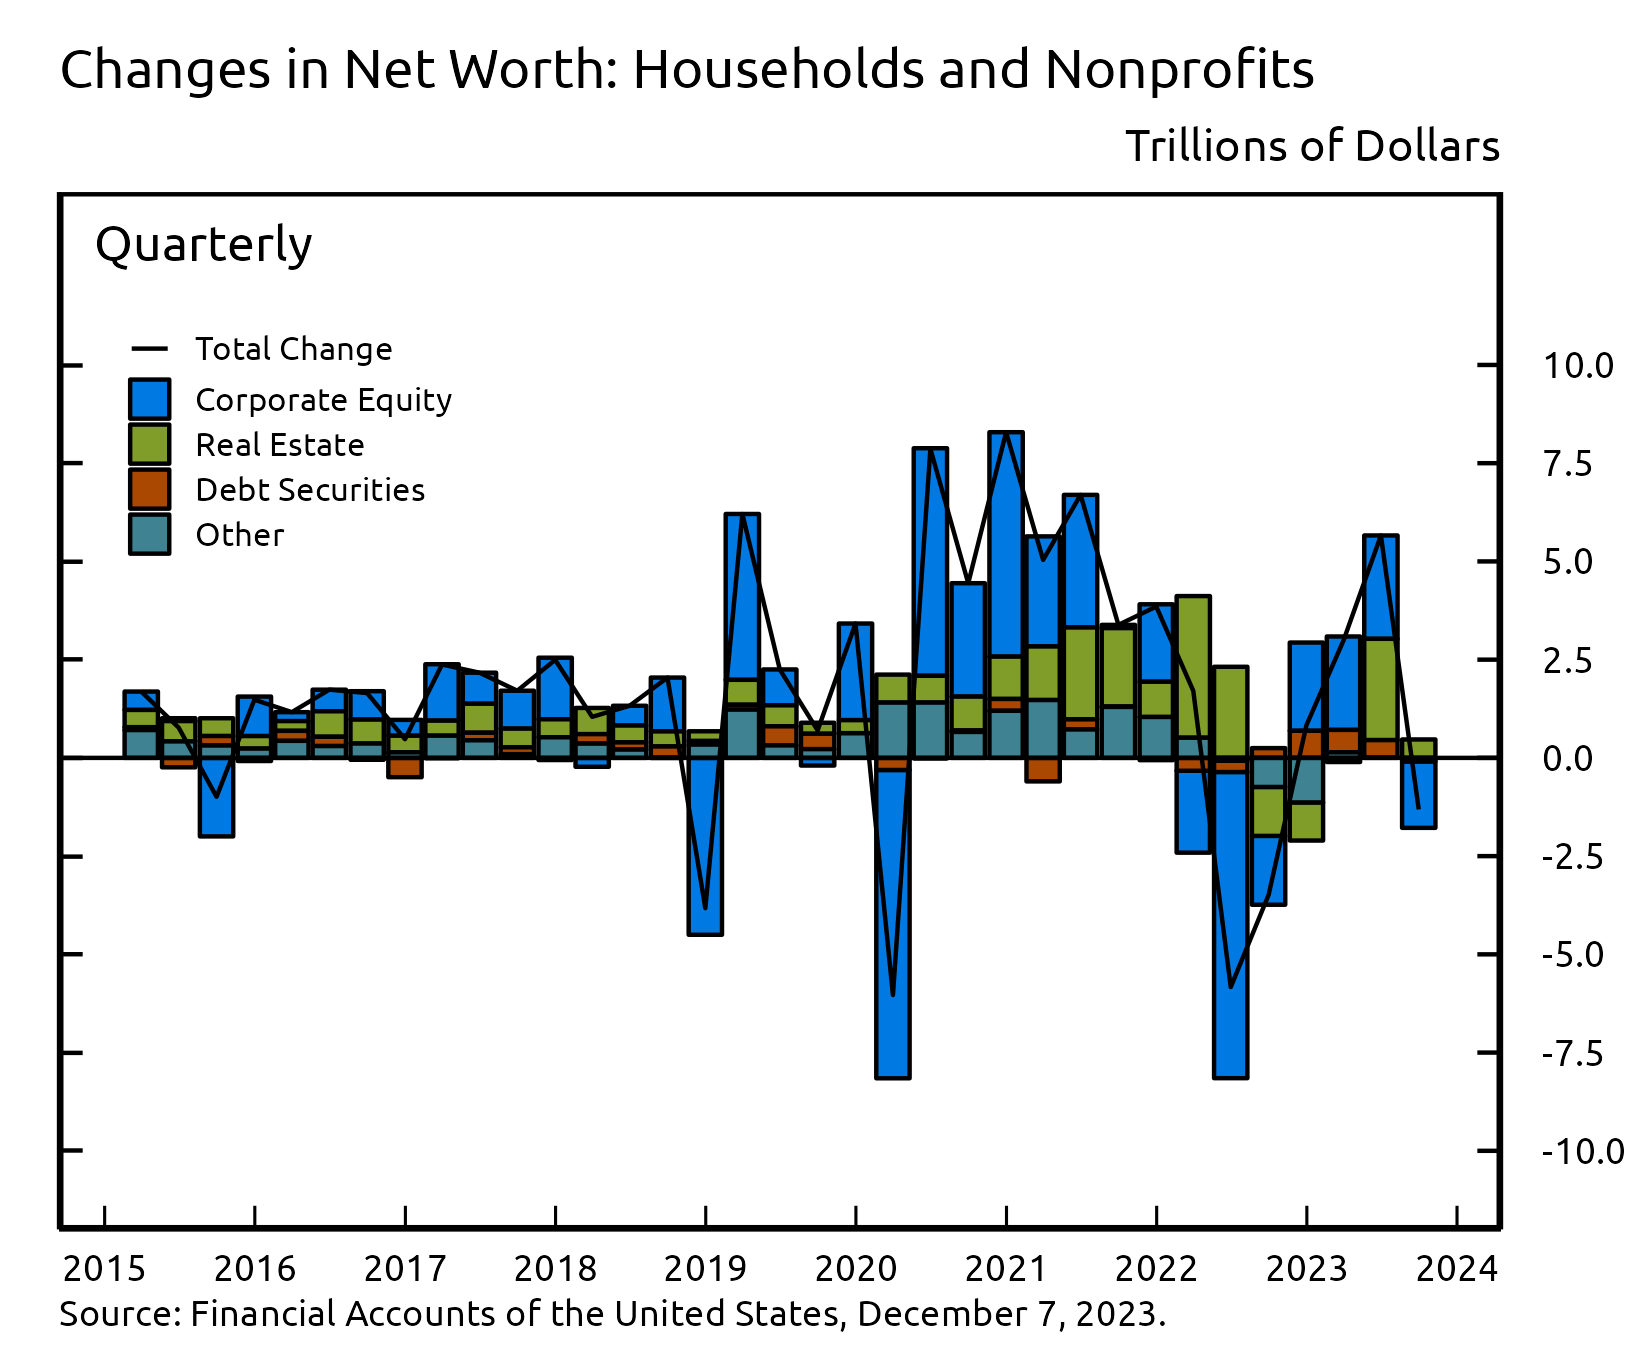
- Household net worth decreased by $1.3 trillion in the third quarter, as losses on corporate equity were only partially offset by an increase in the value of real estate.
- Household debt increased at an annual rate of 2.5% in the third quarter amid somewhat slower growth in both mortgage debt and nonmortgage consumer credit.
- Nonfinancial business debt growth slowed to a 1.5% pace, reflecting modest net issuance of corporate bonds and a contraction in nonmortgage loans from depository institutions.
Household Net Worth
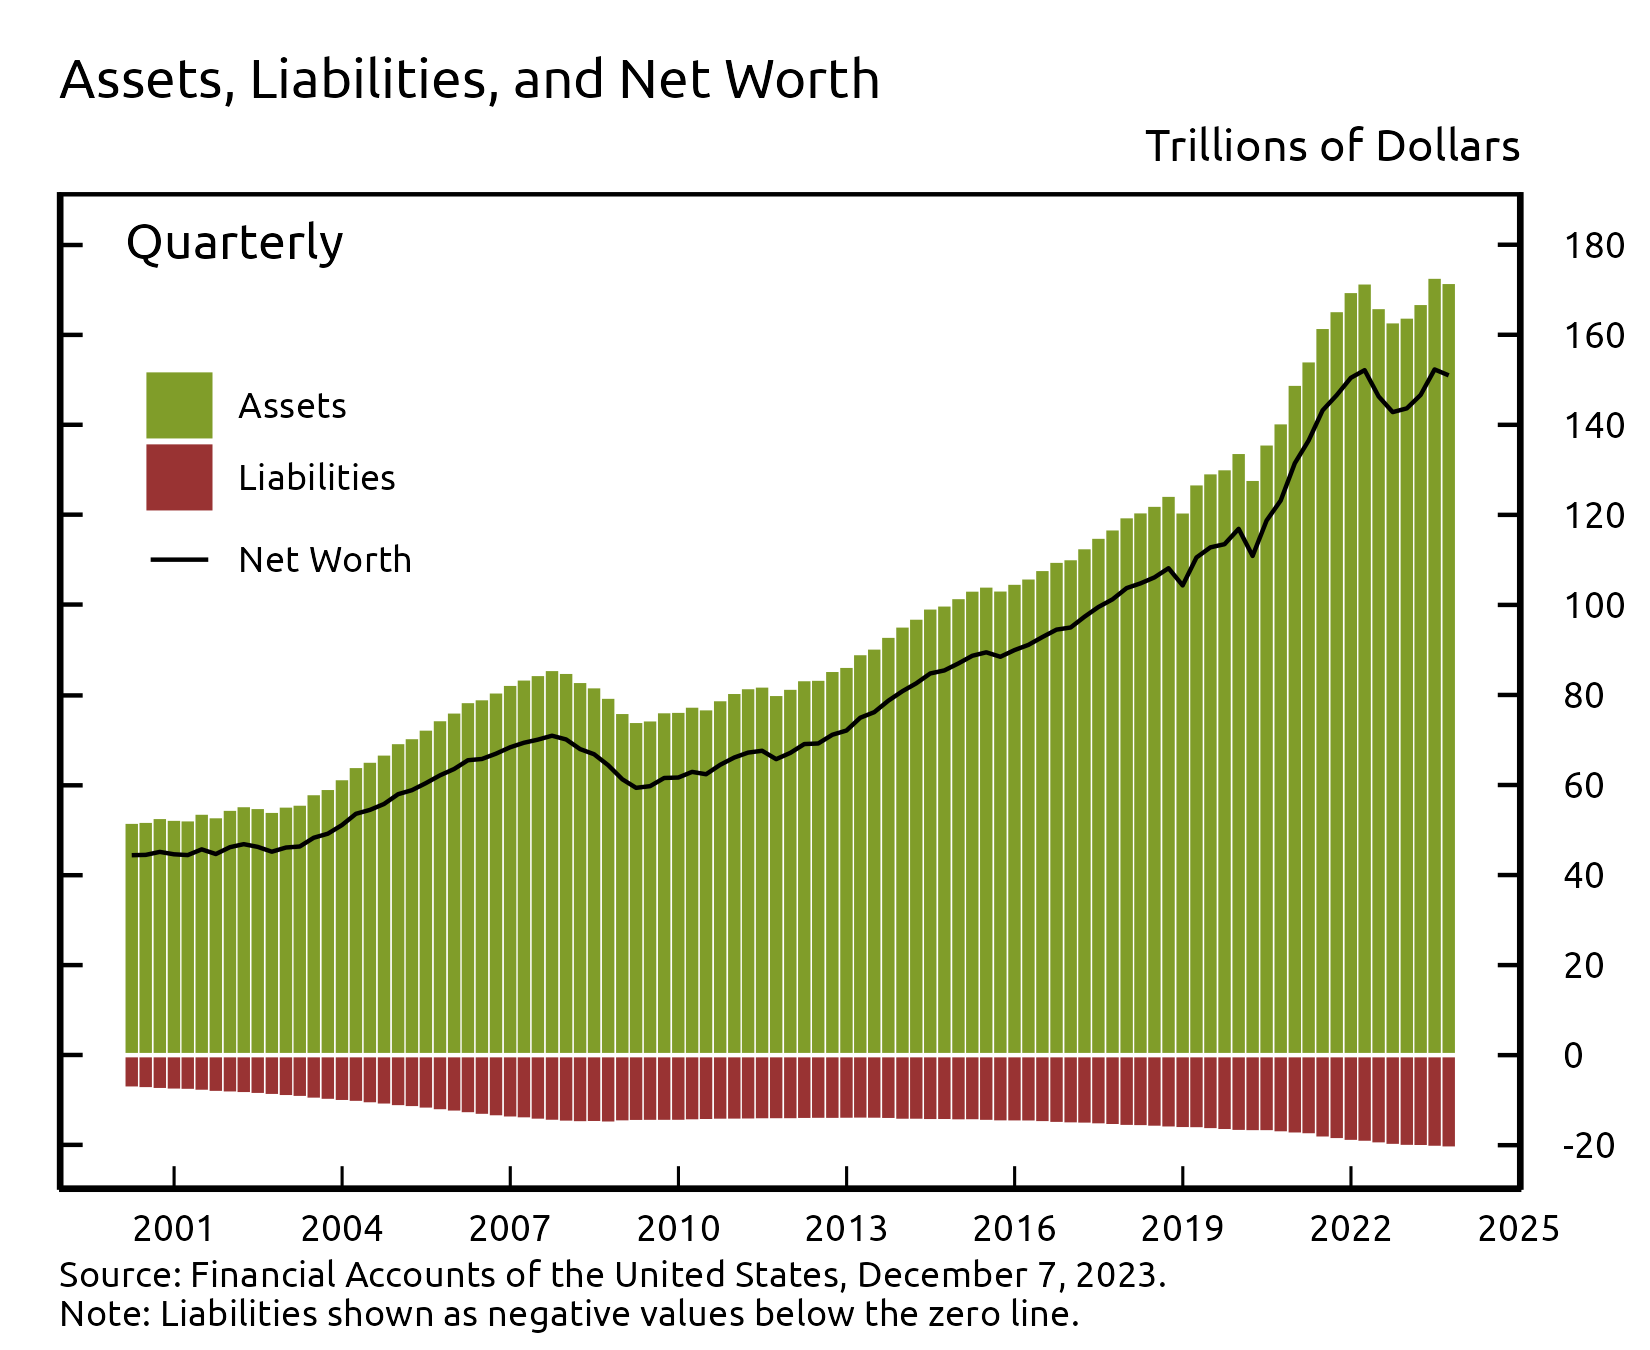
The net worth of households and nonprofit organizations decreased by $1.3 trillion to $151.0 trillion in the third quarter. The change in household net worth was primarily driven by a drop in equity prices, which was partially offset by an increase in the value of real estate. The value of household’s directly and indirectly held corporate equities fell by $1.7 trillion in the third quarter, while the value of household real estate increased by $0.5 trillion.
View interactive | Accessible version | CSV | Data Dictionary | Chart Note (1) |
Directly and indirectly held corporate equities ($43.1 trillion) and household real estate ($45.5 trillion) remain the largest components of household net worth. Household debt (seasonally adjusted) was $19.8 trillion.
View interactive | Accessible version | CSV | Data Dictionary |
Household Balance Sheet Summary
| Description | 2021 | 2022 | 2022:Q4 | 2023:Q1 | 2023:Q2 | 2023:Q3 |
|---|---|---|---|---|---|---|
| Net Worth | 150.44 | 143.66 | 143.66 | 146.64 | 152.30 | 150.99 |
| Change in Net Worth | 18.97 | -6.78 | 0.83 | 2.98 | 5.66 | -1.31 |
| Equities | 49.13 | 39.74 | 39.74 | 42.12 | 44.75 | 43.06 |
| Change in Equities | 8.23 | -9.38 | 2.25 | 2.38 | 2.63 | -1.69 |
| Real Estate | 38.90 | 42.59 | 42.59 | 42.54 | 45.03 | 45.54 |
| Change in Real Estate | 5.92 | 3.69 | -0.93 | -0.05 | 2.49 | 0.51 |
For more data on household net worth, see table B.101
Nonfinancial debt
Household debt grew by 2.5% in the third quarter of 2023, about equal to its average pace for the first half of the year but down noticeably from the pace recorded over the previous two years (this and subsequent rates of growth are reported at a seasonally adjusted annual rate). Home mortgage debt expanded by 2.5% while nonmortgage consumer credit grew by 1.1%. The slowdown in consumer credit growth reflects increased student loan forgiveness in the third quarter.
Nonfinancial business debt growth has also slowed over the past few quarters and remains significantly below the pace posted over the past few years. Nonfinancial business debt expanded at a 1.5% pace in the third quarter, reflecting modest net issuance of corporate bonds and a contraction in nonmortgage borrowing from depository institutions.
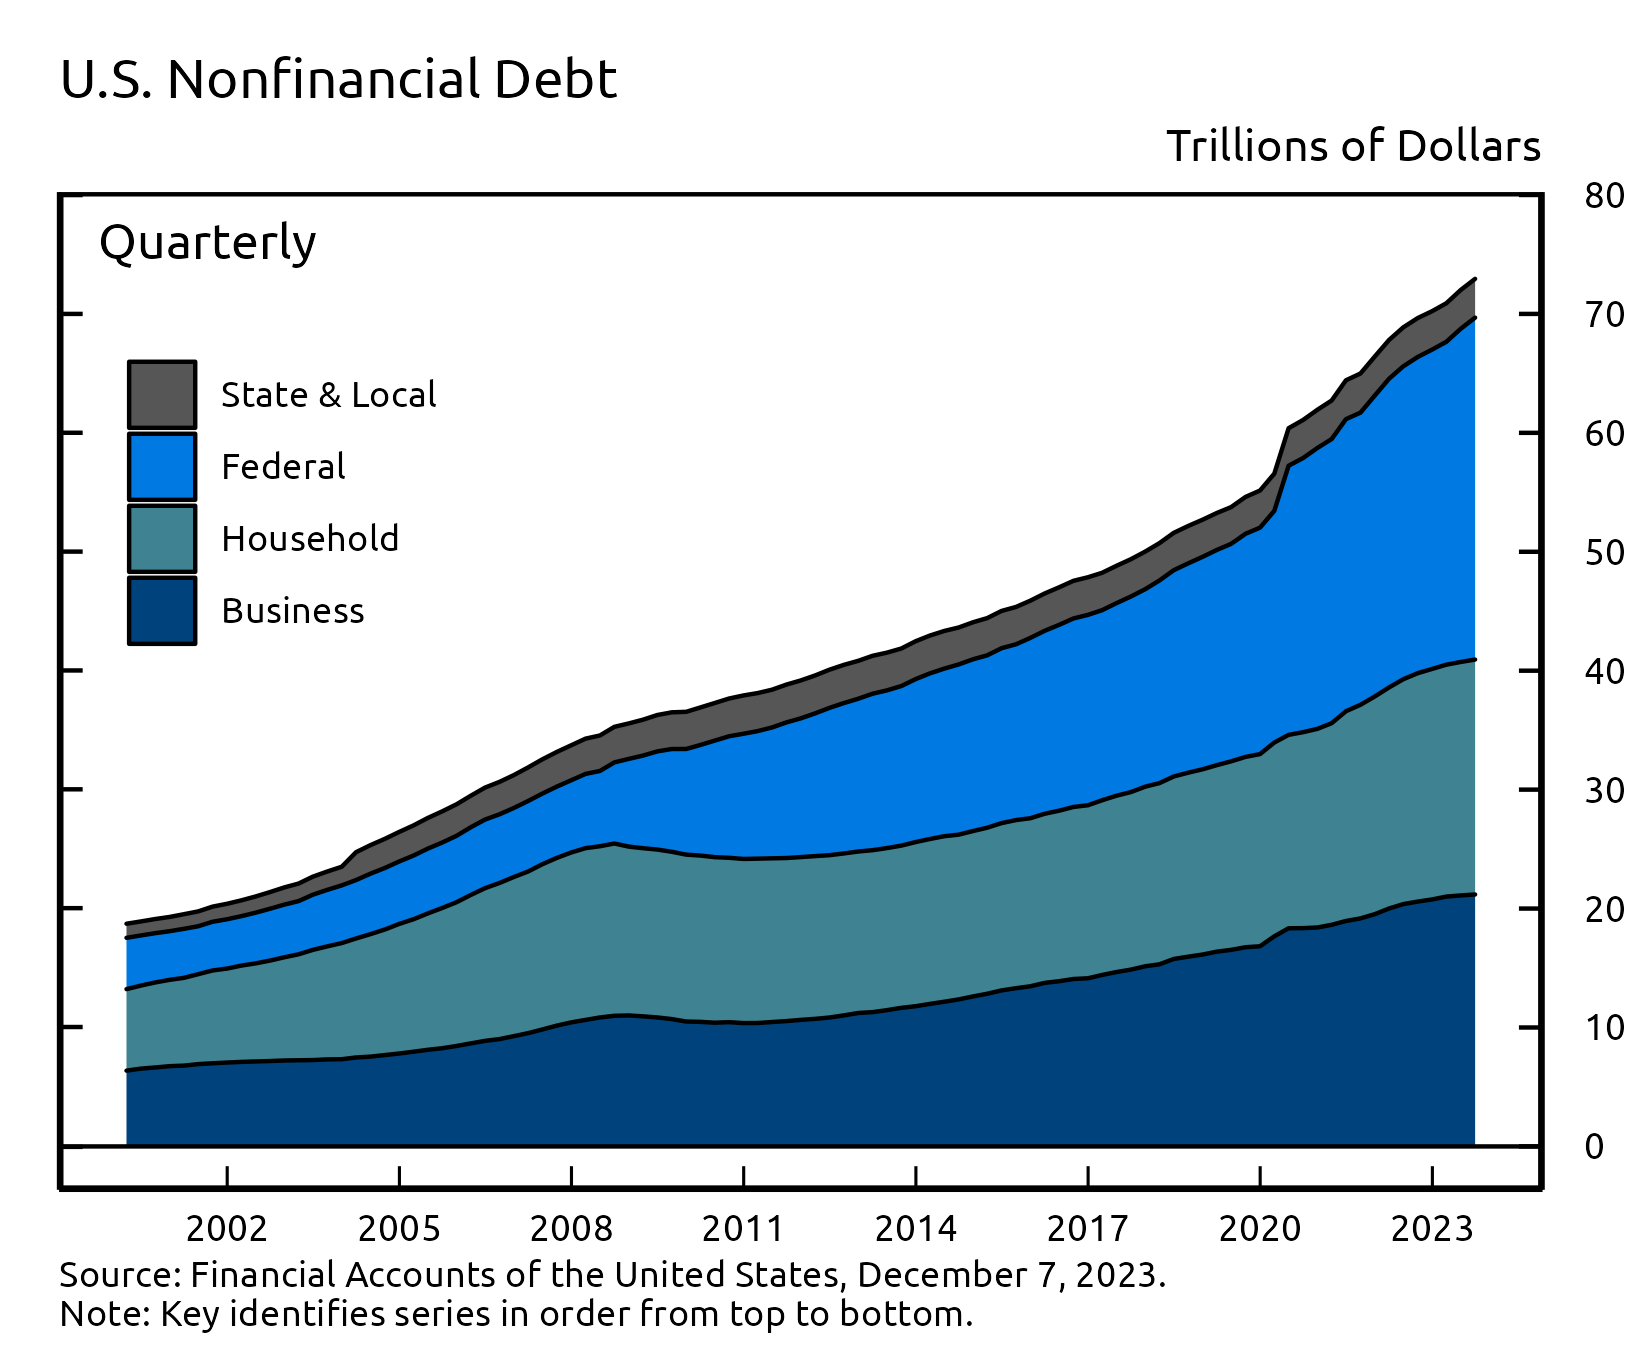
Overall, domestic nonfinancial debt grew at an annual rate of 5.2% in the third quarter, boosted by robust expansion of federal government debt amid the relatively tepid debt growth of households and nonfinancial businesses. Federal government debt increased at a 10.6% pace, while state and local government debt contracted by 0.3%.
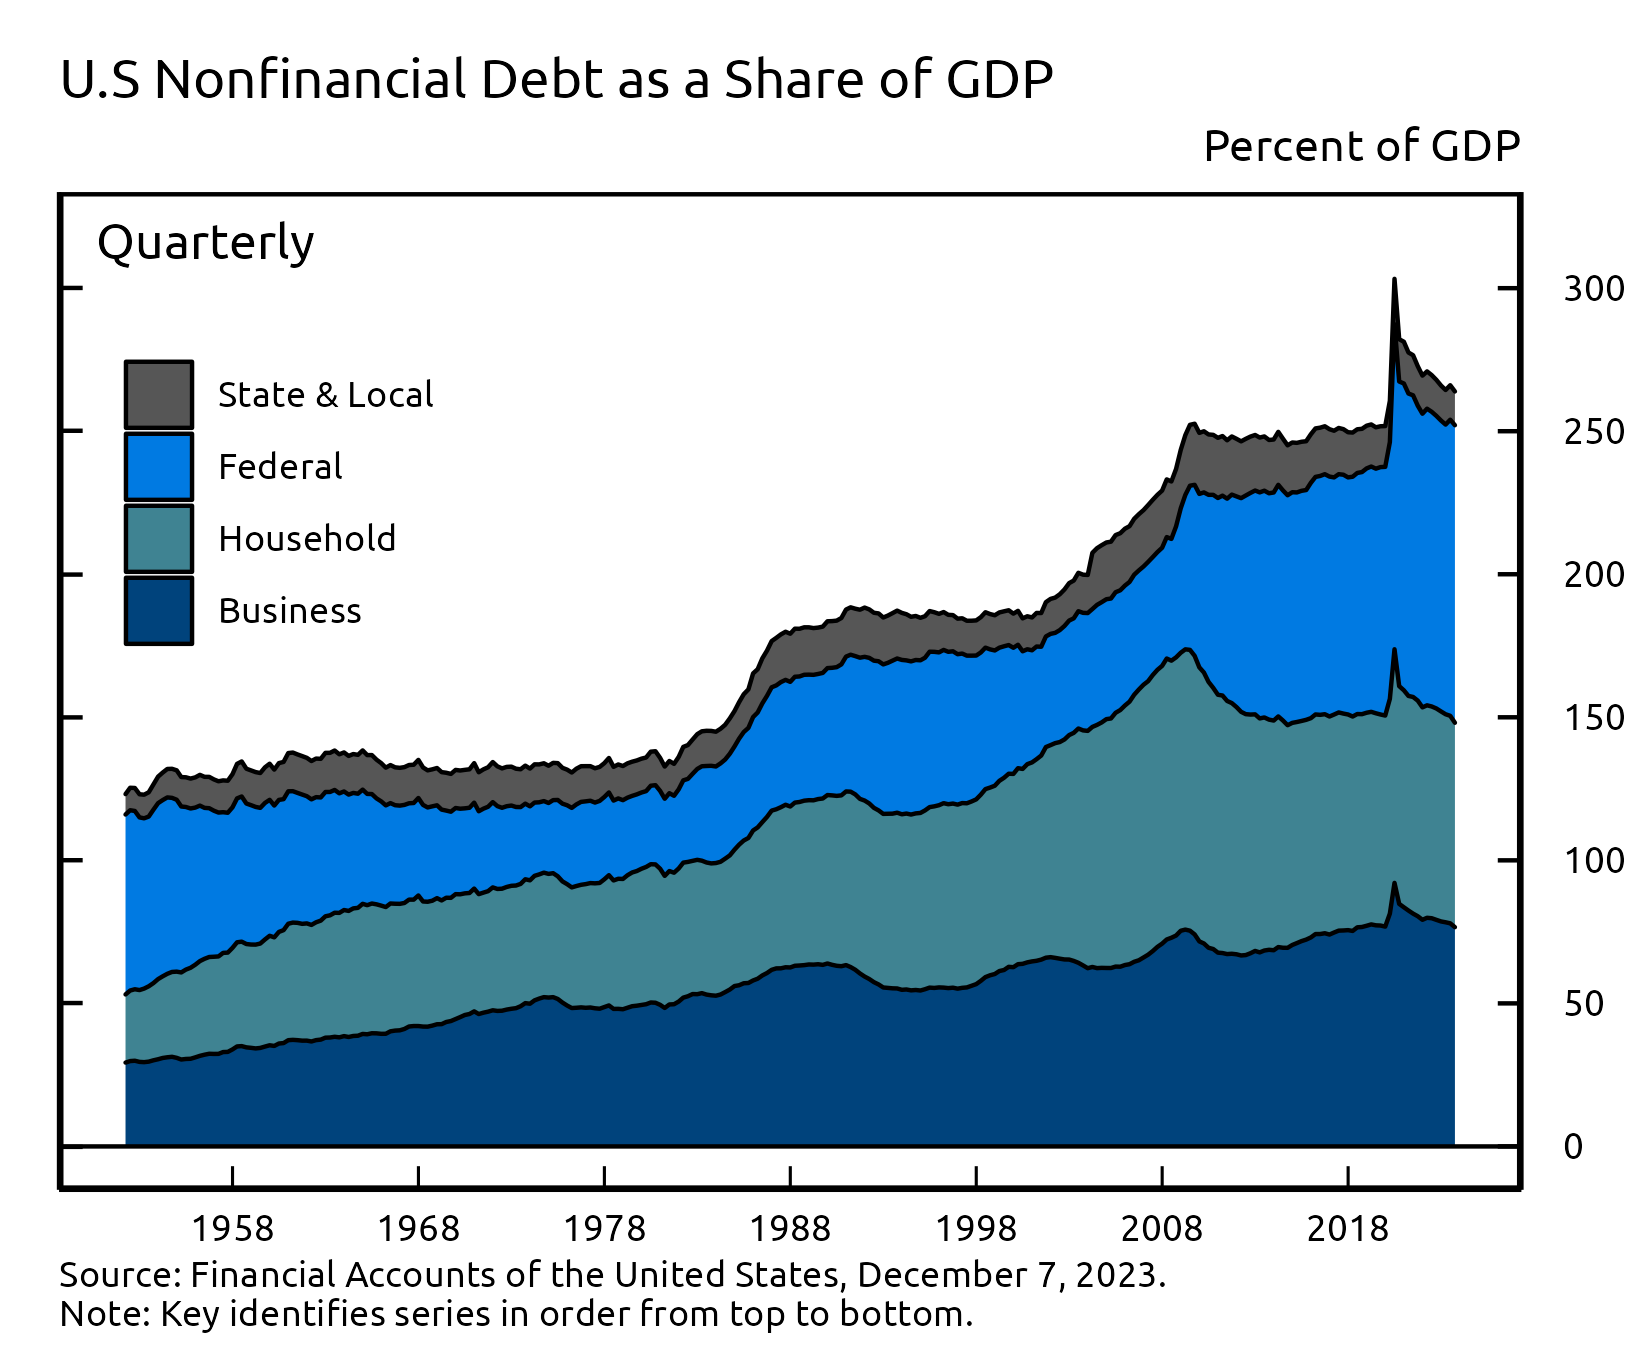
The ratio of nonfinancial debt outstanding to GDP moved down in the third quarter. The ratio has declined substantially since it spiked amid pandemic-related factors in the second quarter of 2020 but remains slightly above the level that prevailed in the years just before the pandemic.
For more data on nonfinancial debt, see table D.1 (rates of growth) and table D.3 (outstanding).
Debt Growth by Sector
| Description | 2021 | 2022 | 2022:Q4 | 2023:Q1 | 2023:Q2 | 2023:Q3 |
|---|---|---|---|---|---|---|
| Total Nonfinancial | 6.30 | 5.69 | 3.23 | 3.78 | 6.27 | 5.24 |
| Households and Nonprofits | 7.41 | 6.25 | 3.28 | 2.40 | 2.71 | 2.52 |
| Nonfinancial Business | 4.95 | 5.83 | 3.52 | 4.59 | 1.84 | 1.53 |
| Federal Government | 7.13 | 6.11 | 3.98 | 4.45 | 12.67 | 10.60 |
| State and Local Governments | 2.16 | -1.57 | -5.07 | 1.21 | 2.77 | -0.35 |
Debt Outstanding by Sector
| Description | 2021 | 2022 | 2022:Q4 | 2023:Q1 | 2023:Q2 | 2023:Q3 |
|---|---|---|---|---|---|---|
| Total Nonfinancial | 66.43 | 70.24 | 70.24 | 70.90 | 72.01 | 72.95 |
| Households and Nonprofits | 18.31 | 19.38 | 19.38 | 19.50 | 19.63 | 19.75 |
| Nonfinancial Business | 19.53 | 20.77 | 20.77 | 21.01 | 21.10 | 21.18 |
| Federal Government | 25.30 | 26.85 | 26.85 | 27.15 | 28.01 | 28.75 |
| State and Local Governments | 3.28 | 3.23 | 3.23 | 3.24 | 3.26 | 3.26 |
Accessible version | CSV | Data Dictionary |
Accessible version | CSV | Data Dictionary |
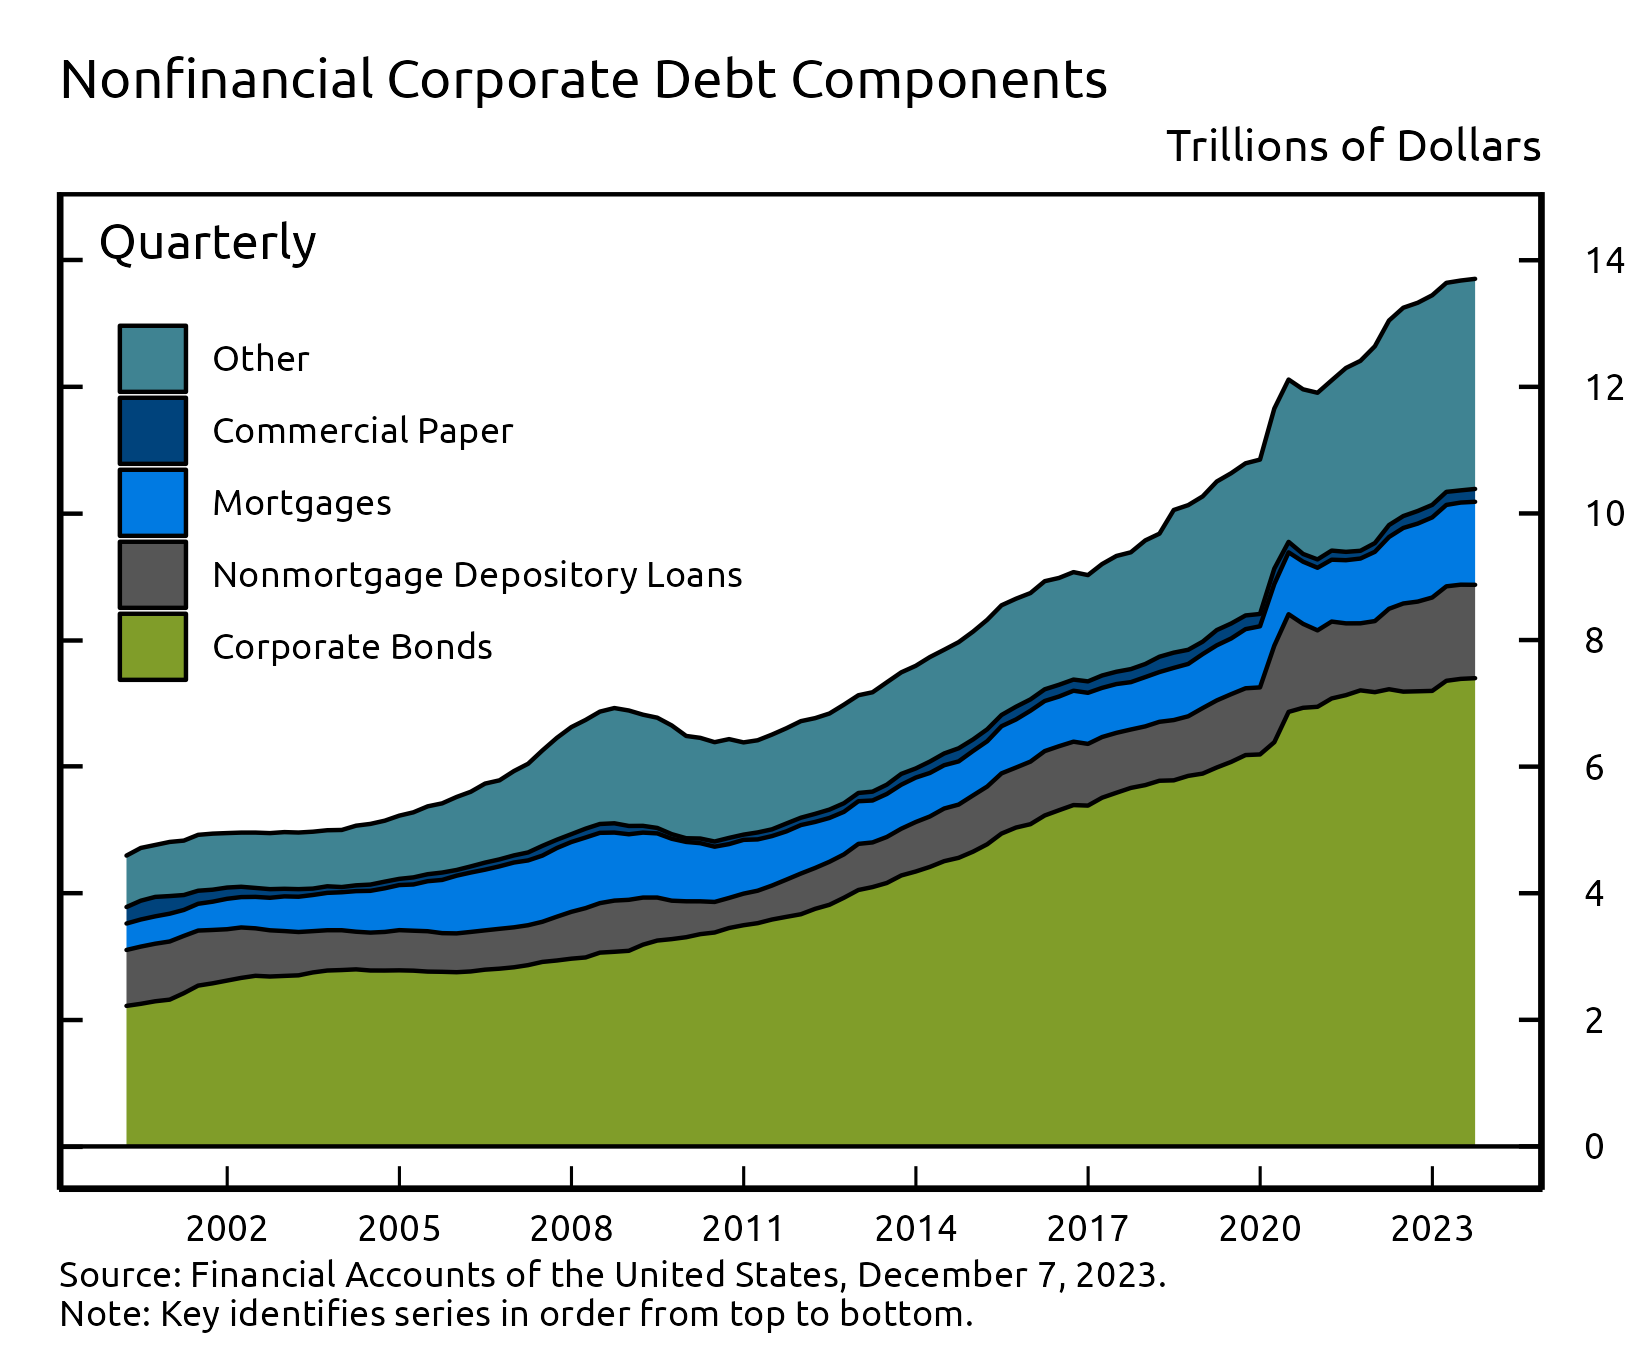
Looking at the various components of nonfinancial business debt, corporate bonds increased by about $11 billion in the third quarter while mortgage loans increased by $58 billion. Nonmortgage loans at depository institutions declined by about $32 billion, while other nonmortgage loans at nonbank financial institutions increased by $13 billion in the third quarter.
Overall, outstanding nonfinancial corporate debt was $13.7 trillion. Corporate bonds, at roughly $7.4 trillion, accounted for 54% of the total. Nonmortgage depository loans were about $1.5 trillion. Other types of debt include loans from nonbank financial institutions, loans from the federal government, industrial revenue bonds, and commercial paper. As of this publication, the nonfinancial corporate business sector includes equity real estate investment trusts.
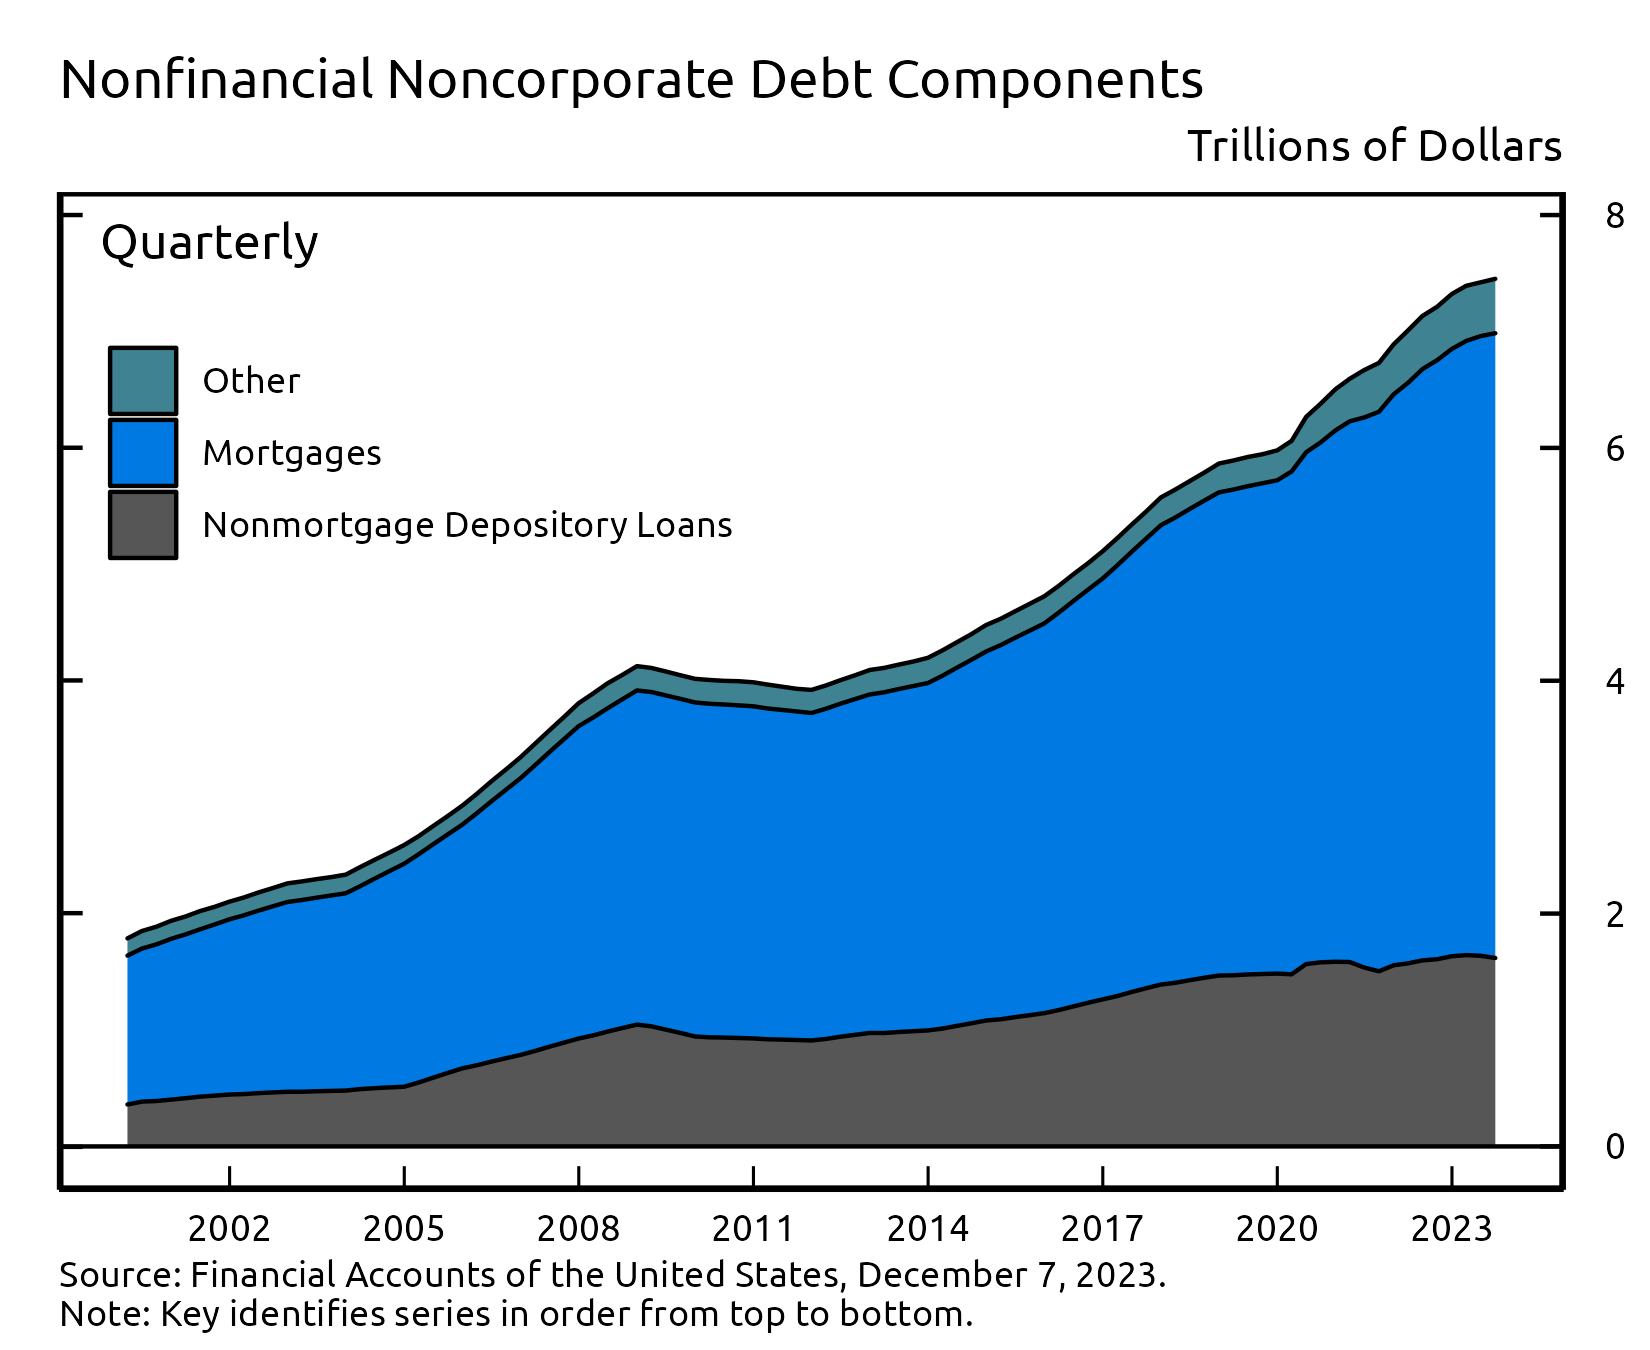
The nonfinancial noncorporate business sector consists mostly of smaller businesses, which are typically not incorporated. Nonfinancial noncorporate business debt was $7.5 trillion in the third quarter. Mortgage loans, at roughly $5.4 trillion, accounted for about 72% of the total, while nonmortgage depository loans ($1.6 trillion) accounted for most of the remainder.
Accessible version | CSV | Data Dictionary |
Accessible version | CSV | Data Dictionary |
For more data on nonfinancial business balance sheets, including debt, see tables B.103 and B.104.
Coming soon
- Enhanced Financial Accounts Projects
(www.federalreserve.gov/releases/efa/enhanced-financial-accounts.htm)
will be updated on Friday, December 15, 2023, including the
Distributional Financial Accounts, which provide a quarterly
estimate of the distribution of U.S. household wealth and
will incorporate new data from the 2022 Survey of Consumer
Finances.
- Financial Accounts data for the fourth quarter of 2023 will be published on Thursday, March 7, 2024, at 12:00 noon.
Chart Notes
- Changes in net worth consist of transactions, revaluations, and other volume changes. Corporate equity and debt securities include directly and indirectly held securities. Real estate is the value of owner-occupied real estate. Other includes equity in noncorporate businesses, consumer durable goods, fixed assets of nonprofit organizations, and all other financial assets apart from corporate equities and debt securities, net of liabilities, as shown on table B.101 Balance Sheet of Households and Nonprofit Organizations.