Financial Accounts of the United States - Z.1
Recent Developments RSS Data Download
The recent developments discussed below refer to data through June 30, 2025.
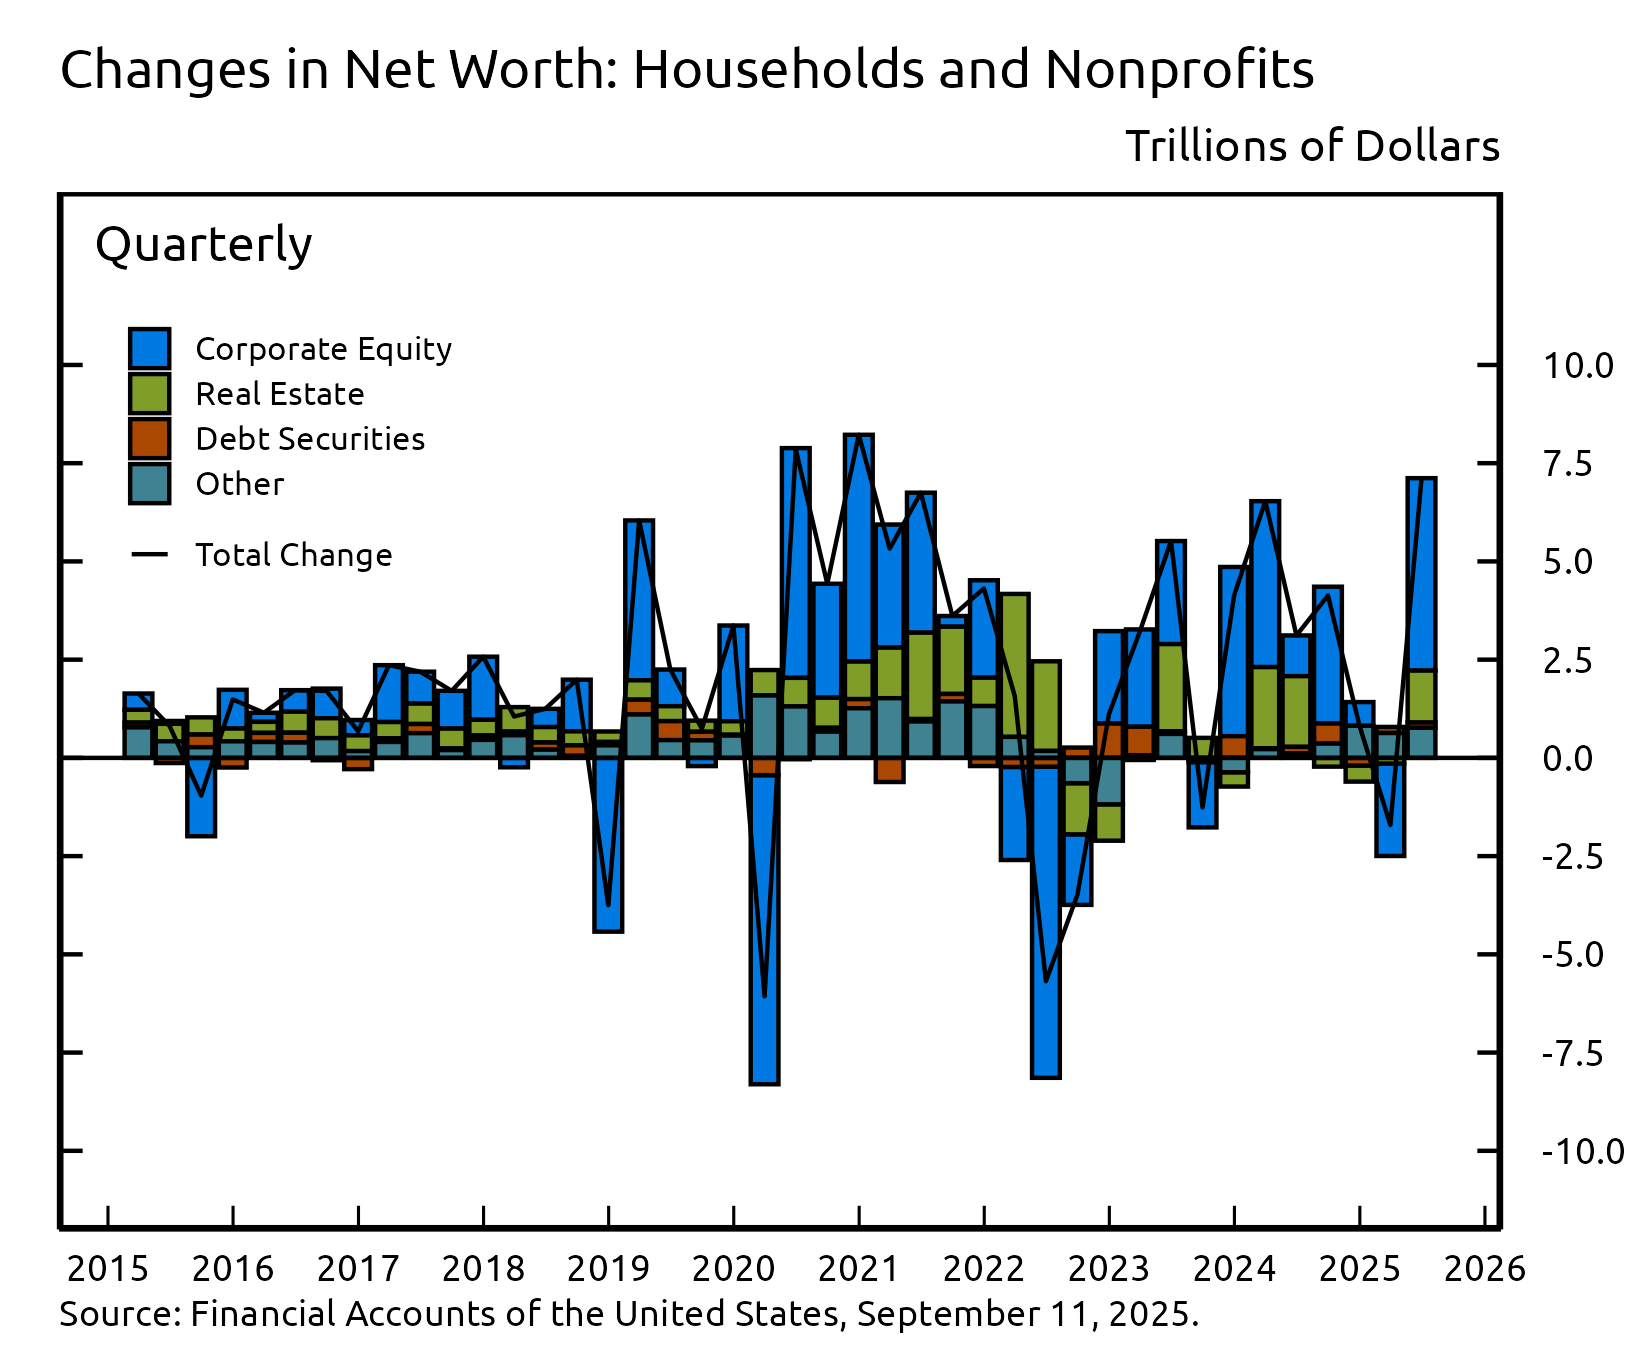
- Household net worth increased by $7.1 trillion in the second quarter of 2025, boosted by gains on corporate equity and real estate assets.
- Household debt increased at a seasonally adjusted annual rate of 3.8% in the second quarter, reflecting moderate growth in mortgage debt and nonmortgage consumer credit.
- Nonfinancial business debt grew at a seasonally adjusted annual rate of 3.6% in the second quarter, largely driven by solid growth in loans.
Household Net Worth
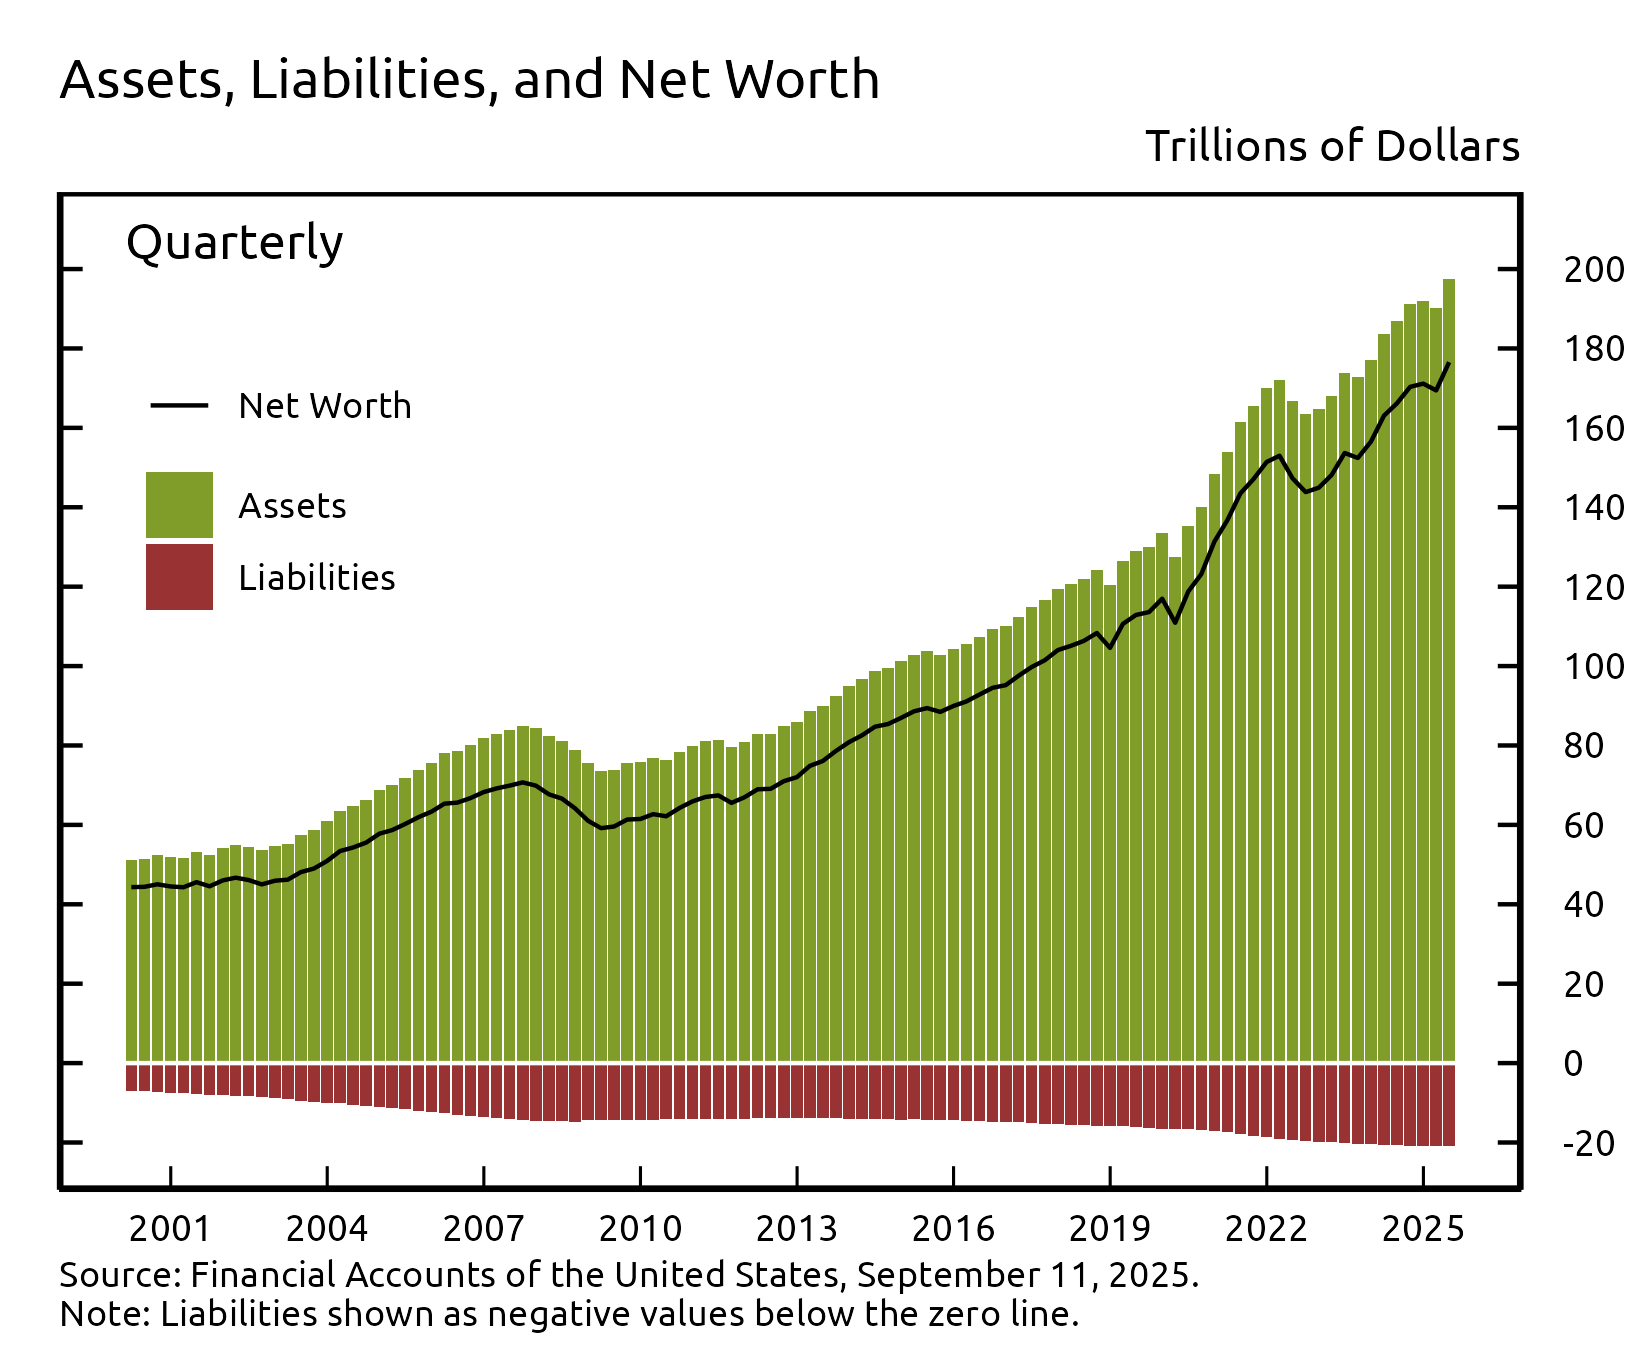
The net worth of households and nonprofit organizations increased by $7.1 trillion to $176.3 trillion in the second quarter. The value of directly and indirectly held equity on the household balance sheet increased by $5.5 trillion in the second quarter, while the value of directly and indirectly held debt securities rose by $0.1 trillion. The value of owner-occupied real estate increased by $1.3 trillion, as house prices moved up in the second quarter, more than retracing declines seen over the previous three quarters.
View interactive | Accessible version | CSV | Data Dictionary | Chart Note (1) |
Directly and indirectly held corporate equities ($61.1 trillion) and household real estate ($49.3 trillion) remain the largest components of household net worth.
View interactive | Accessible version | CSV | Data Dictionary |
Household Balance Sheet Summary
| Description | 2023 | 2024 | 2024:Q3 | 2024:Q4 | 2025:Q1 | 2025:Q2 |
|---|---|---|---|---|---|---|
| Net Worth | 156.54 | 170.93 | 170.28 | 170.93 | 169.21 | 176.29 |
| Change in Net Worth | 11.60 | 14.40 | 4.12 | 0.65 | -1.73 | 7.09 |
| Equities | 48.58 | 57.97 | 57.36 | 57.97 | 55.60 | 61.12 |
| Change in Equities | 7.82 | 9.39 | 3.50 | 0.60 | -2.36 | 5.51 |
| Real Estate | 44.90 | 48.14 | 48.55 | 48.14 | 47.99 | 49.32 |
| Change in Real Estate | 2.31 | 3.23 | -0.22 | -0.41 | -0.14 | 1.32 |
For more data on household net worth, see table B.101
Nonfinancial debt
Total domestic nonfinancial debt grew at an annual rate of 3.0% in the second quarter, down a touch from the previous quarter and below the pace recorded over the past few years (this and subsequent rates of growth are reported at a seasonally adjusted annual rate). The slowdown in total debt growth during the first half of 2025 was primarily driven by slower growth of federal government debt, while private nonfinancial debt continued to expand at a moderate pace.
Household debt grew by 3.8% in the second quarter, up from the 1.8% pace of growth posted in the previous quarter. Home mortgage debt expanded by 3.3% and nonmortgage consumer credit grew by 2.8%.
Nonfinancial business debt expanded at a 3.6% pace in the second quarter, down from a 5.2% annual rate in the previous quarter. This deceleration was driven by net retirements of corporate bonds, which weighed on nonfinancial corporate debt growth despite robust net issuance of commercial paper and strong growth in loans from depository and nondepository financial institutions. The debt growth of nonfinancial noncorporate businesses remained steady in the second quarter.
Federal government debt growth slowed to a 1.5% pace in the second quarter, as the U.S. Department of the Treasury continued to employ extraordinary measures to remain below the statutory debt limit. State and local government debt increased notably in the first half of this year, expanding at an annual rate of 8.2% in the second quarter–its fastest pace of growth since 2007:Q1.
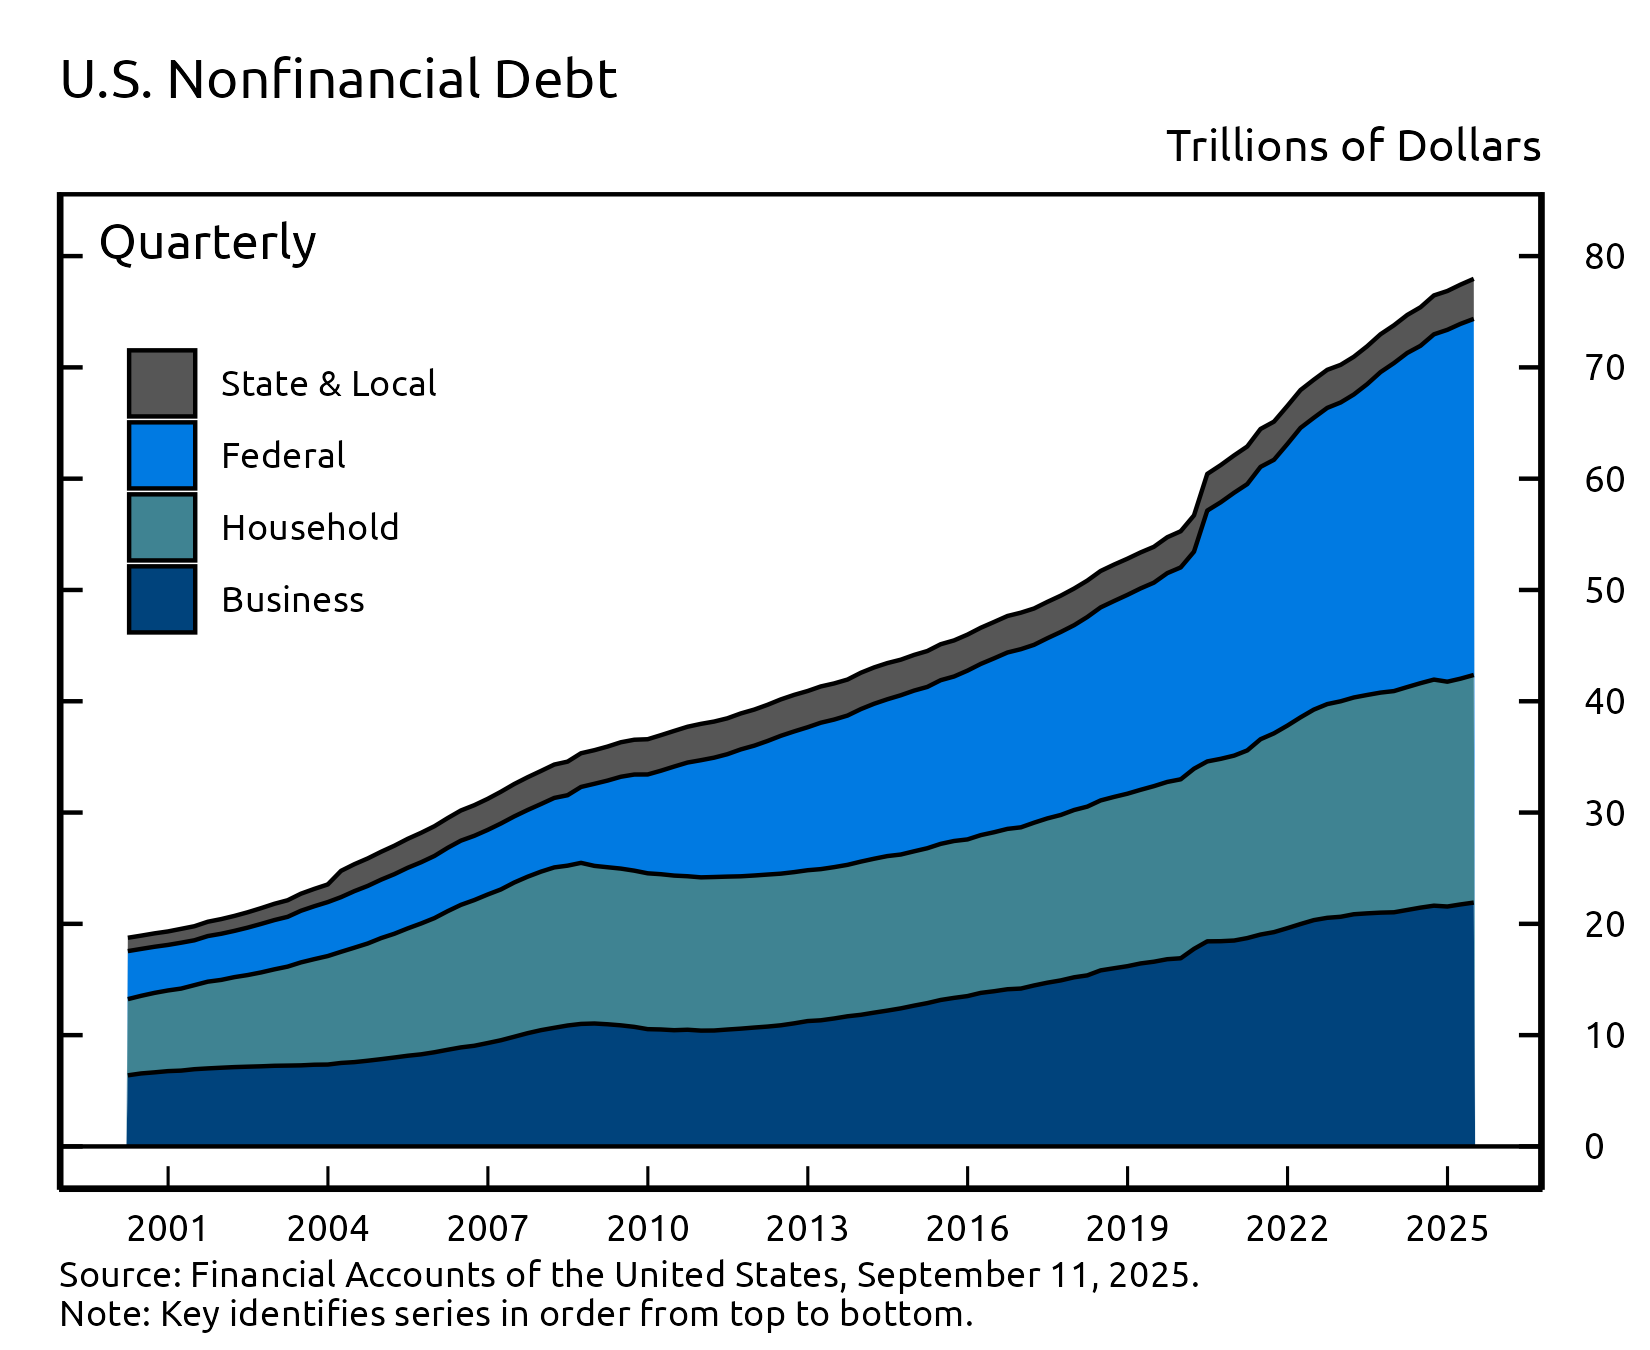
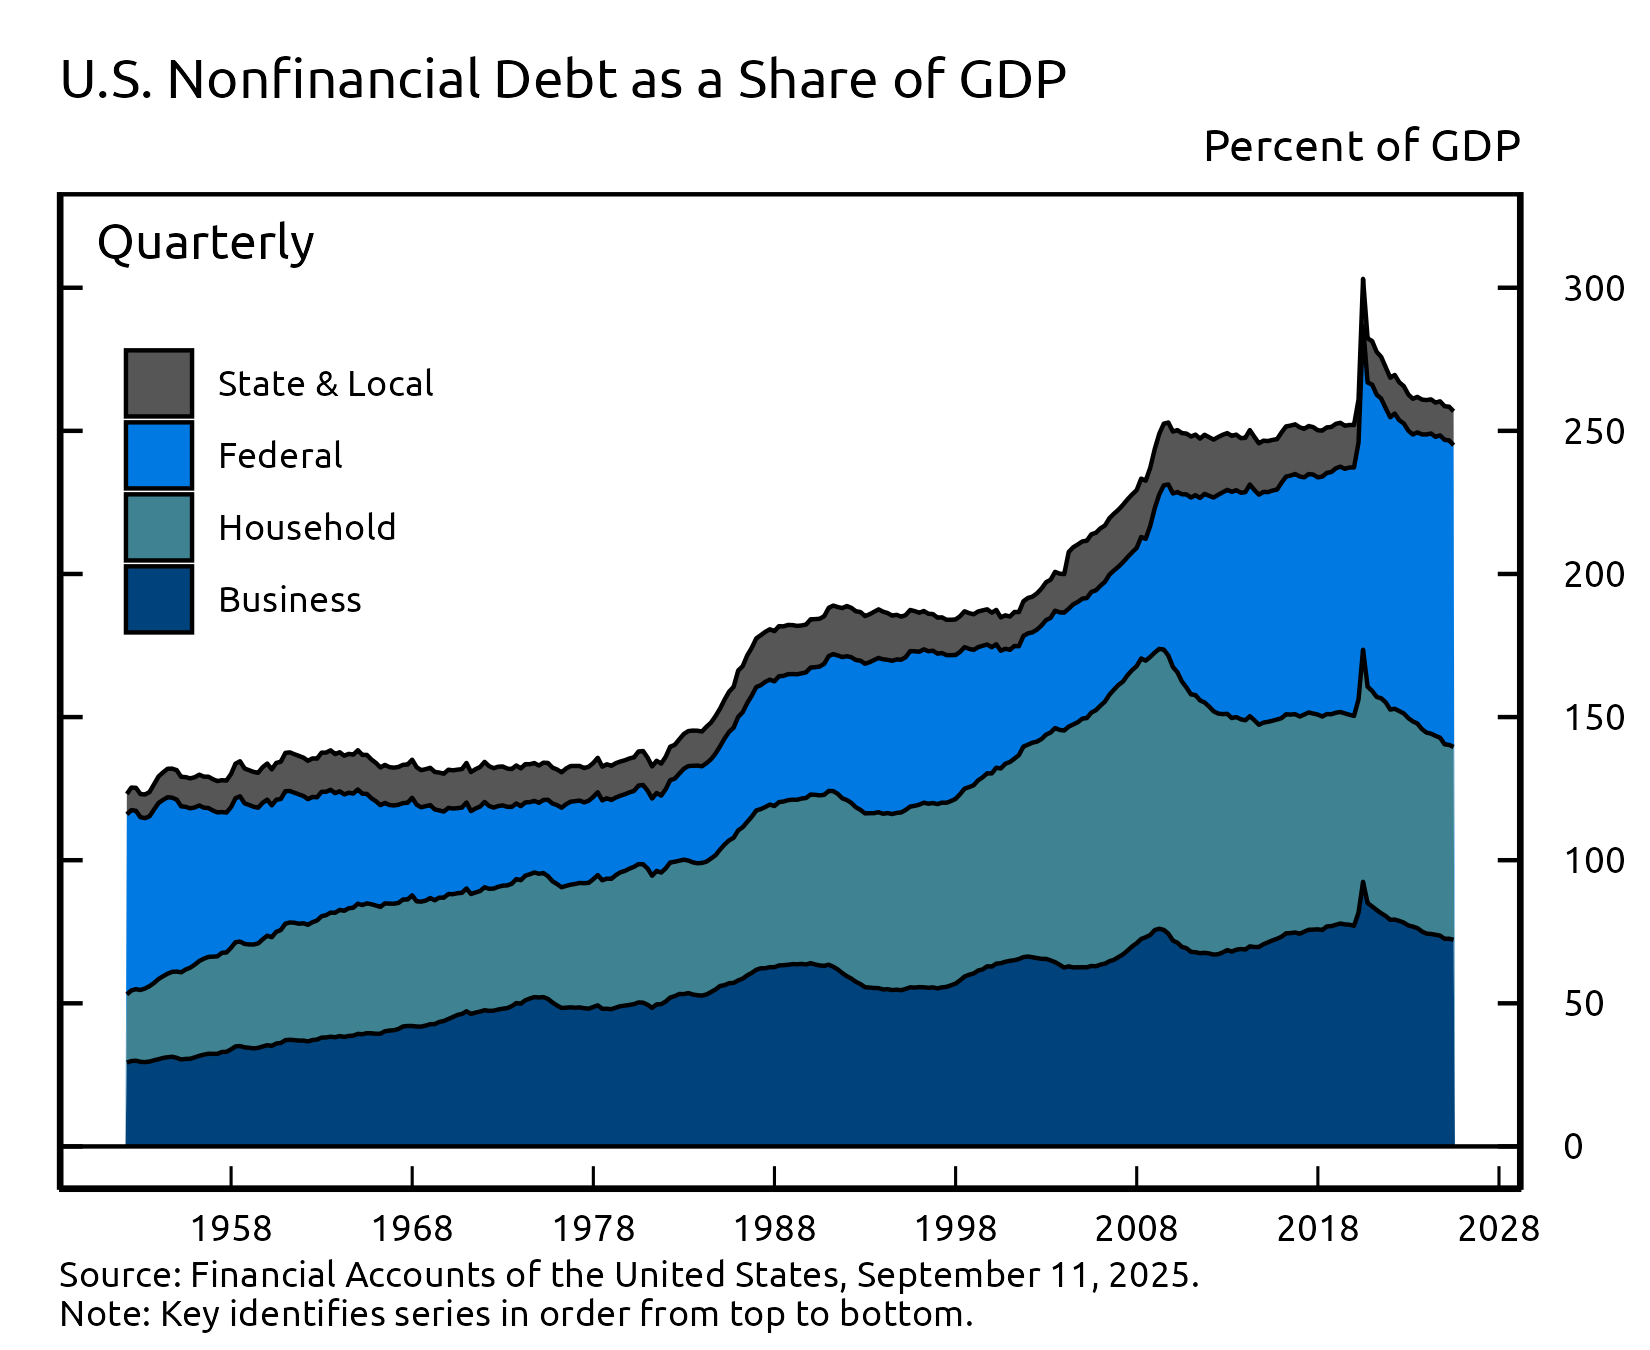
Total domestic nonfinancial debt outstanding (seasonally adjusted) was $78.0 trillion in the second quarter, of which household debt was $20.5 trillion, nonfinancial business debt was $21.9 trillion, and total government debt was $35.6 trillion. The ratio of nonfinancial debt outstanding to GDP edged down to 257% in the second quarter, about the same as in recent quarters. For more data on nonfinancial debt, see table D.1 (rates of debt growth), table D.2 (borrowing), and table D.3 (debt outstanding).
Debt Growth by Sector
| Description | 2023 | 2024 | 2024:Q3 | 2024:Q4 | 2025:Q1 | 2025:Q2 |
|---|---|---|---|---|---|---|
| Total Nonfinancial | 5.07 | 4.72 | 5.65 | 4.17 | 3.49 | 2.99 |
| Households and Nonprofits | 2.68 | 3.05 | 2.91 | 3.29 | 1.81 | 3.80 |
| Nonfinancial Business | 1.97 | 3.05 | 3.27 | 0.85 | 5.15 | 3.60 |
| Federal Government | 9.76 | 7.28 | 9.36 | 7.65 | 3.34 | 1.48 |
| State and Local Governments | 0.47 | 2.73 | 3.81 | -1.06 | 4.20 | 8.18 |
Debt Outstanding by Sector
| Description | 2023 | 2024 | 2024:Q3 | 2024:Q4 | 2025:Q1 | 2025:Q2 |
|---|---|---|---|---|---|---|
| Total Nonfinancial | 73.78 | 76.86 | 76.47 | 76.86 | 77.43 | 77.96 |
| Households and Nonprofits | 19.88 | 20.20 | 20.31 | 20.20 | 20.29 | 20.45 |
| Nonfinancial Business | 21.04 | 21.56 | 21.63 | 21.56 | 21.74 | 21.91 |
| Federal Government | 29.47 | 31.62 | 31.02 | 31.62 | 31.88 | 32.00 |
| State and Local Governments | 3.40 | 3.49 | 3.50 | 3.49 | 3.52 | 3.60 |
Accessible version | CSV | Data Dictionary |
Accessible version | CSV | Data Dictionary |
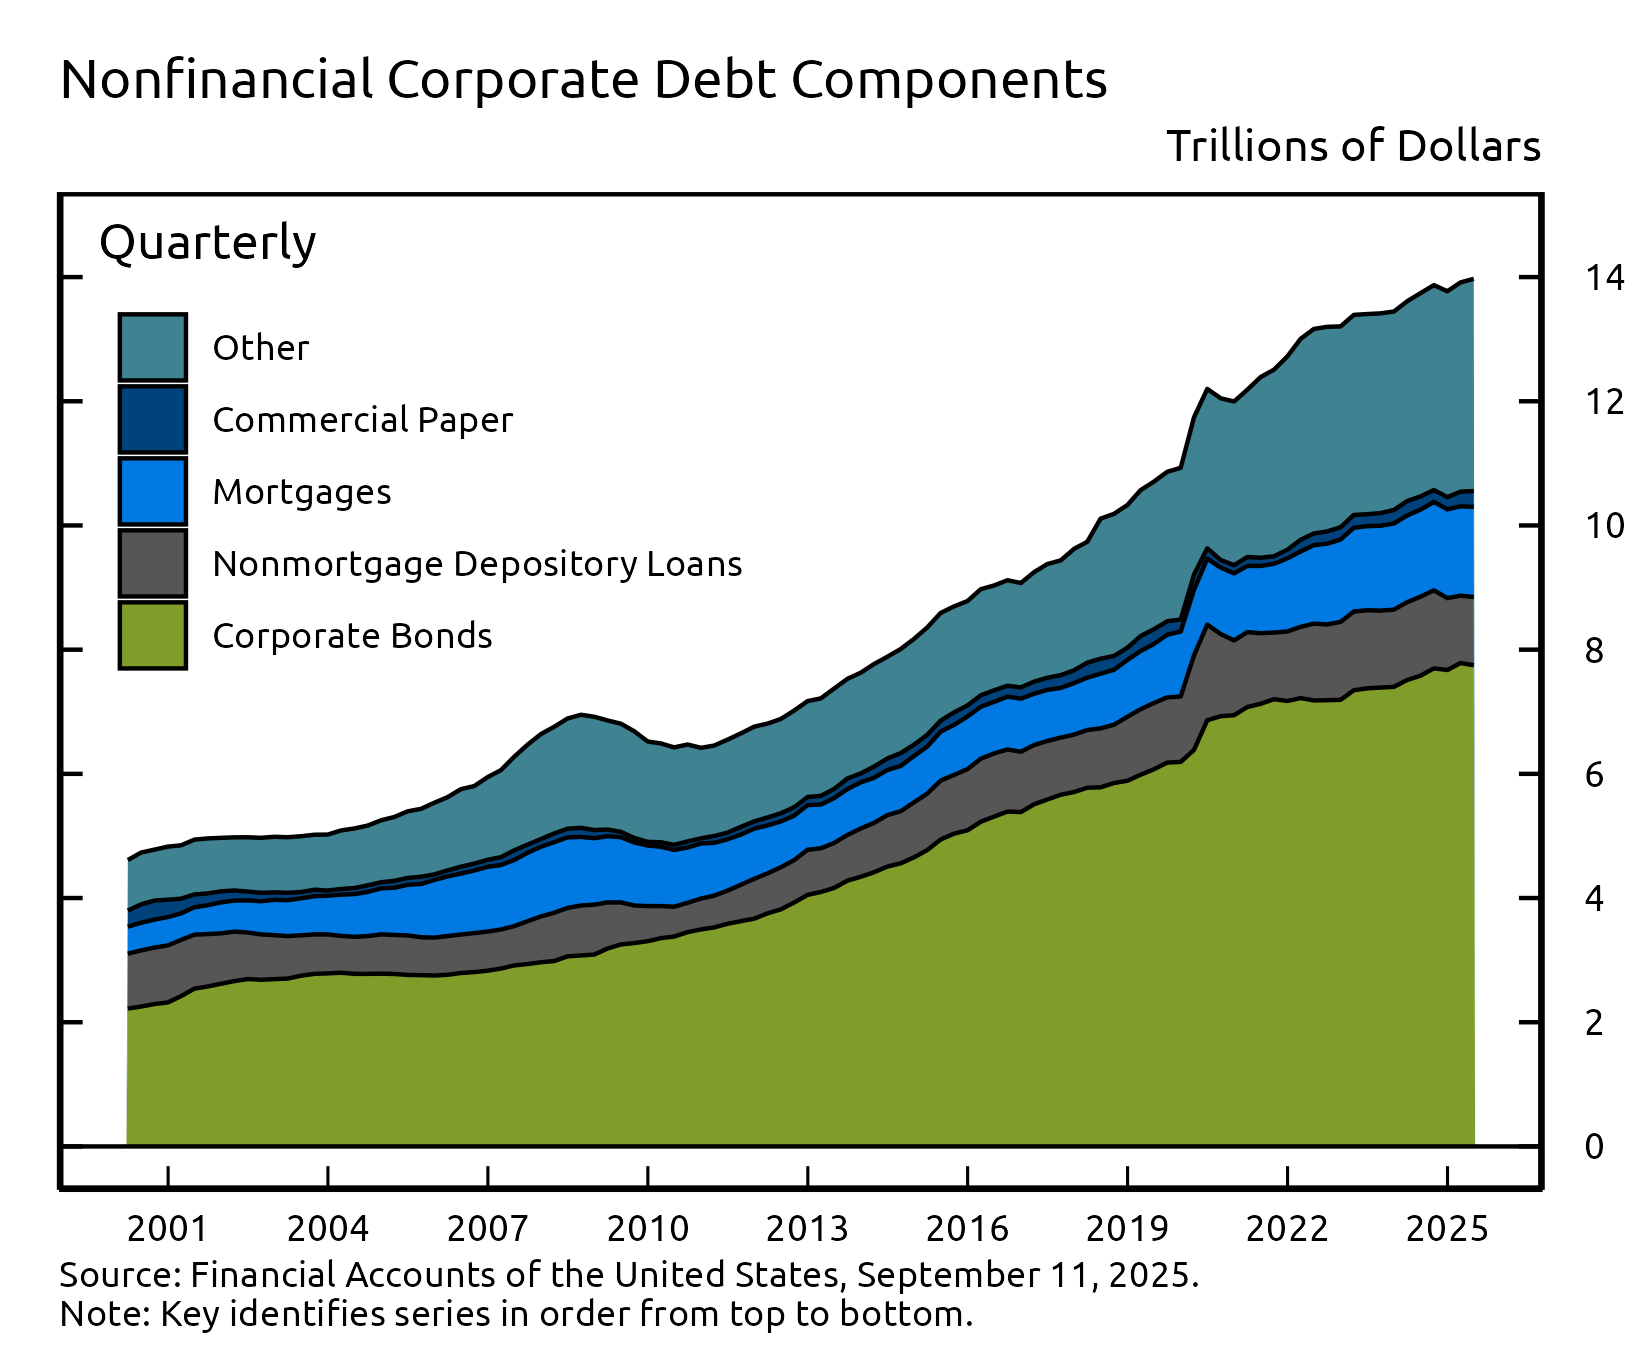
Looking at the components of nonfinancial business debt, corporate bonds decreased by about $37 billion in the second quarter while mortgage loans increased by $59 billion. Commercial paper outstanding rose by about $18 billion while nonmortgage loans at depository institutions increased by about $56 billion. Other nonbank nonmortgage loans rose by $38 billion in the second quarter.
Outstanding nonfinancial corporate debt was $14.0 trillion. Corporate bonds, at roughly $7.7 trillion, accounted for 55% of the total debt. Mortgage loans were about $1.4 trillion, while nonmortgage depository loans were approximately $1.1 trillion. Other types of debt include loans from nonbank financial institutions, loans from the federal government, industrial revenue bonds, and commercial paper.
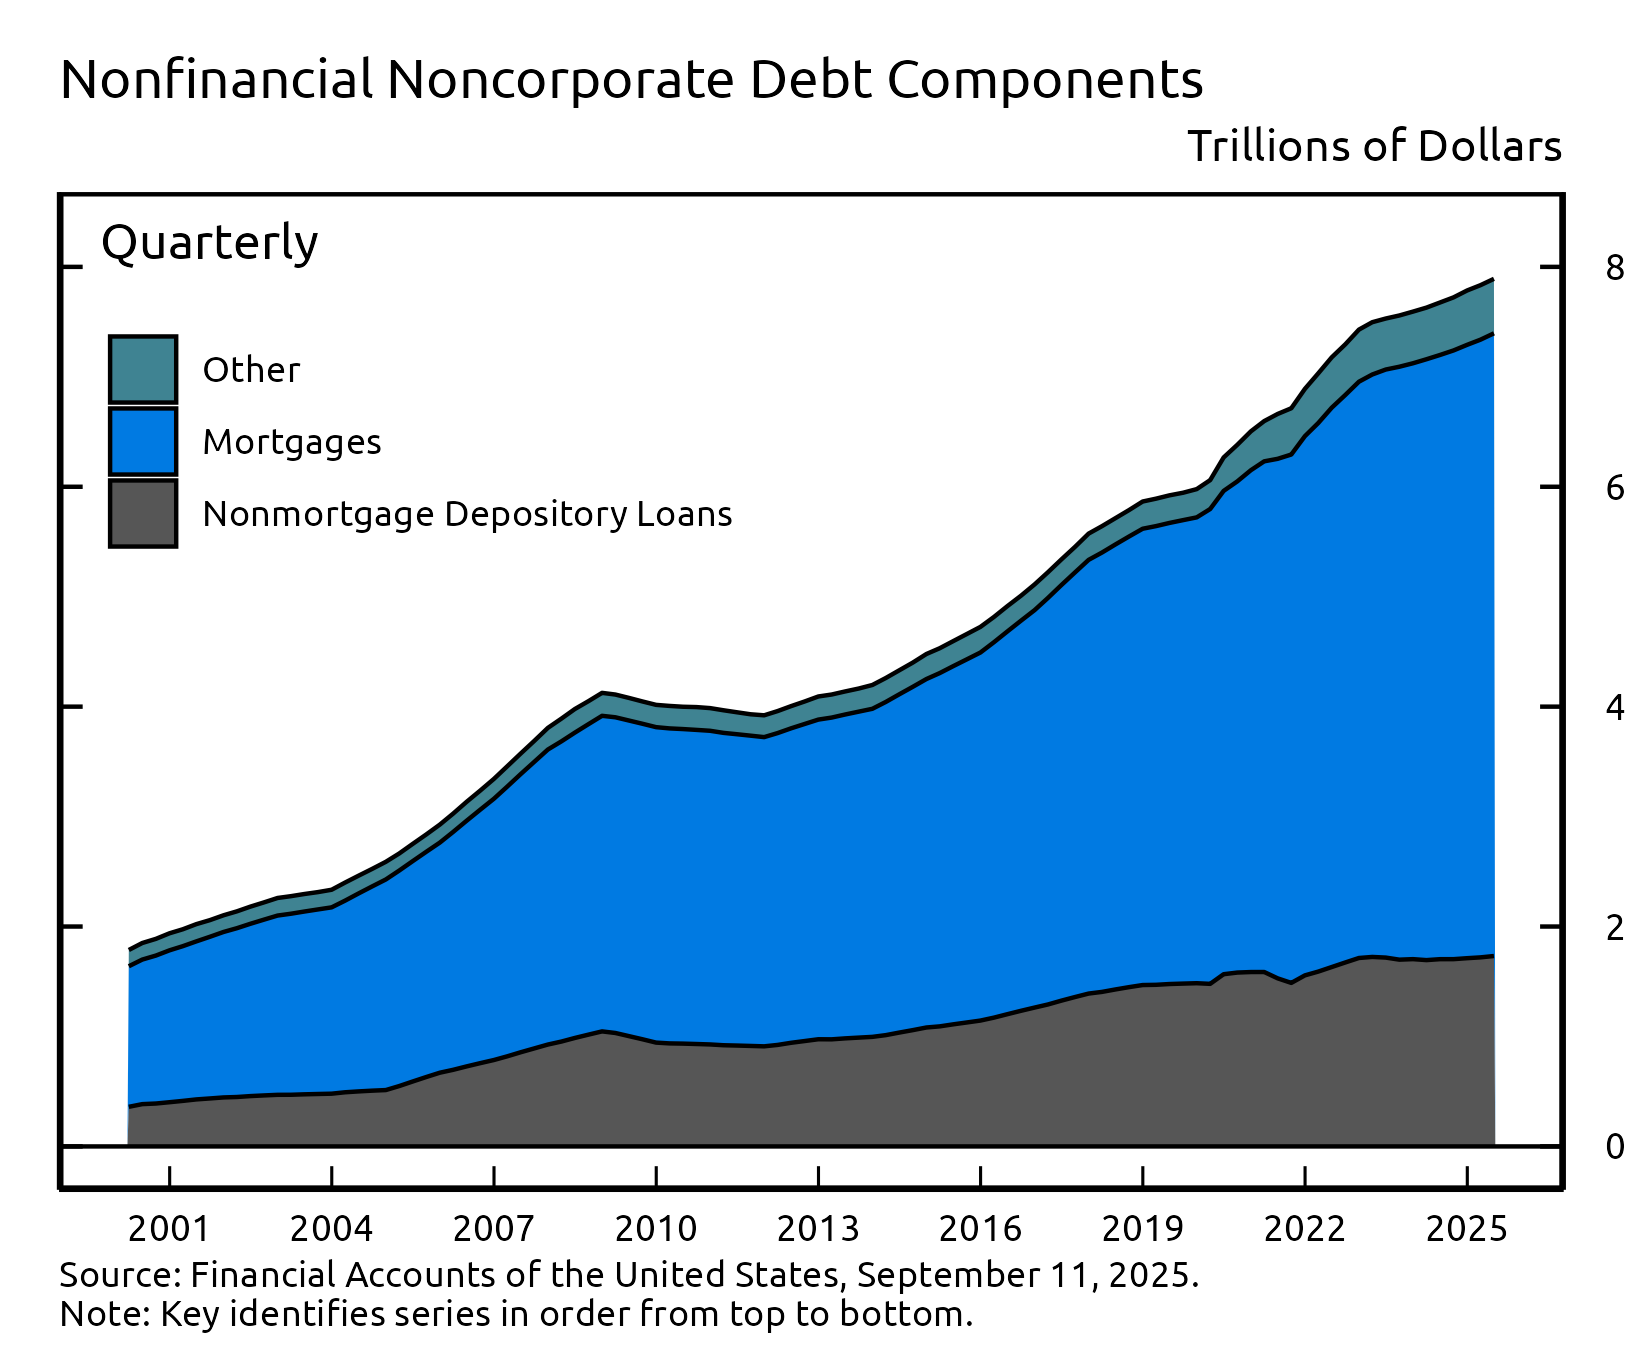
The nonfinancial noncorporate business sector consists mostly of smaller businesses, which are typically not incorporated. Nonfinancial noncorporate business debt was $7.9 trillion in the second quarter. Mortgage loans, at roughly $5.7 trillion, accounted for about 72% of the total, while nonmortgage depository loans ($1.7 trillion) accounted for most of the remainder.
Accessible version | CSV | Data Dictionary |
Accessible version | CSV | Data Dictionary |
For more data on nonfinancial business balance sheets, including debt, see tables B.103 and B.104.
Coming soon
- Enhanced
Financial Accounts Projects will be updated on Friday,
September 19, 2025, including the Distributional Financial
Accounts, which provide a quarterly estimate of the
distribution of U.S. household wealth.
- Financial Accounts data for the third quarter of 2025 will be published on Thursday, December 11, 2025, at 12:00 noon.
Chart Notes
- Changes in net worth consist of transactions, revaluations, and other volume changes. Corporate equity and debt securities include directly and indirectly held securities. Real estate is the value of owner-occupied real estate. Other includes equity in noncorporate businesses, consumer durable goods, fixed assets of nonprofit organizations, and all other financial assets apart from corporate equities and debt securities, net of liabilities, as shown on table B.101 Balance Sheet of Households and Nonprofit Organizations.